On September 11, Live Science reported on an unreviewed preprint modeling what a collapsing Atlantic Meridional Overturning Circulation, the deep ocean current that carries heat north through the Atlantic, would do to global food production. Live Science reports, quoting ALLFED co-author Michael Hinge, that the model produces a "very nasty brown splodge" of reduced precipitation over India, Pakistan and big parts of China, alongside an estimated 17 to 40 percent rise in global food prices and roughly 3 percent crop losses for American wheat and corn. It is a striking story, and it is also, structurally, an Atlantic-basin story. The current's fate gets framed as a threat to European winters and American harvests, with India named once, in a list, as somewhere the rain also gets worse.
It is worth slowing down on that framing. India is not a footnote here. A separate, peer-reviewed line of climate research puts a specific figure on the exposure, and that figure belongs in the lede, not the appendix.
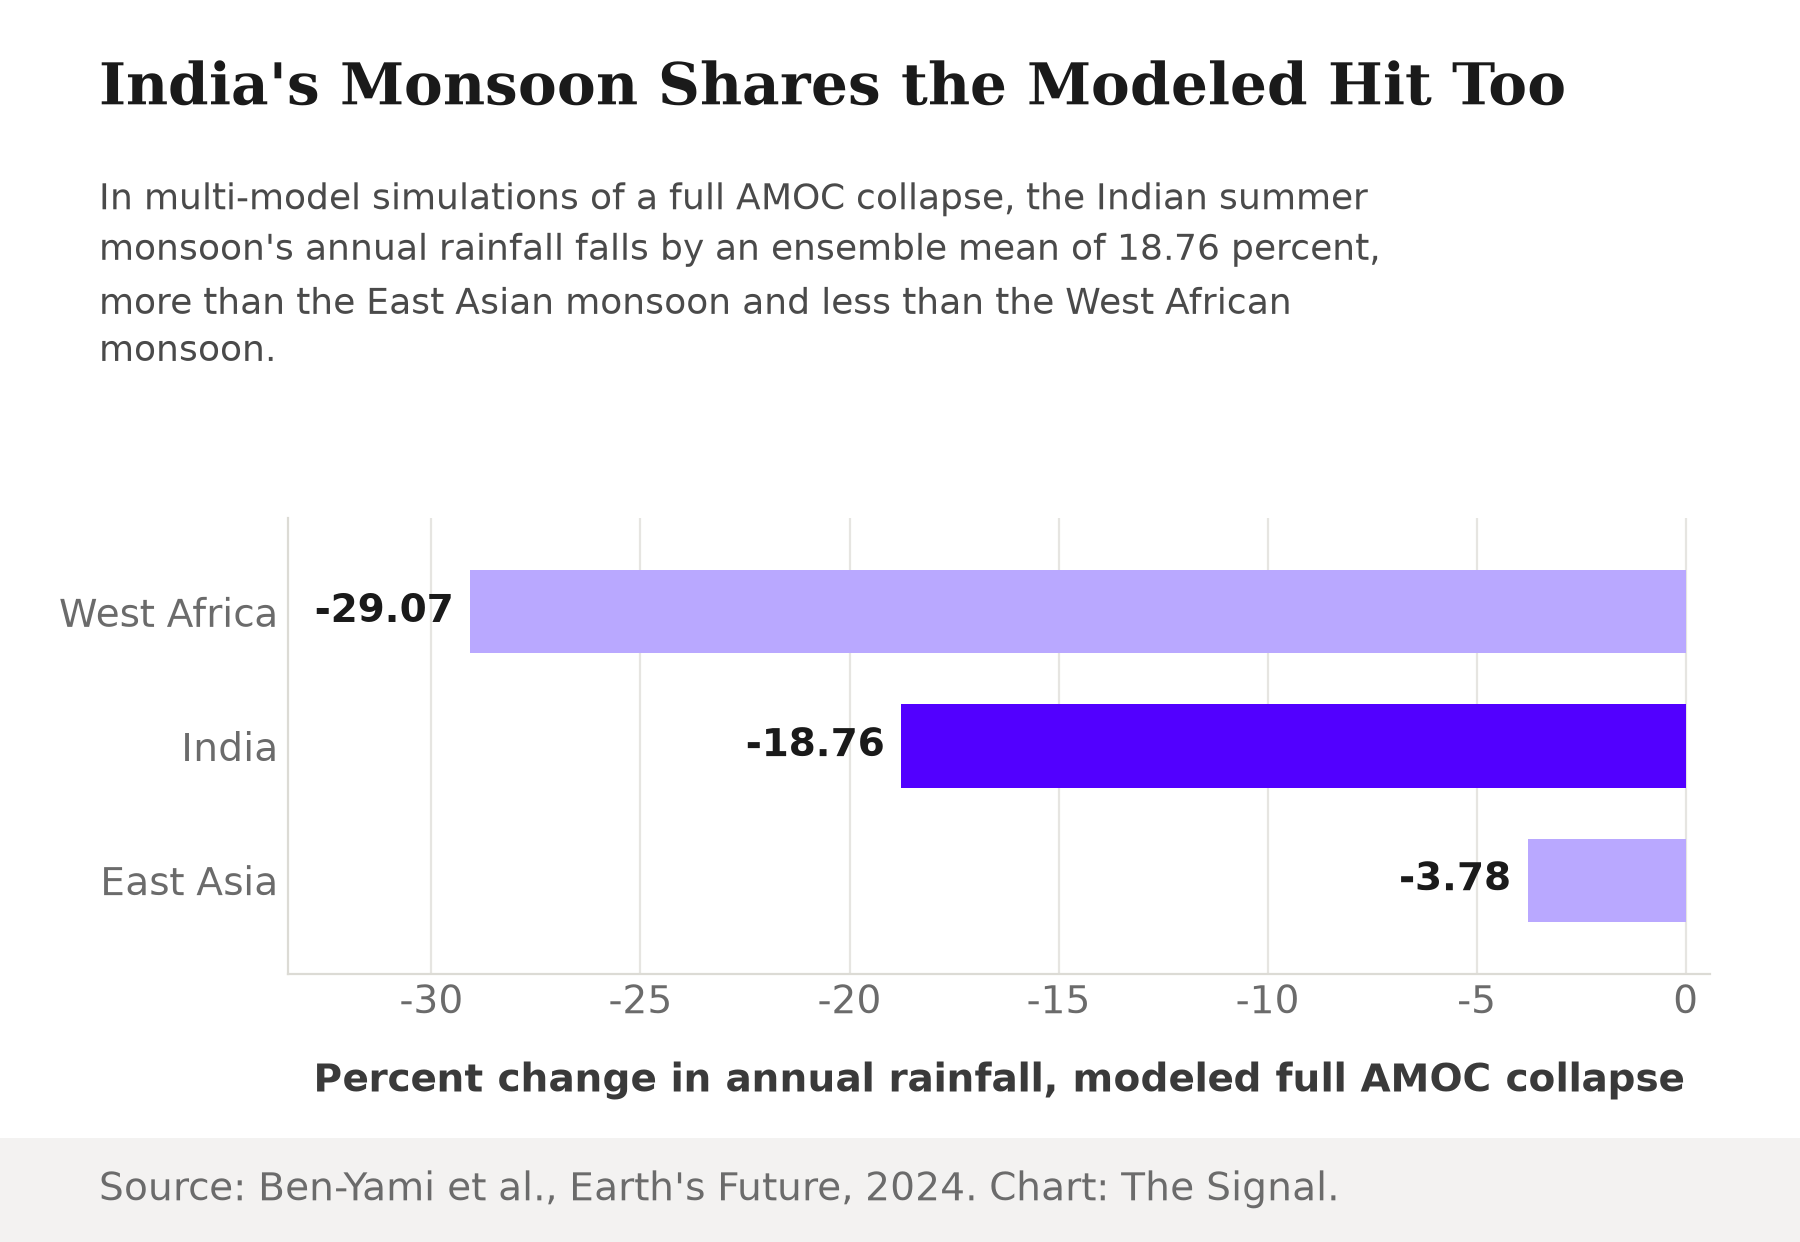
The figure is 18.76. A 2024 multi-model comparison in Earth's Future finds that in simulations of a full AMOC collapse, the Indian summer monsoon's annual rainfall falls by an ensemble mean of 18.76 percent, more than the East Asian summer monsoon's modeled 3.78 percent decline and less than the West African monsoon's modeled 29.07 percent decline. India's monsoon is not the worst-hit system in these models. It is also nowhere near the least affected.
India's modeled monsoon loss sits between West Africa's and East Asia's.
None of this describes the Atlantic Ocean today. A 2021 Nature Geoscience paleoclimate-proxy reconstruction finds that the Atlantic Meridional Overturning Circulation is currently distinctly weaker than it has been for the last millennium, the product of an initial nineteenth-century weakening and a faster mid-twentieth-century decline. Weaker is not collapsed. The monsoon numbers above describe a hypothetical full shutdown, the kind of scenario climate modelers force in simulations to test the system's limits, not a forecast for any specific year. That distinction matters and this piece keeps it: the current is real and weakening; a collapse is a modeled scenario, not an event on the calendar.
The mechanism behind the number
The Indian monsoon does not show up in these simulations by accident. A 2026 Journal of Climate study reports that in these freshwater-hosing simulations, northward ocean heat transport in the Atlantic falls by more than 80 percent, and the southern branch of the Intertropical Convergence Zone weakens and shifts south, with the sharpest precipitation decrease over the Arabian Sea and a smaller decrease over the Indian subcontinent itself. The Intertropical Convergence Zone is the band of rising air and heavy rain that migrates with the sun each year and effectively drives the monsoon. A slowdown in the Atlantic does not stay in the Atlantic. It drags that rain belt south with it, and the Indian monsoon sits downstream of the shift whether or not the coverage of the Atlantic story mentions it.
This year's monsoon already opened under pressure
None of this needed a modeled collapse to matter in 2026. The India Meteorological Department's April 2026 long-range forecast states that seasonal rainfall for the country as a whole was likely to be 92 percent of the Long Period Average, with a model error of plus or minus 5 percent. A below-normal forecast is the baseline this year's southwest monsoon season, running June through September, started from. A system that opens a season already short on rainfall has less room to absorb any further shock, modeled or otherwise.
What's actually riding on the rain
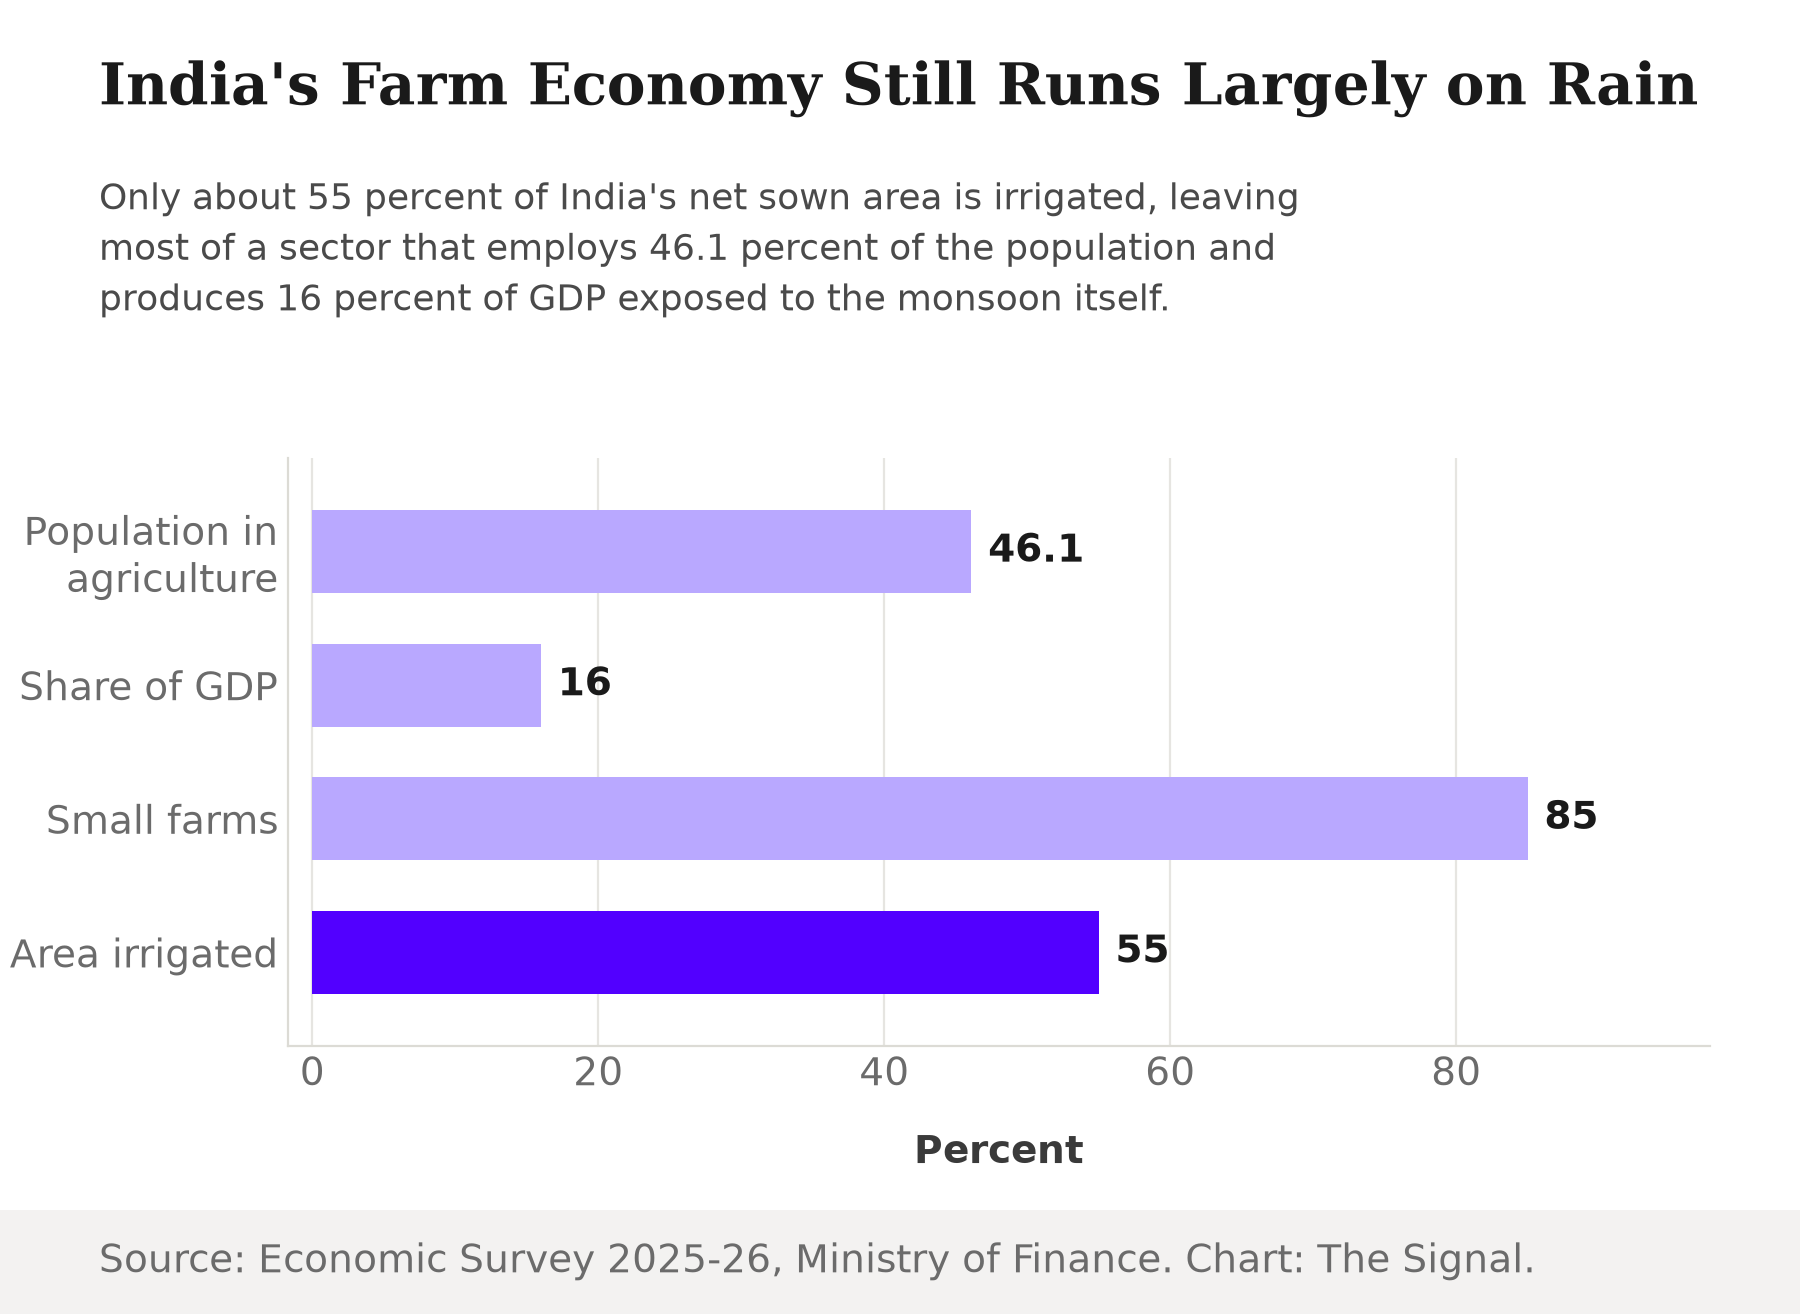
The reason a percentage point of monsoon rainfall carries weight in India, and not just in a climate model, is structural. The Economic Survey 2025-26 reports that agriculture and allied activities support about 46.1 percent of India's population and contribute roughly 16 percent of GDP at FY24 prices, that marginal and small farmers make up about 85 percent of agricultural holdings, and that only about 55 percent of the net sown area is irrigated. Irrigation is the buffer that lets a farm shrug off a bad monsoon. Less than 55 percent of India's cropped area has it.
Irrigation covers barely more than half of India's net sown area.
The global food math
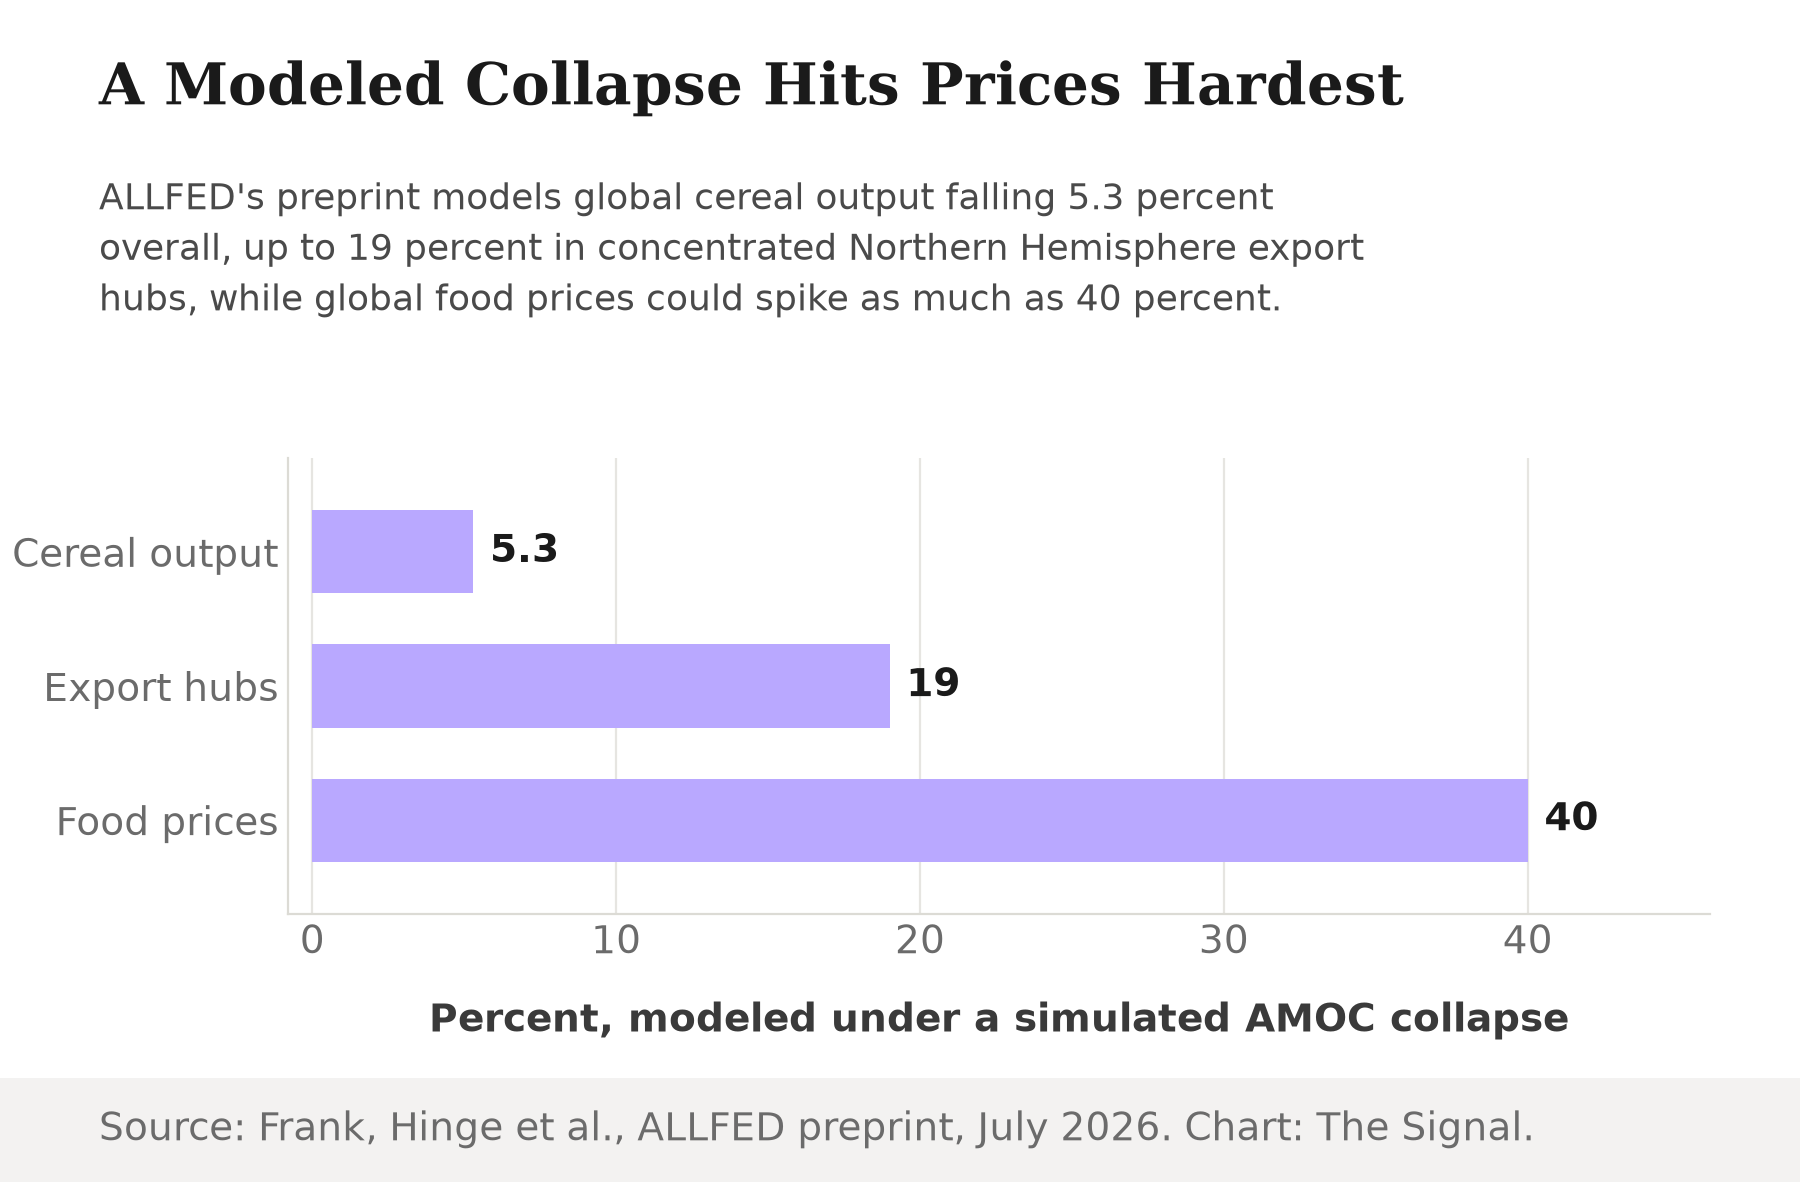
The ALLFED preprint that Live Science covered is not only about rainfall maps. An unreviewed ALLFED preprint, posted July 7, 2026, estimates a 5.3 percent structural decline in global wheat, maize and rice production, with production collapses of 12 to 19 percent concentrated in Northern Hemisphere export hubs, and cereal prices structurally spiking by up to 40 percent. Production falls by single digits overall; prices move by many multiples of that. A modeled AMOC collapse hits the market for food harder than it hits the harvest itself, because the losses concentrate in a handful of exporting regions rather than spreading evenly.
A modeled collapse moves prices far more than it moves output.
The honest objection
The strongest case against dwelling on any of this is that the ALLFED preprint is exactly that, an unreviewed preprint, not yet peer-reviewed, modeling a hypothetical full shutdown rather than a near-term prediction. A single unreviewed paper modeling that kind of scenario is thin ground for a food-security alarm on its own, and Live Science's own report on it frames it with hedges rather than certainty.
That objection is fair, and it is also narrower than it looks. Strip the ALLFED preprint out entirely and the case for taking India's exposure seriously does not collapse with it. The monsoon mechanism comes from a separate, peer-reviewed model comparison in Earth's Future and a mechanism study in the Journal of Climate, neither of which depends on ALLFED's food-price modeling being right. And India's own vulnerability, an under-irrigated farm sector that still carries half the population, is not going anywhere. Neither is a 2026 season that opened under an official below-normal forecast: that forecast is this year's recorded data, not a hypothetical model's output. The preprint can be wrong about the price multiplier and the monsoon story still holds.
The Signal
Three research threads point the same direction without ever citing each other for that purpose: a paleoclimate reconstruction showing the Atlantic current at its weakest point in over a millennium, a peer-reviewed model comparison putting a number on what a full collapse would do to the Indian monsoon, and a fresh preprint on what that kind of shock does to global food prices. None of them says a collapse is imminent, or that this year's below-normal monsoon is the Atlantic current's doing. Together, they say the Indian monsoon is not a spectator to the Atlantic Ocean's slow-motion story. Any accounting of what a weakening AMOC threatens that stops at Europe's winters and America's wheat belt is incomplete by design, not by evidence. The number to watch is not whether the AMOC collapses. It is whether the next round of monsoon-teleconnection research keeps finding India in the data, whether or not it keeps finding India in the headline.
| Study or source | Key figure | As of |
|---|---|---|
| Caesar et al., Nature Geoscience | AMOC weakest in over 1,000 years | 2021 |
| Ben-Yami et al., Earth's Future | Indian monsoon down 18.76 percent under a modeled AMOC collapse | 2024 |
| Li et al., Journal of Climate | Atlantic heat transport down over 80 percent, ITCZ shifts south | 2026 |
| ALLFED preprint | Global cereal output down 5.3 percent, prices up to 40 percent | July 2026 |
| Live Science, quoting Michael Hinge | Food prices up 17 to 40 percent, US wheat and corn down about 3 percent | September 2026 |
| Economic Survey 2025-26 | 46.1 percent of population in agriculture, only 55 percent irrigated | FY24 |
| India Meteorological Department | 2026 monsoon forecast at 92 percent of the Long Period Average | April 2026 |
Table: The Signal, compiled from the sources linked above.
Reporting basis: the Atlantic current's weakened state comes from Caesar et al.'s 2021 paleoclimate reconstruction in Nature Geoscience. The regional monsoon comparison under a modeled AMOC collapse is from Ben-Yami et al.'s 2024 paper in Earth's Future. The ITCZ-shift mechanism is from Li et al.'s 2026 study in the Journal of Climate. The global food-production and price modeling is per the ALLFED preprint by Frank, Hinge, Blouin, Jehn, Comerford, Shah, Heredia and Denkenberger, posted July 2026, as also reported by Live Science, whose September 11, 2026 article adds an interview with co-author Michael Hinge and additional figures not in the preprint quote itself, including the food-price range and the US crop-loss estimate. India's agricultural exposure figures are from the Economic Survey 2025-26, Ministry of Finance. The 2026 southwest monsoon forecast is from the India Meteorological Department's April 2026 long-range outlook. No figure in this piece is a Signal calculation; every number is reported directly by the source cited.