By the India Meteorological Department's own classification, this year's monsoon in Delhi is "Excess." Through 11 August 2026, the capital's cumulative seasonal rainfall reached 397.7 mm against IMD's normal of 320.2 mm, a surplus of 24 percent. That is the kind of number that closes a monsoon story: rain is good, the season is on track. It is also the number a state government, a reservoir operator, or a national newsroom reaches for first, because IMD reports it as a single figure for the whole city.
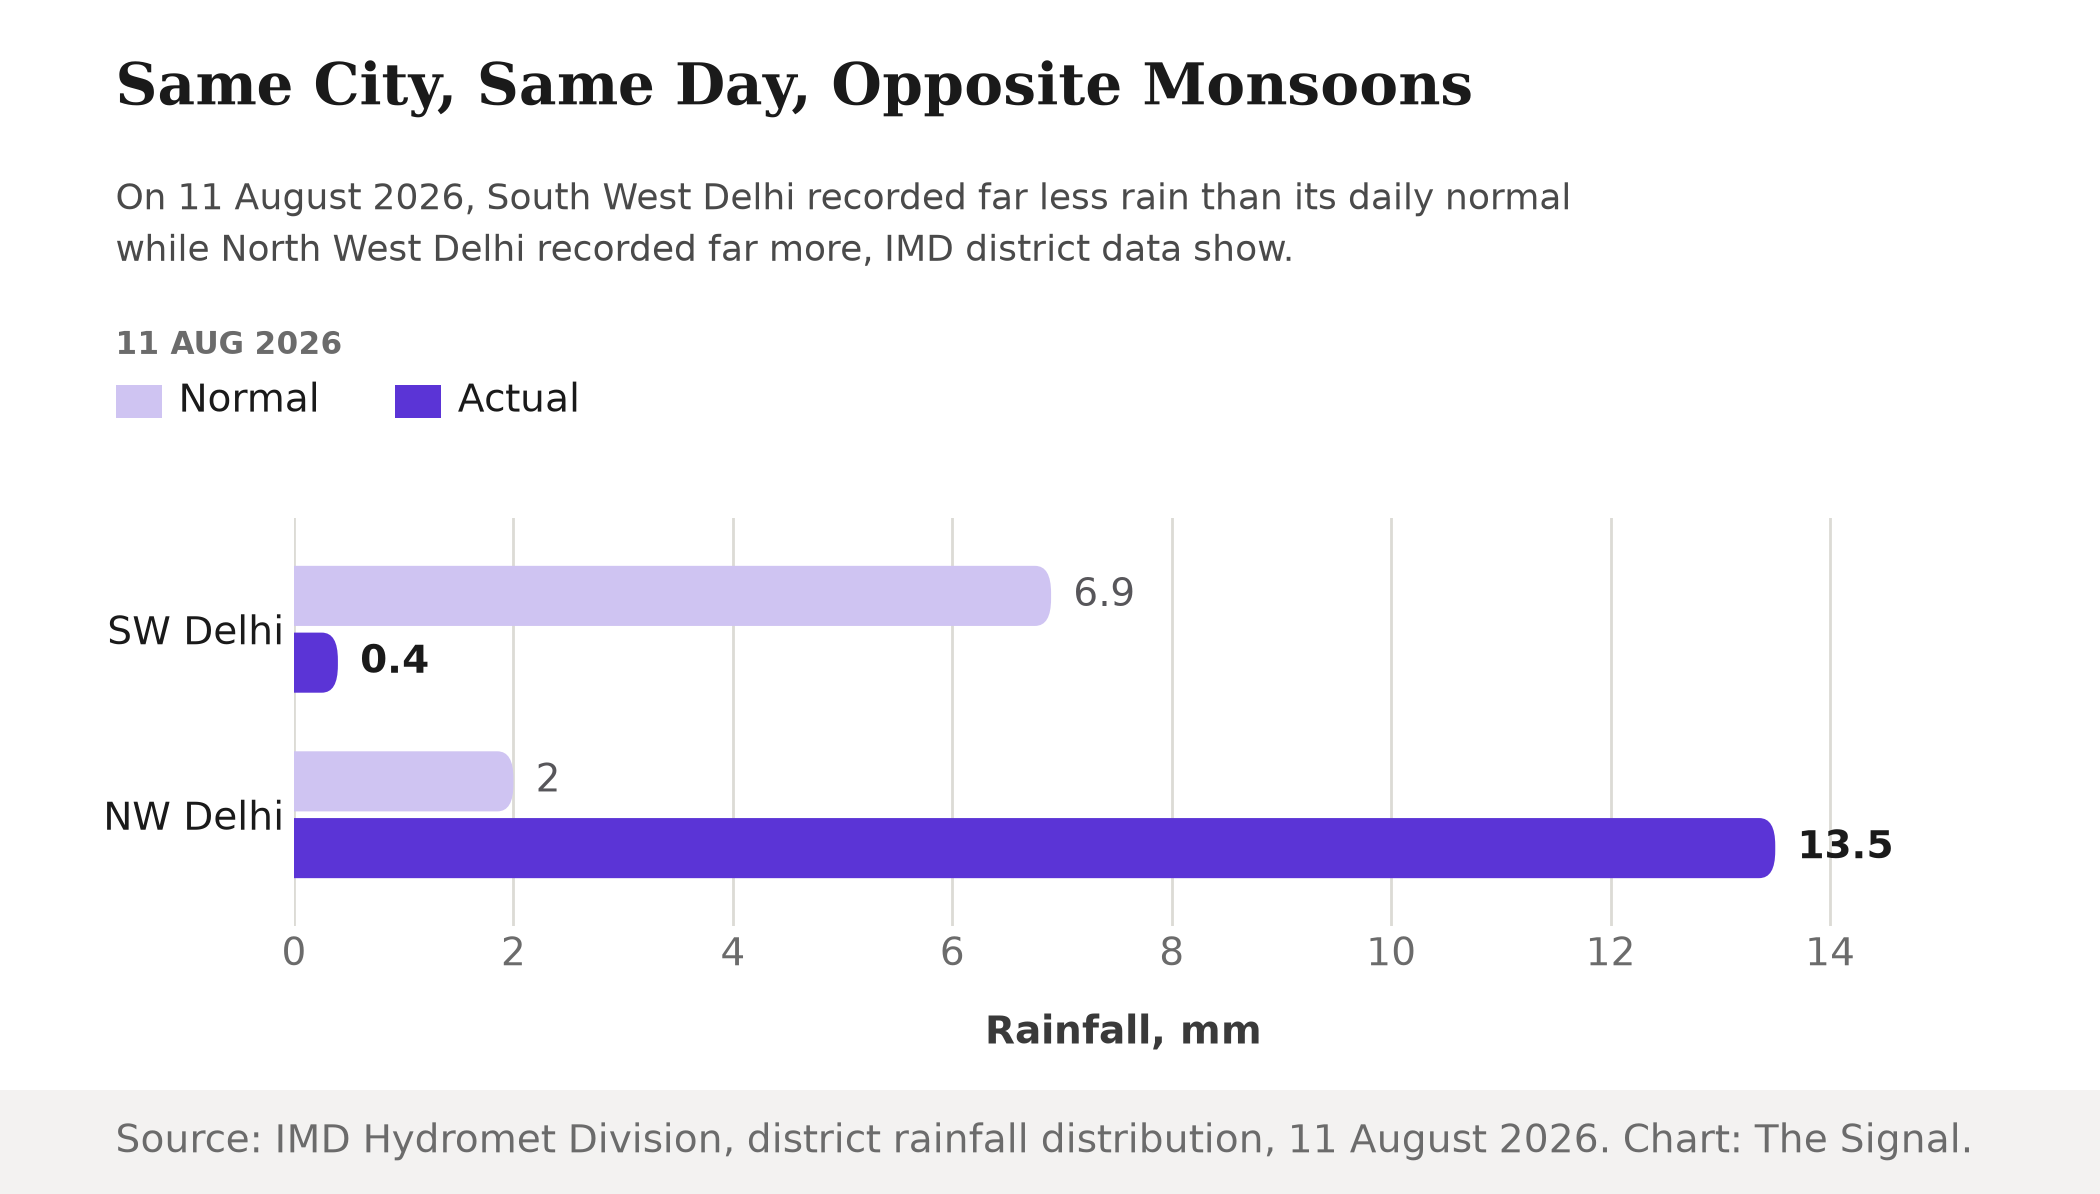
It is worth pulling that single figure apart. IMD does not report Delhi as one undifferentiated block. It also breaks the capital into ten districts and publishes their rainfall separately, every day. That district-level data for 11 August show South West Delhi receiving 0.4 mm of rain against a daily normal of 6.9 mm, a shortfall of 95 percent, while North West Delhi received 13.5 mm against a normal of 2 mm, a surplus of 575 percent. That is a gap of 670 percentage points between two districts of the same city, on the same day, both folded into the one seasonal number stamped "Excess."
How a Deficit Turned Into an "Excess"
Three weeks earlier, the citywide picture looked nothing like a surplus. In the first four days of August, Delhi's rainfall ran 33 percent below IMD's normal, part of a wider shortfall across the north: Haryana stood 54 percent below normal, Himachal Pradesh 43 percent, Uttar Pradesh 33 percent and Punjab 30 percent.
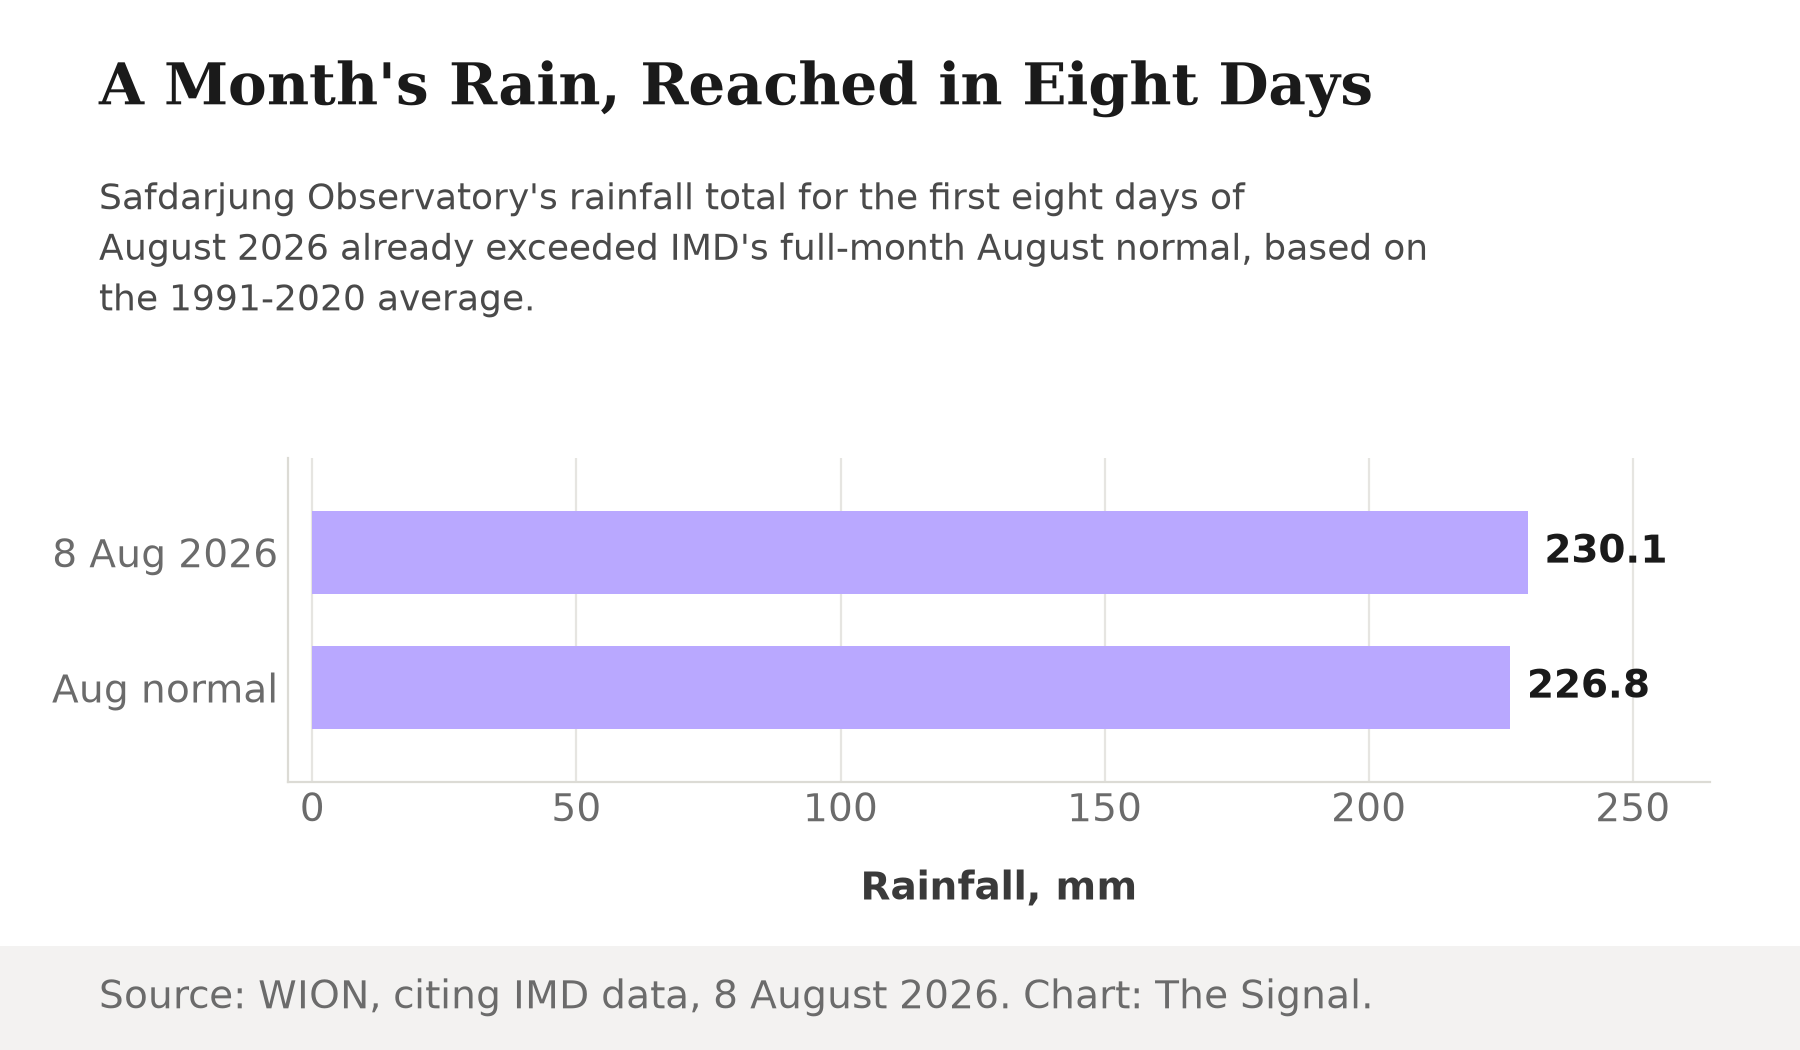
Then the season reversed, fast. Safdarjung Observatory's rainfall total for the first eight days of August already exceeded IMD's full-month August normal of 226.8 mm, the 1991-2020 average, reaching 230.1 mm by the evening of 8 August, with three weeks of the month still to come.
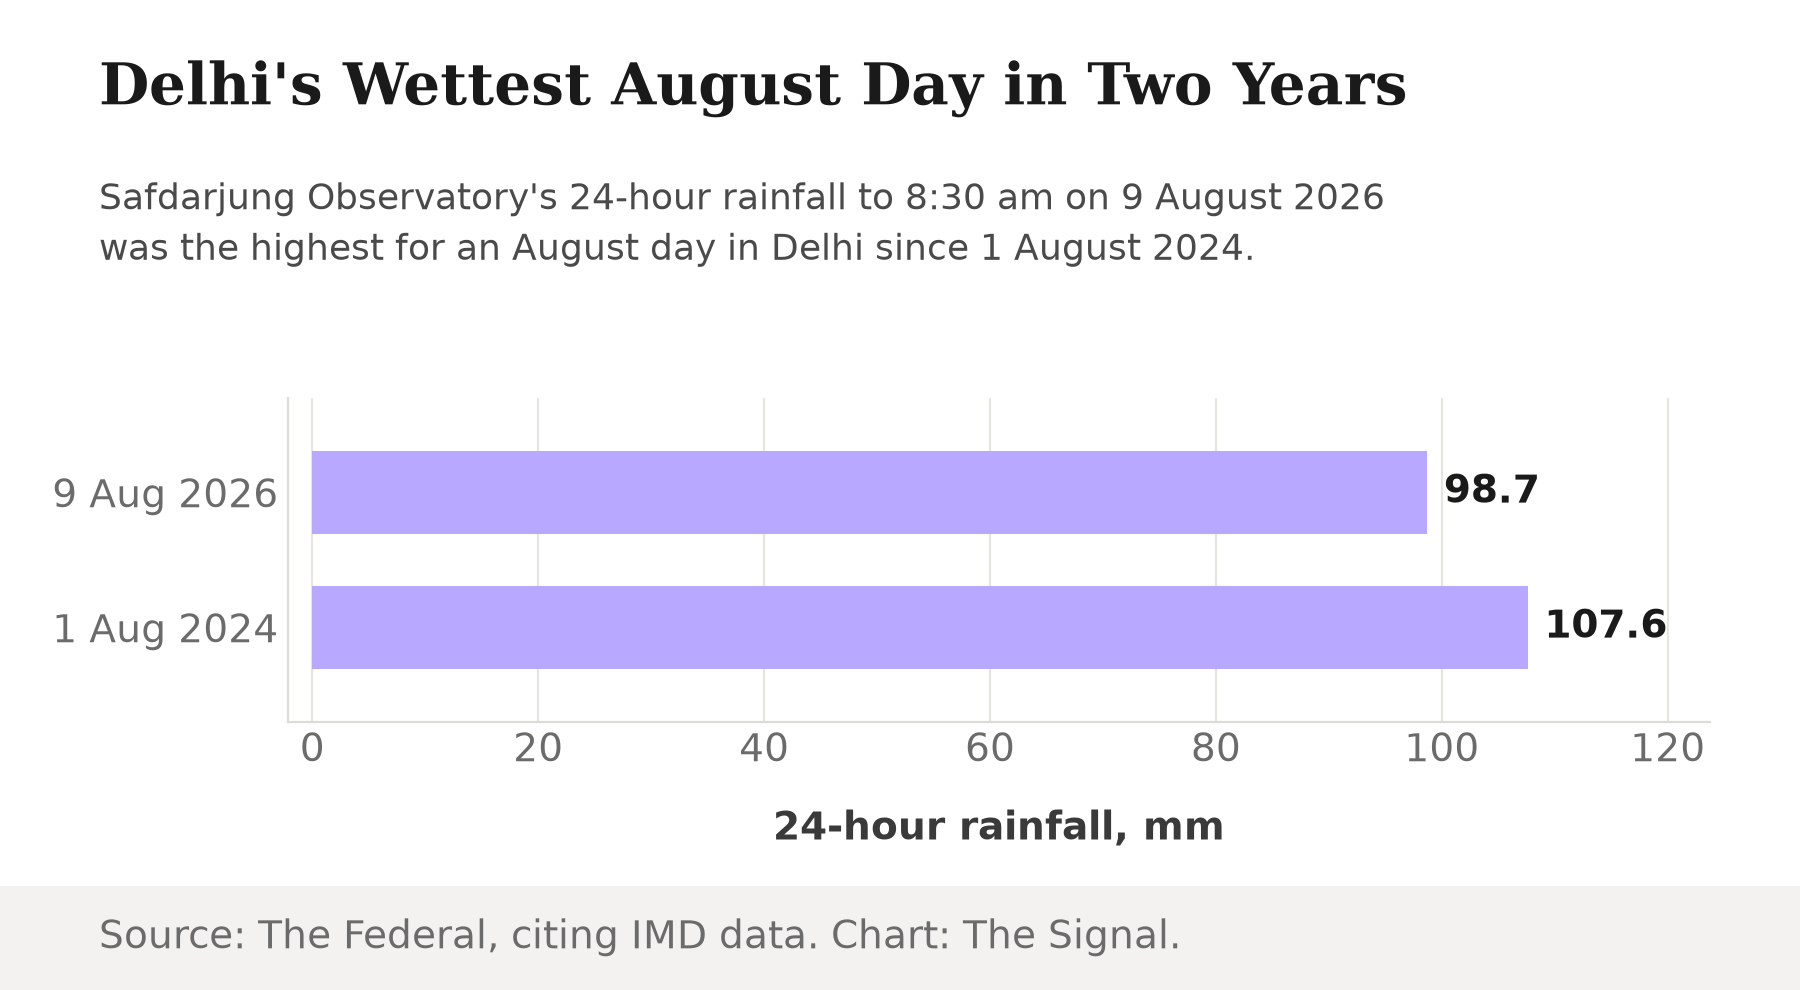
The reason was one concentrated burst. Safdarjung recorded 98.7 mm of rain in the 24 hours to 8:30 am on 9 August, Delhi's wettest August day in two years, since 107.6 mm fell on 1 August 2024.
Delhi's citywide deficit of early August became the citywide surplus IMD recorded through 11 August because of a handful of very wet days concentrated in one stretch of the month, not because every part of Delhi got steadily wetter.
A Forecast Leaning the Other Way
While Delhi's own numbers were swinging from deficit to surplus, IMD's national forecasting had been leaning the other way for that same window. As late as 31 July, IMD's forecast projected India's August 2026 rainfall would most likely come in below 94 percent of the Long Period Average, an LPA it puts at 254.9 mm for the 1971-2020 period. That followed IMD's April 2026 long-range forecast, which had put the entire June-September monsoon season at just 92 percent of the Long Period Average nationally, an LPA of 87 cm for 1971-2020, before the wetter turn that followed.
Neither forecast was written for Delhi specifically, and there is no all-India actual figure here to test them against directly. But they set the working assumption for the country as August opened: a season running dry. Delhi's own trajectory, in the same weeks, ran the other way, and did so unevenly even within its own boundary.
What One Label Cannot Show
This is the part that outlasts any single monsoon. A seasonal classification like "Excess," "Normal" or "Deficient" is a citywide average, and it is exactly the kind of number a drainage engineer, a reservoir operator or a crop-insurance scheme reads off a dashboard and acts on. But the same day that produced Delhi's "Excess" tag also produced a 670-percentage-point spread between two districts a few kilometres apart. A drainage system sized to the city average will under-build for the wetter district and over-build for the drier one, in the same season, using the same number. The same is true of an insurance payout trigger set at a citywide threshold, or a water-release schedule timed to a citywide total: each treats ten different local monsoons as one.
The Honest Objection
The strongest defense of the single citywide figure is statistical, not administrative. A daily district normal of 6.9 mm or 2 mm is a small base, and any percentage built on a base that small will swing hard on a single passing shower. Call it noise, and the case for treating any one day's district departure as evidence of anything is weak.
That defense holds for a single day. It does not explain the citywide reversal itself. Delhi's own seasonal aggregate moved from a real, measured shortfall in early August to a real, measured surplus through 11 August, on cumulative totals in the hundreds of millimetres, not on two-millimetre bases. The unevenness is not only a small-sample artefact at the neighborhood level. The city's own headline number shows the same pattern, just compressed into a single week instead of a single day.
The Signal
"Excess" fairly describes Delhi's monsoon this year, and it is still an incomplete description: true of the city's total, not of any one place inside it. IMD is not hiding this. Its own district tables, published alongside the citywide figure, are what make the 670-point spread visible. The gap is not in the data. It is in which number gets read: the one that closes the story, or the one underneath it that a reservoir operator or a drainage planner actually needs. A season is not simply normal or excess for a city. It is normal for some blocks and excessive for others, in the same week, and sometimes on the same day.
Reporting basis: the citywide seasonal rainfall total and the single-day district rainfall distribution for Delhi are from the India Meteorological Department, via its Regional Meteorological Centre, New Delhi and its Hydromet Division, both fetched directly. The eight-day crossing of the August normal and the 9 August rainfall record are per WION and The Federal respectively, each citing IMD data; both cover the same underlying IMD reporting rather than offering independent confirmation of each other. The early-August north Indian rainfall shortfall is per ThePrint, citing IMD data. IMD's August and full-season forecasts are per Down To Earth and the Press Information Bureau, respectively citing and republishing IMD's own forecast statements. The 670-percentage-point district spread is The Signal's calculation from the IMD figures cited above.