The Ministry of Science and Technology told Parliament in 2025 that India's rank in the Global Innovation Index has risen from 81st in 2015 to 38th in 2025, a climb the government points to as evidence its research and innovation system is working. Read only that number and the story is a straightforward one: a fast-rising scientific power closing the gap with the countries it competes against.
It is worth slowing down on that. The Global Innovation Index rewards patents filed, ease of doing business, digital infrastructure and venture capital flows nearly as much as it rewards laboratories. The money that is supposed to feed those laboratories has barely moved. India's total research spending, measured as Gross Expenditure on Research and Development, was 0.66% of GDP in 2018-19, 0.66% in 2019-20 and 0.64% in 2020-21, a flat-to-declining share that the Ministry of Science and Technology itself reported to Parliament.
India spends less of its economy on research than every country it is usually compared with.
World Bank data show India put 0.65% of GDP into research and development in 2020, against 2.36% in China, 3.42% in the United States, 4.52% in South Korea and 5.83% in Israel, the most recent year for which comparable figures exist across all five countries.
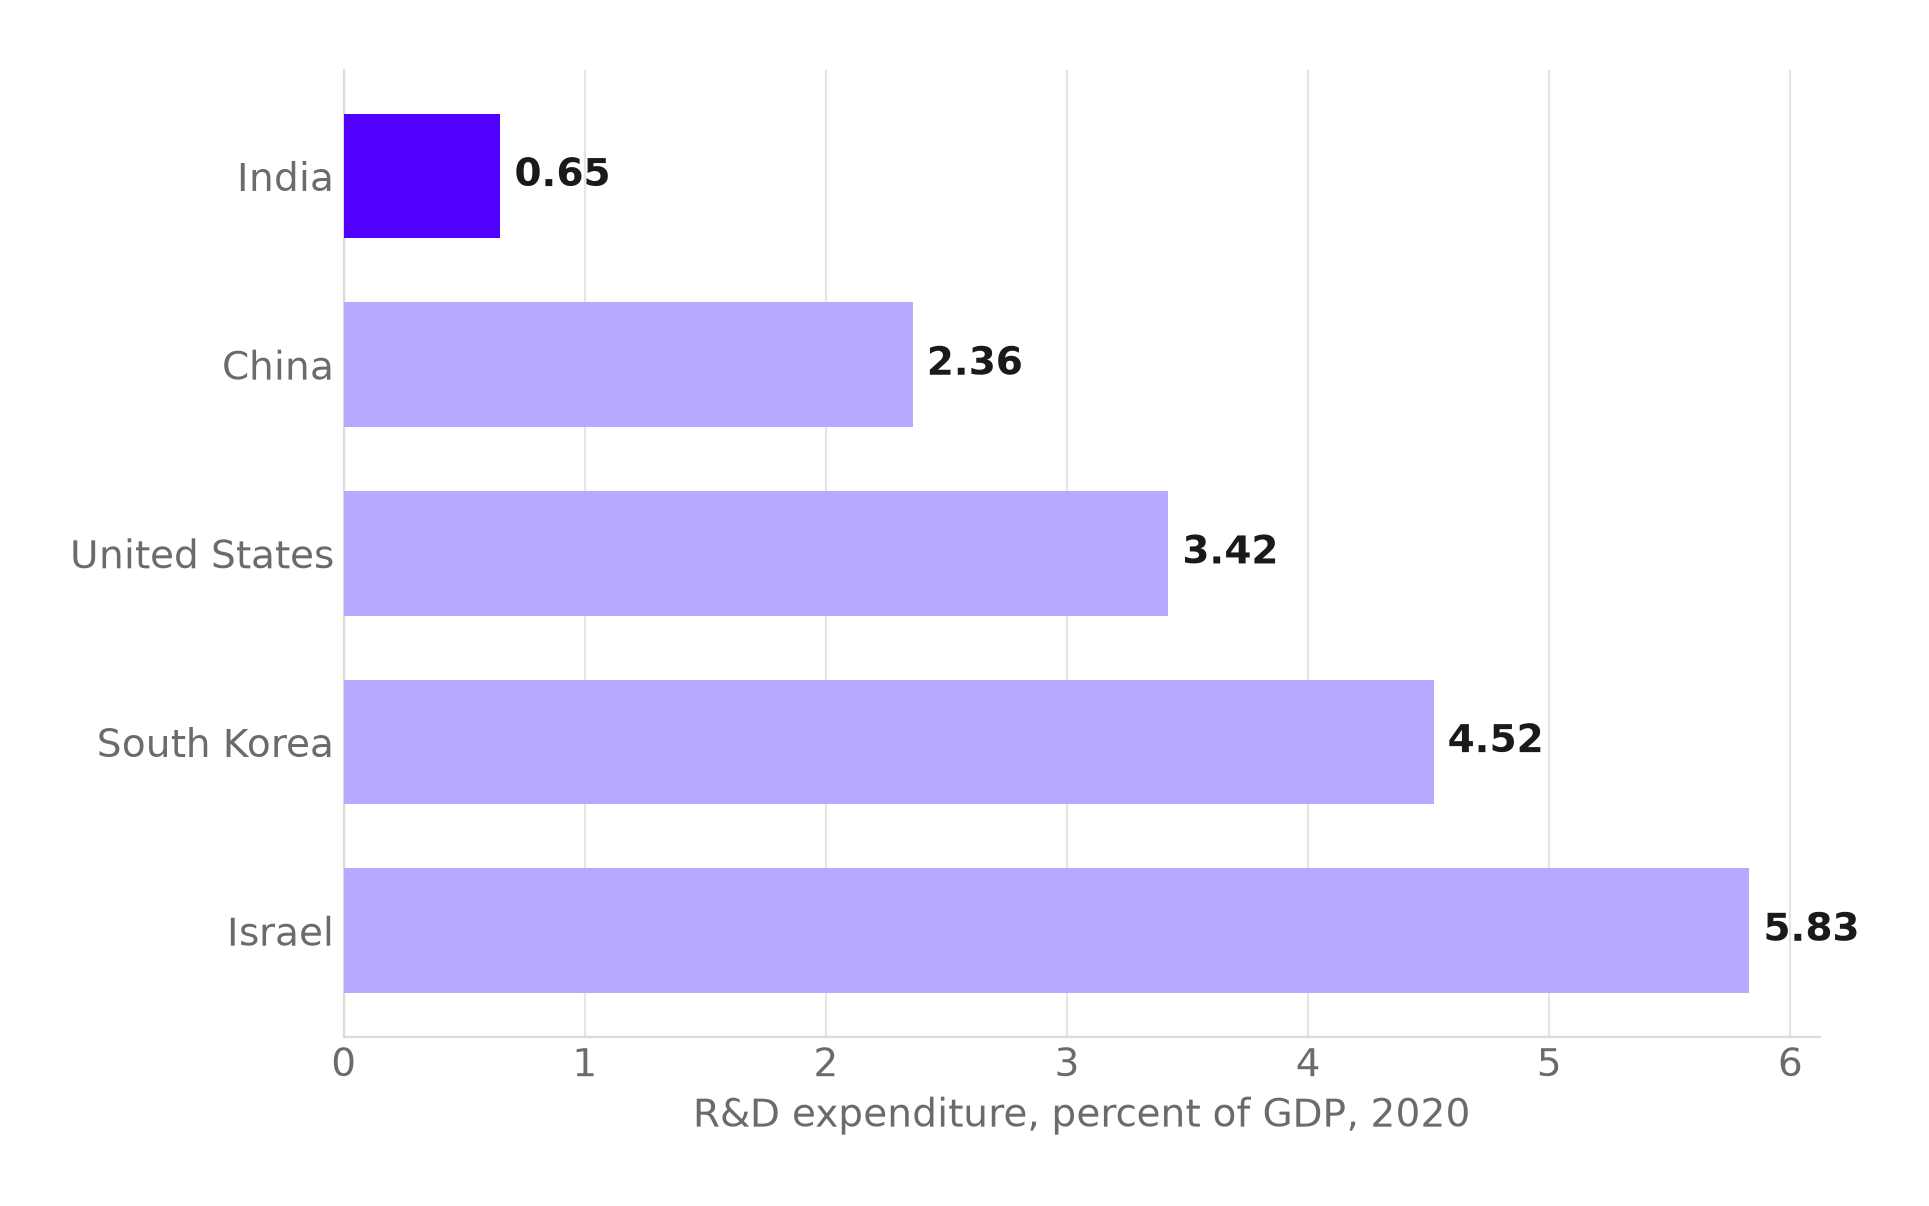
Source: World Bank, World Development Indicators. Chart: The Signal.
The total keeps rising. The share of the economy does not
DST's own statistics office reports that Gross Expenditure on R&D more than doubled in rupee terms over the decade to 2020-21, from Rs 60,196.75 crore in 2010-11 to Rs 127,380.96 crore in 2020-21. That sounds like acceleration. It is also exactly why research spending is measured against GDP rather than in rupees alone: an economy that is itself growing fast can post a rising research budget every single year while its research intensity, the share of national output it commits to research, stands still. That is what happened here. The 0.66%, 0.66% and 0.64% readings above cover precisely the years the rupee total was climbing fastest.
Government pays for most of it. Industry barely shows up
GERD in 2020-21 was overwhelmingly government money: the Central Government supplied 43.7%, State Governments 6.7%, Higher Education institutions 8.8% and Public Sector Industry 4.4%, a combined 63.6% from the public side. Private Sector Industry, the businesses that in most research-intensive economies carry the largest share of the bill, supplied just 36.4%.
| Funder | Share of GERD, 2020-21 |
|---|---|
| Central Government | 43.7% |
| Private Sector Industry | 36.4% |
| Higher Education | 8.8% |
| State Governments | 6.7% |
| Public Sector Industry | 4.4% |
Source: DST, R&D Statistics at a Glance 2022-23.
The Ministry of Science and Technology told Parliament that India's private sector contributes only around 36% of GERD, versus more than 70% in China, South Korea and the United States. A funding base this dependent on government matters beyond who signs the cheque: state budgets answer to annual fiscal cycles, not the decade-long horizons basic science needs.
Basic science gets the smallest slice of what is left
Even the research budget that does exist is not tilted toward the open-ended, foundational work that produces new science rather than new products. In 2017-18, only 23.9% of India's national science and technology expenditure, excluding higher education, went to basic research, against 36.9% for applied research and 32.4% for experimental development.
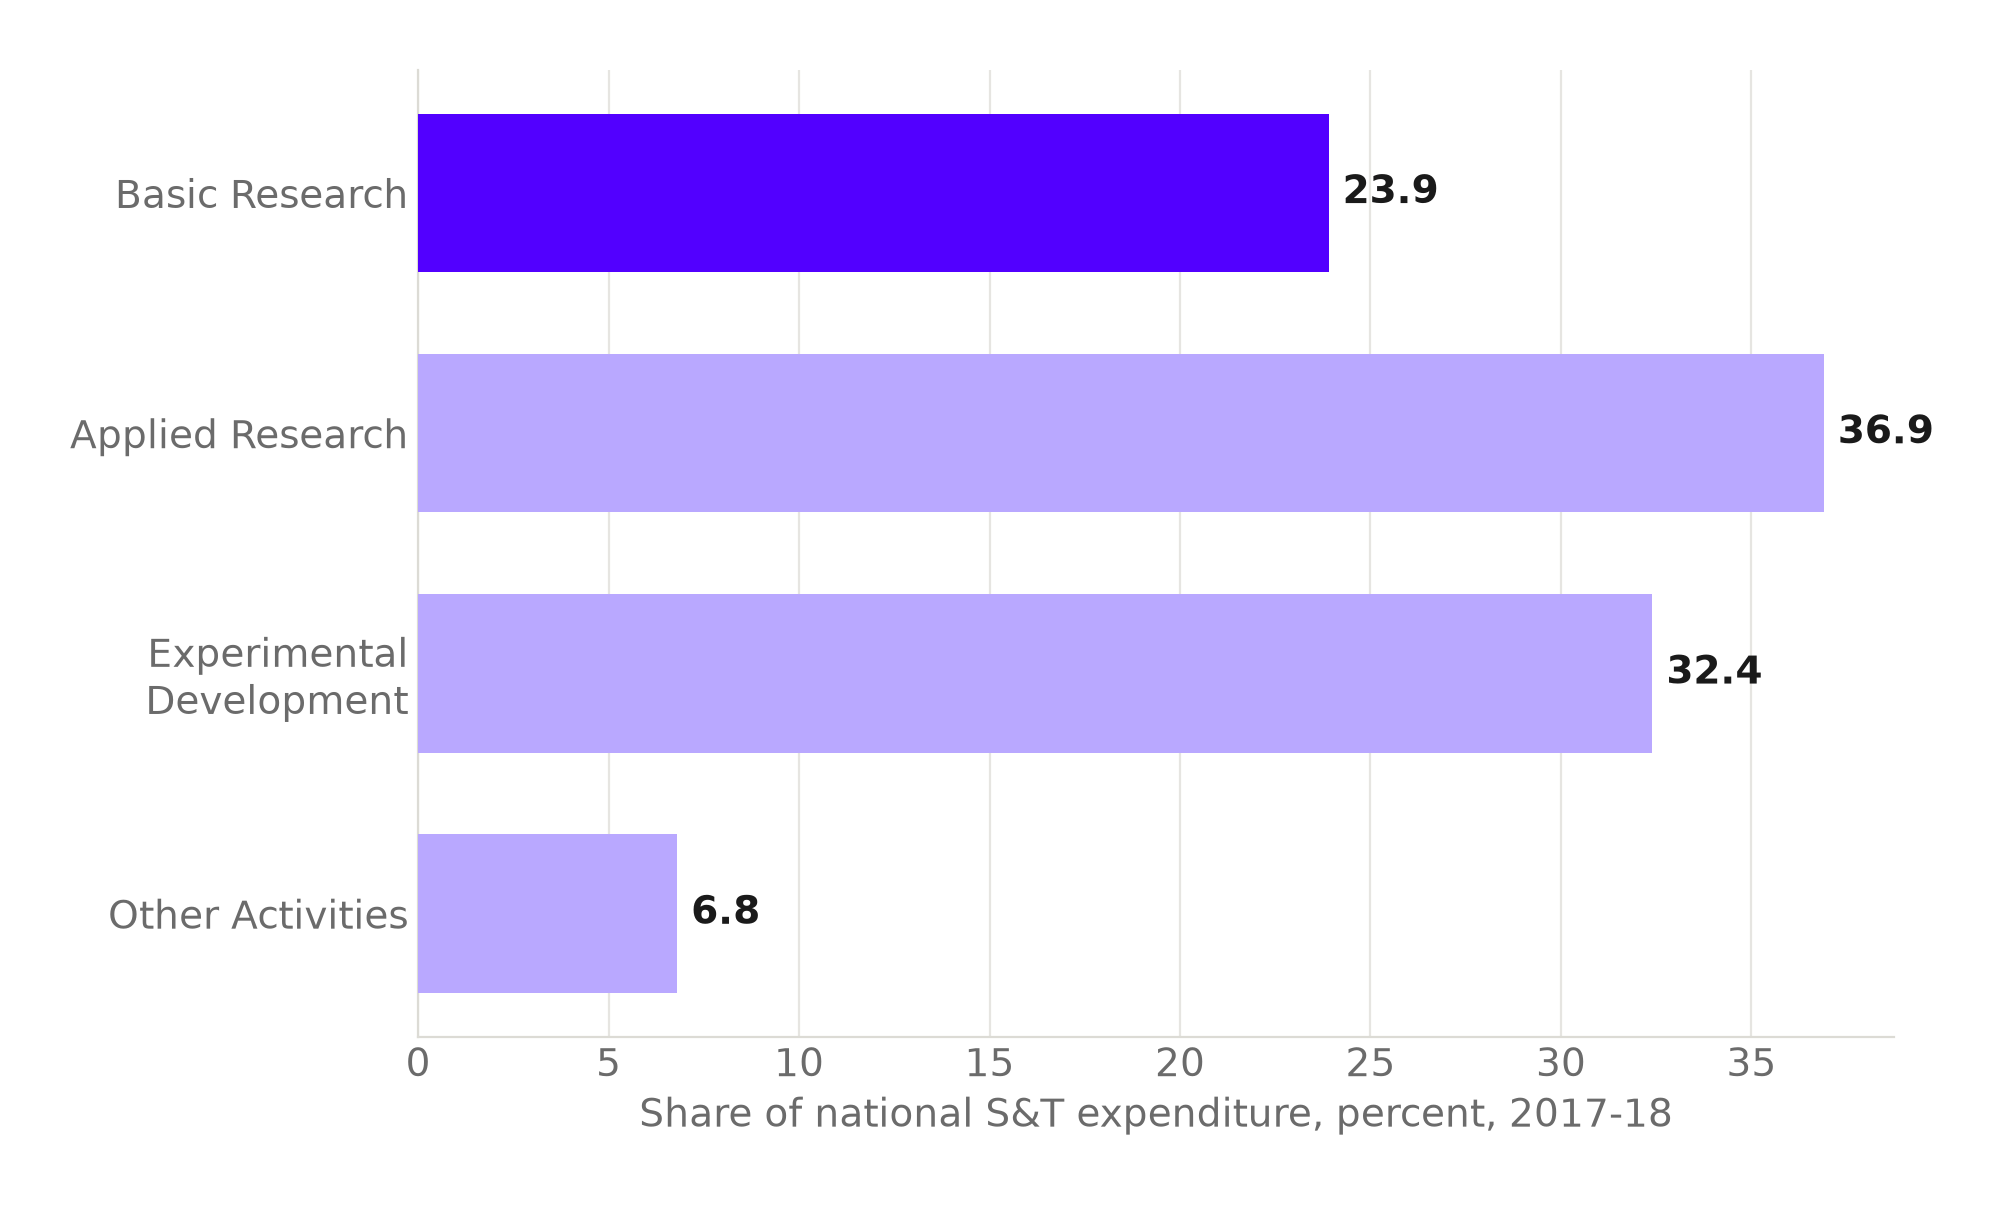
Source: DST, Research and Development Statistics 2019-20. Chart: The Signal.
The pipeline mostly staffs someone else's labs
India is not short of trained scientists at the point of graduation. The country ranked third in the world for PhDs awarded in science and engineering, with 24,474 science and technology doctorates in 2018-19, behind only the United States' 41,071 and China's 39,768. What happens after graduation is a different story.
World Bank data put India at 259 researchers per million people in 2020, against 8,620 in South Korea, 4,568 in the United States and 1,600 in China: South Korea fields roughly 33 times as many researchers for every million residents.
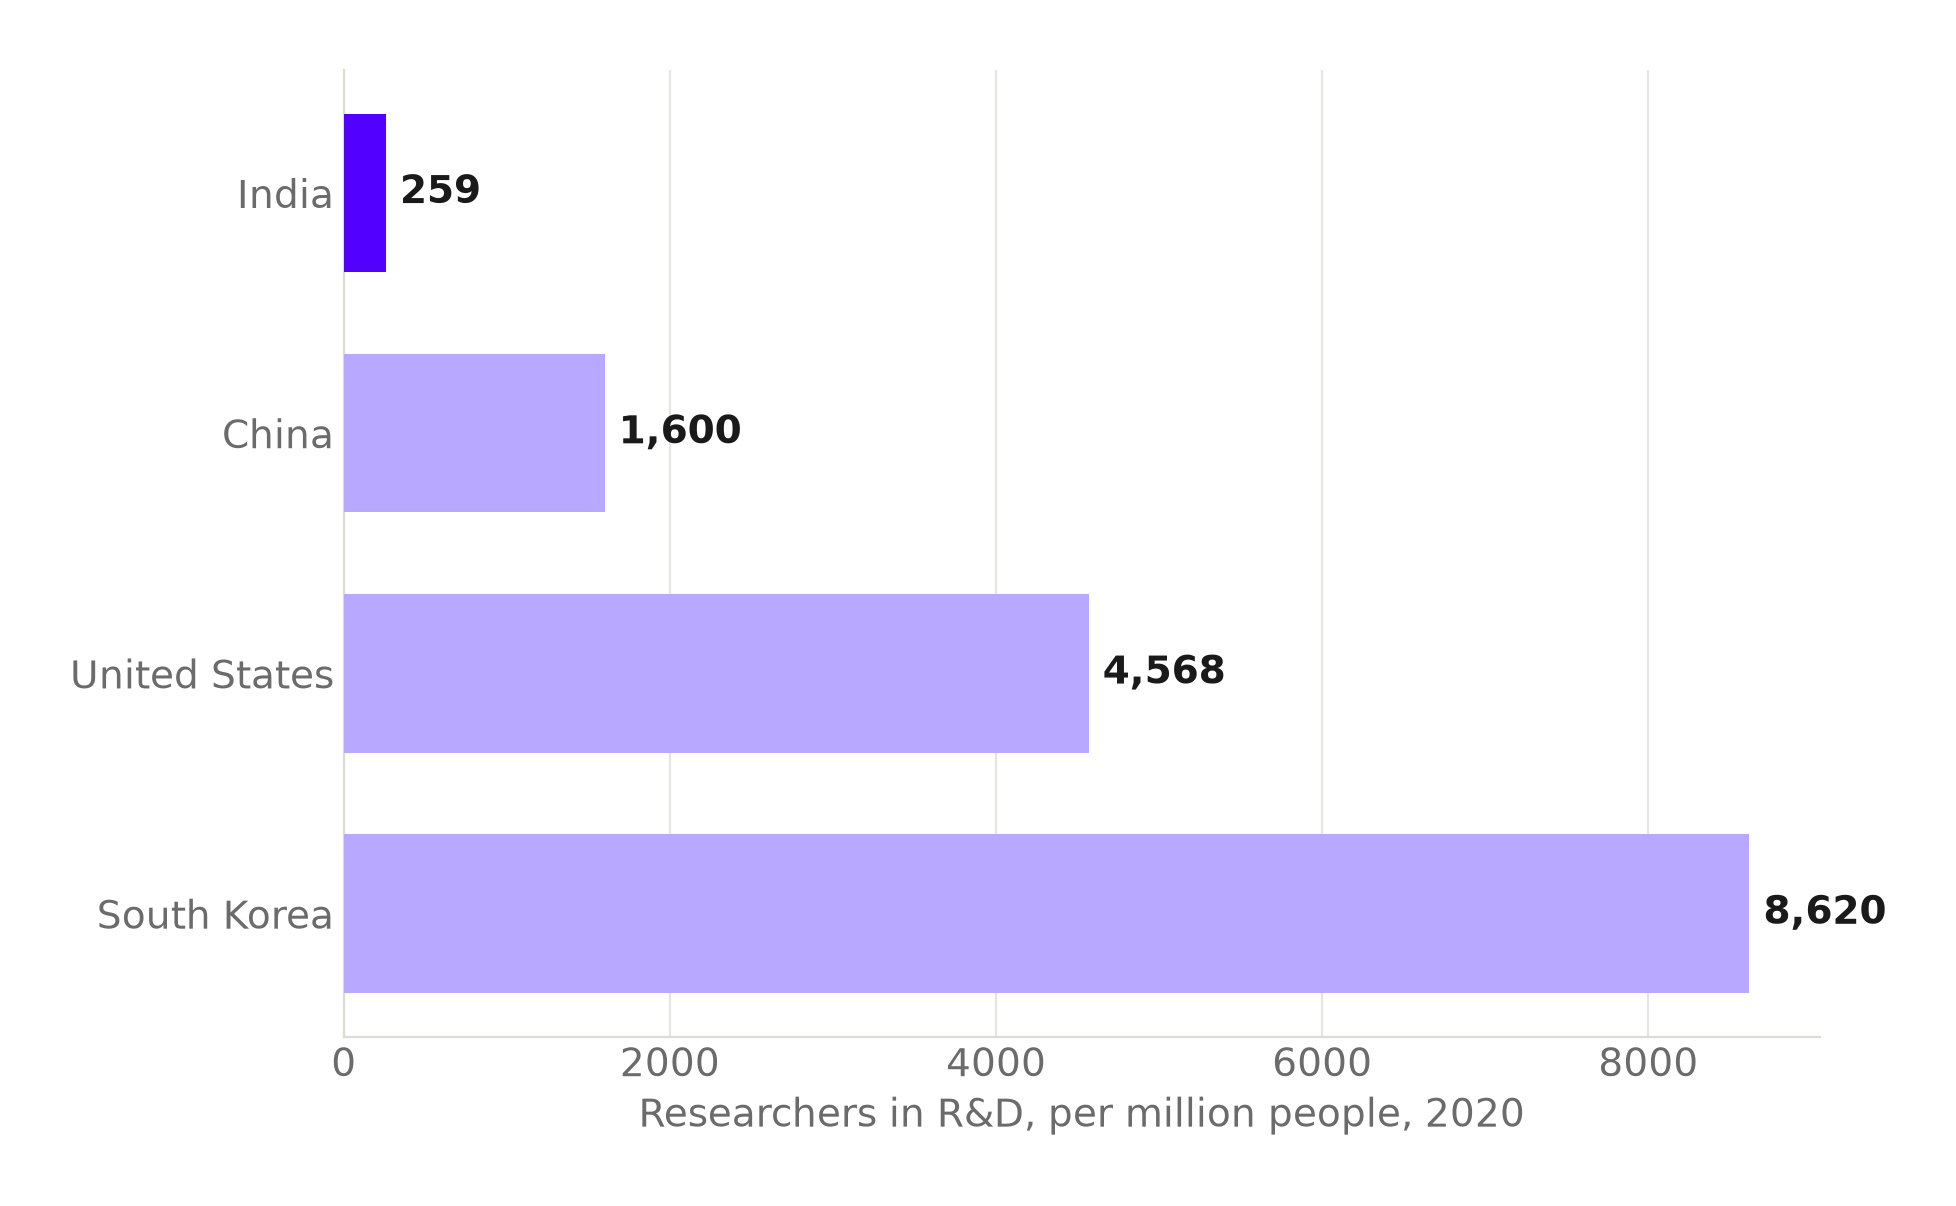
Source: World Bank, World Development Indicators. Chart: The Signal.
Some of that gap is emigration, not a shortage of training. Among Indian science and engineering doctorate recipients on temporary US visas, 86% were still in the United States about five years after graduating, compared with a 73% average across all countries of origin. A 2025 study tracking more than 157,000 internationally mobile Indian researchers' career paths found that over 73% never return to India.
The honest objection
The strongest case against calling this a crisis is that two of the numbers above are moving in the right direction at once. India's Global Innovation Index rank climbed from 81st to 38th in a decade, and the rupee value of GERD more than doubled over roughly the same period. On that reading, India is a developing economy correctly prioritising scale and institutional reform first, with research intensity, private co-investment and basic science share catching up on a longer lag, the way South Korea's own research intensity took decades to reach its current 4.52% of GDP.
That case has real force, but it strains against the emigration numbers. A country climbing an innovation index while its research workforce empties into other countries is not obviously building the base that index is supposed to measure. With just 259 researchers per million people and more than 73% of its internationally mobile researchers never returning, the constraint is not only how much India spends. It is whether the trained people that spending is meant to retain are still in the country to spend it on.
The Signal
The number worth watching next is not the innovation ranking. It is private industry's 36.4% share of GERD, and whether it moves toward the 70%-plus that funds research in the peer economies India measures itself against. A rising ranking built on growing private investment and returning graduates would confirm the current story. If private research funding and researcher retention stay exactly where they are while the ranking keeps climbing, that means India is optimising for the wrong number. Basic science does not show up in a patent count; it surfaces decades later, in discoveries nobody could have specified in advance, and only if the people capable of making them are still around when they arrive.
Reporting basis: India's Gross Expenditure on Research and Development as a share of GDP for 2018-19 through 2020-21, and the private-sector funding comparison with China, South Korea and the United States, are as reported by the Ministry of Science and Technology to Parliament, via Press Information Bureau releases. The rupee-value GERD trend and the 2020-21 breakdown of GERD by funding source are from the Department of Science and Technology's R&D Statistics at a Glance report, which also carries the 2018-19 count of science and technology doctorates, originating with the US National Science Foundation's Science and Engineering Indicators. The 2017-18 breakdown of expenditure by basic research, applied research and experimental development is from DST's Research and Development Statistics 2019-20 report. India's Global Innovation Index ranking is as reported by the Ministry of Science and Technology to Parliament. The international comparisons of research spending as a share of GDP and researchers per million people are World Bank World Development Indicators figures. The stay-rate of Indian science and engineering doctorate recipients in the United States is from the National Center for Science and Engineering Statistics. The finding that over 73% of internationally mobile Indian researchers never return is from a 2025 preprint study of Indian researchers' career trajectories. The 63.6% combined public-sector share of GERD and the researcher-density multiple between South Korea and India are The Signal's calculations from those figures.