The usual way to read India's reserves is as a scoreboard. They hit a record in late August, and in India that gets reported as strength. Then the US Treasury's latest holdings data added a second headline: India's holdings of US Treasury securities rose from $181.3 billion at the end of May 2026 to $219.7 billion at the end of August. A country that talks a lot about settling trade in rupees put $38.4 billion into American government debt in one quarter.
The obvious takes split two ways. One says India is quietly backing the dollar while it talks up de-dollarisation. The other says a bigger reserve pile is simply buying more of everything. Both miss where the money came from.
The dollars were borrowed
On June 8, 2026, the RBI introduced a special USD-INR swap facility covering FCNR(B) deposits, external commercial borrowings and overseas foreign currency borrowings. FCNR(B) accounts are foreign-currency deposits held by non-resident Indians in Indian banks. By August 21, the window had drawn $72.85 billion, of which $65.4 billion was FCNR(B) deposits. When the deposit window shut on August 31, a month earlier than first planned, inflows had passed $136 billion, with $127.2 billion from FCNR(B) deposits.
The structure matters more than the size. Under the swap, a bank sells dollars to the RBI and simultaneously agrees to buy the same amount back at the end of the swap period, on deposits of three to five years, and the swap is done at par. The RBI holds these dollars today and owes them back between 2029 and 2031. They sit in the reserves as assets with a dated liability attached.
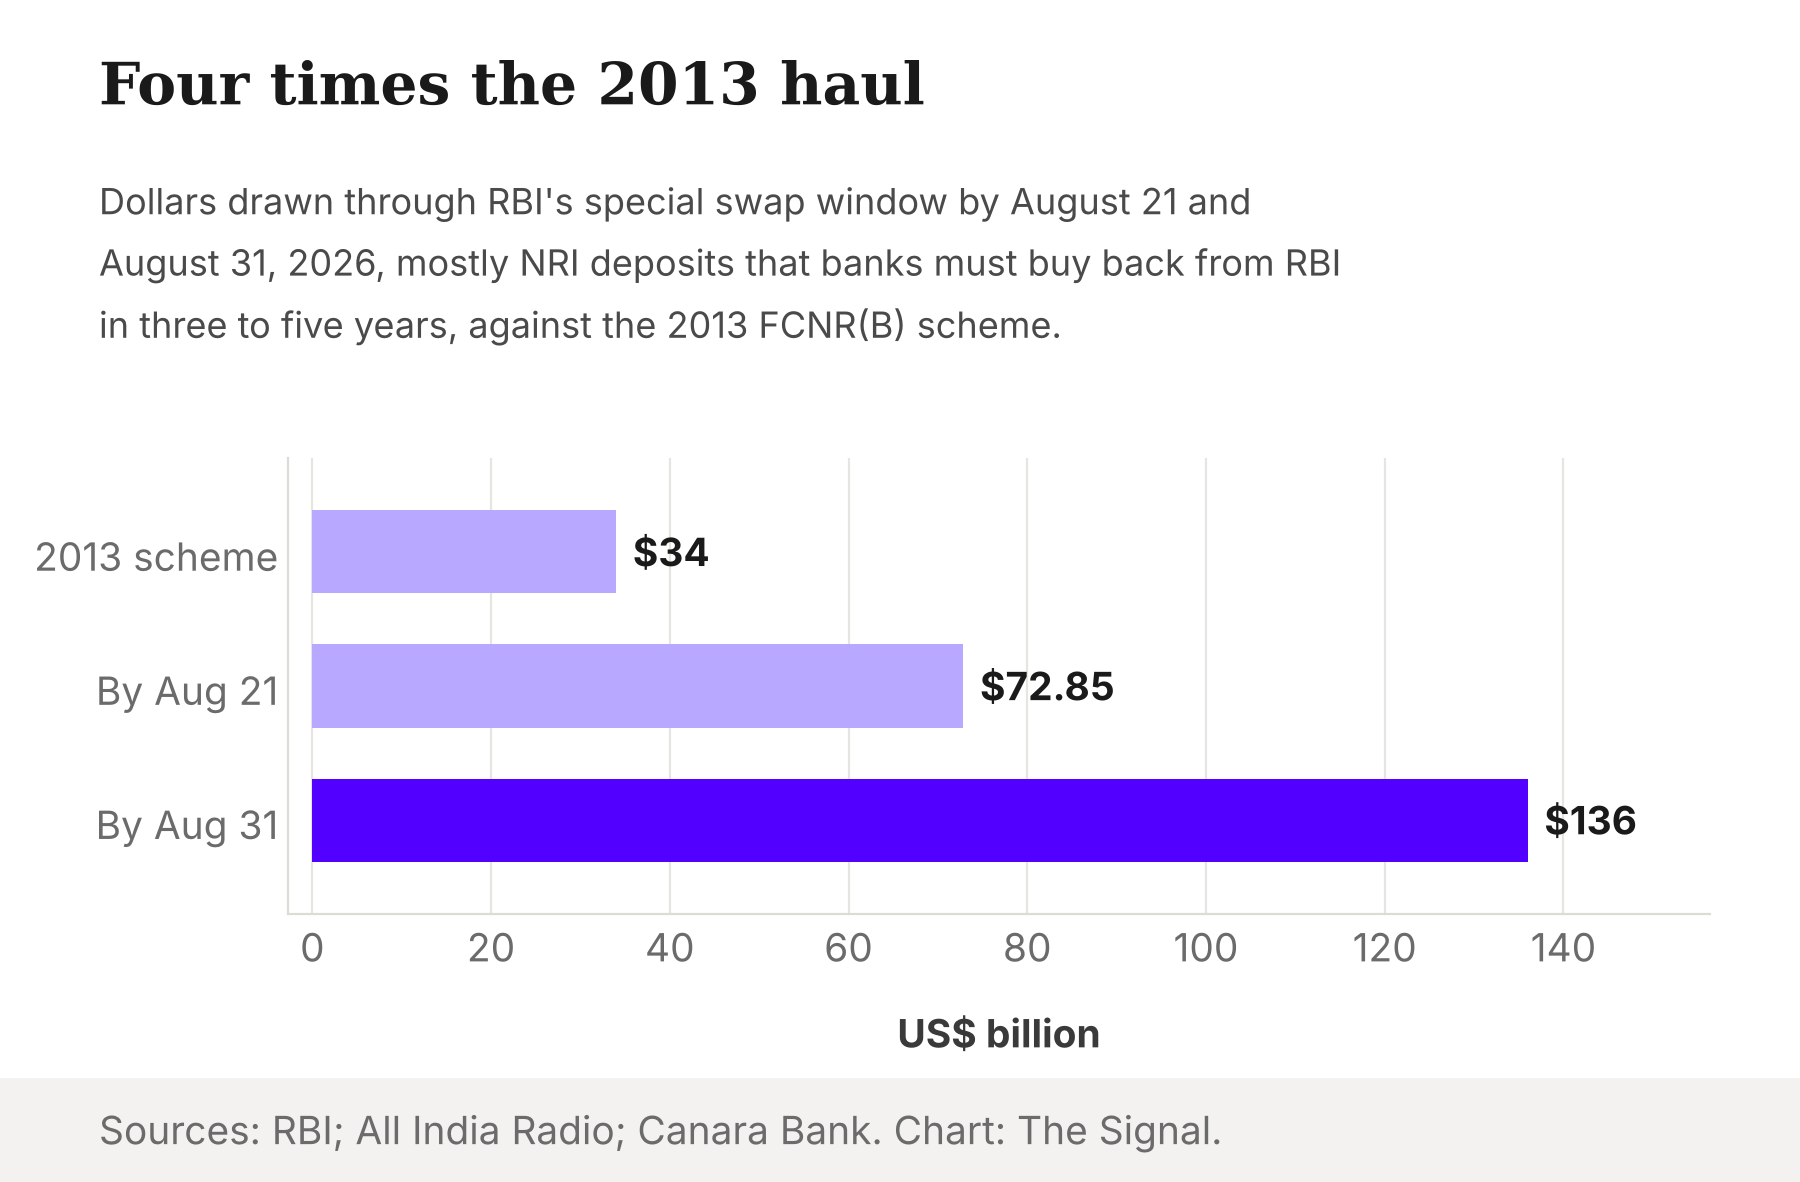
For scale, the 2013 FCNR(B) swap scheme launched after the taper tantrum mobilised nearly $34 billion. The 2026 window raised four times that in under three months.
Where the reserve gain went
The RBI's own weekly data show what the inflow did. Foreign currency assets were $546.1 billion on May 29, 2026. By August 28 they were $600.7 billion, with total reserves at a record $740.8 billion. That is a gain of about $54.5 billion in foreign currency assets.
Set that beside the Treasury data. India's Treasury holdings rose $38.4 billion over almost the same three months. That is roughly seven of every ten new reserve dollars showing up as US government debt.
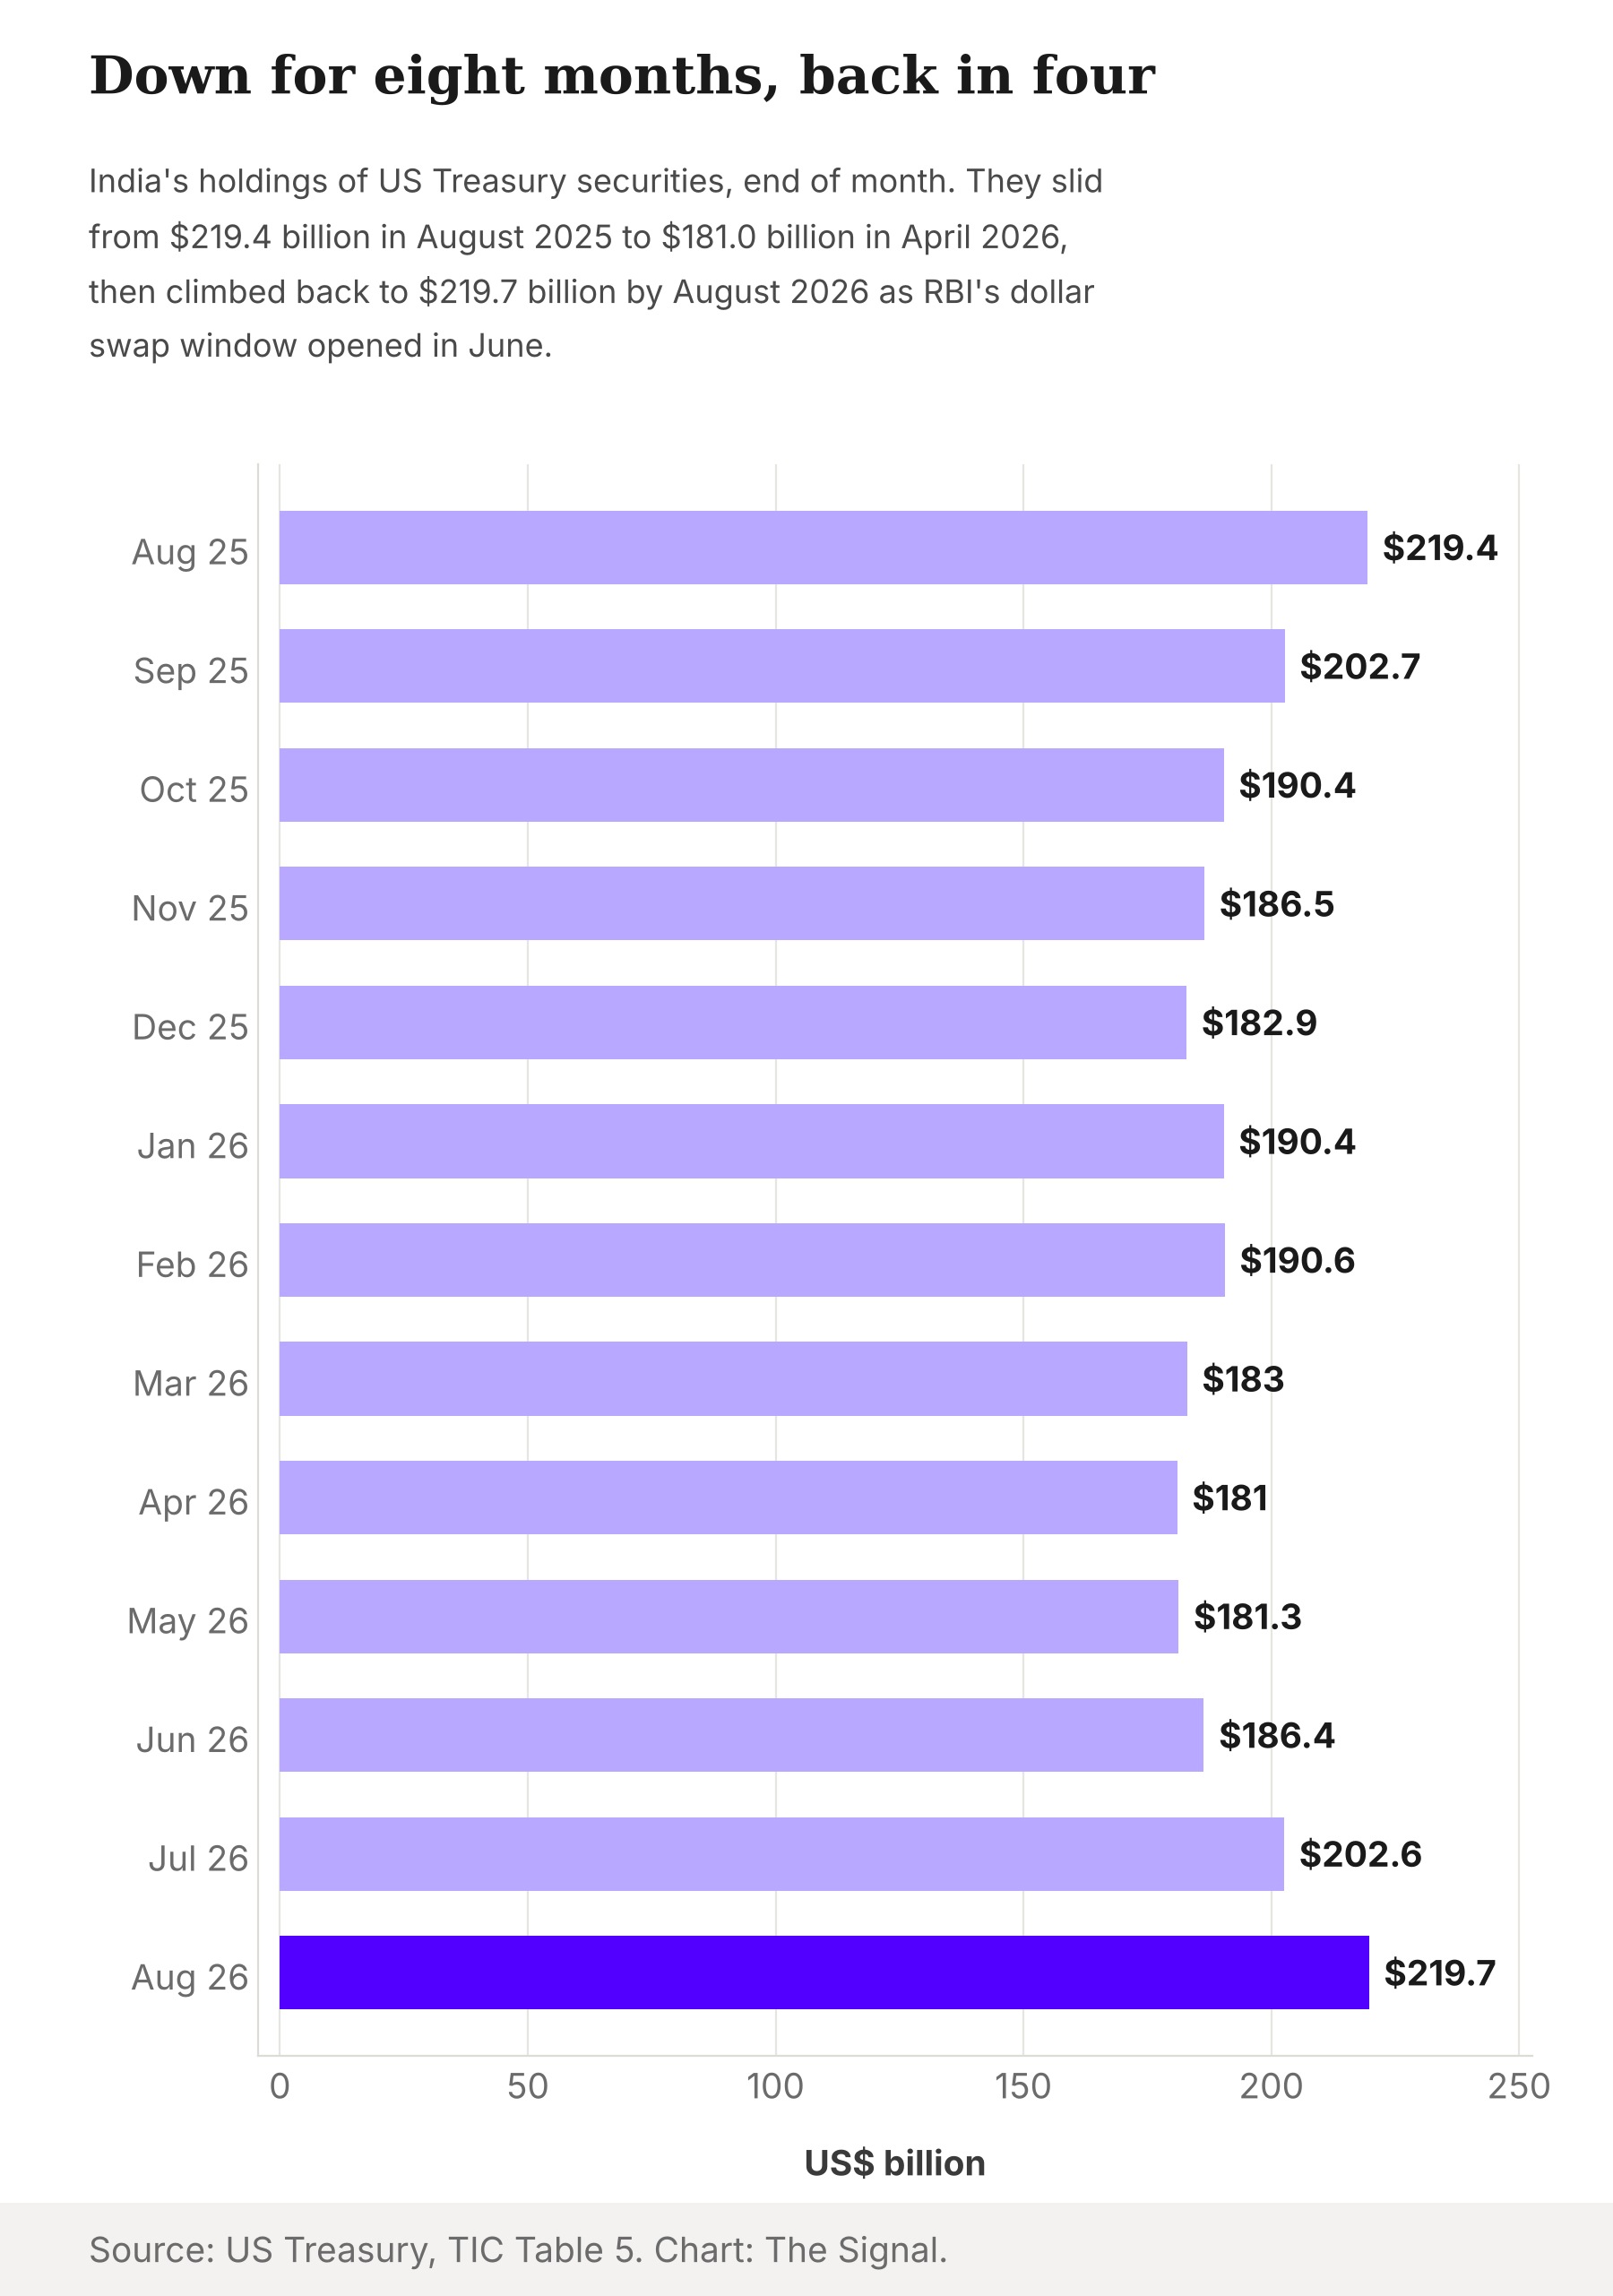
The longer series makes the pattern sharper. India held $219.4 billion of Treasuries in August 2025, fell to $181.0 billion by April 2026, and was back at $219.7 billion in August 2026. The swap window refilled a drawdown almost to the dollar.
The rise was not a price effect either. The 10-year Treasury yield rose from 4.45% on May 29 to 4.75% on August 31, and the 2-year from 3.98% to 4.34%. Rising yields mean falling bond prices, which would shrink the value of existing holdings, not inflate it.
Against the tide
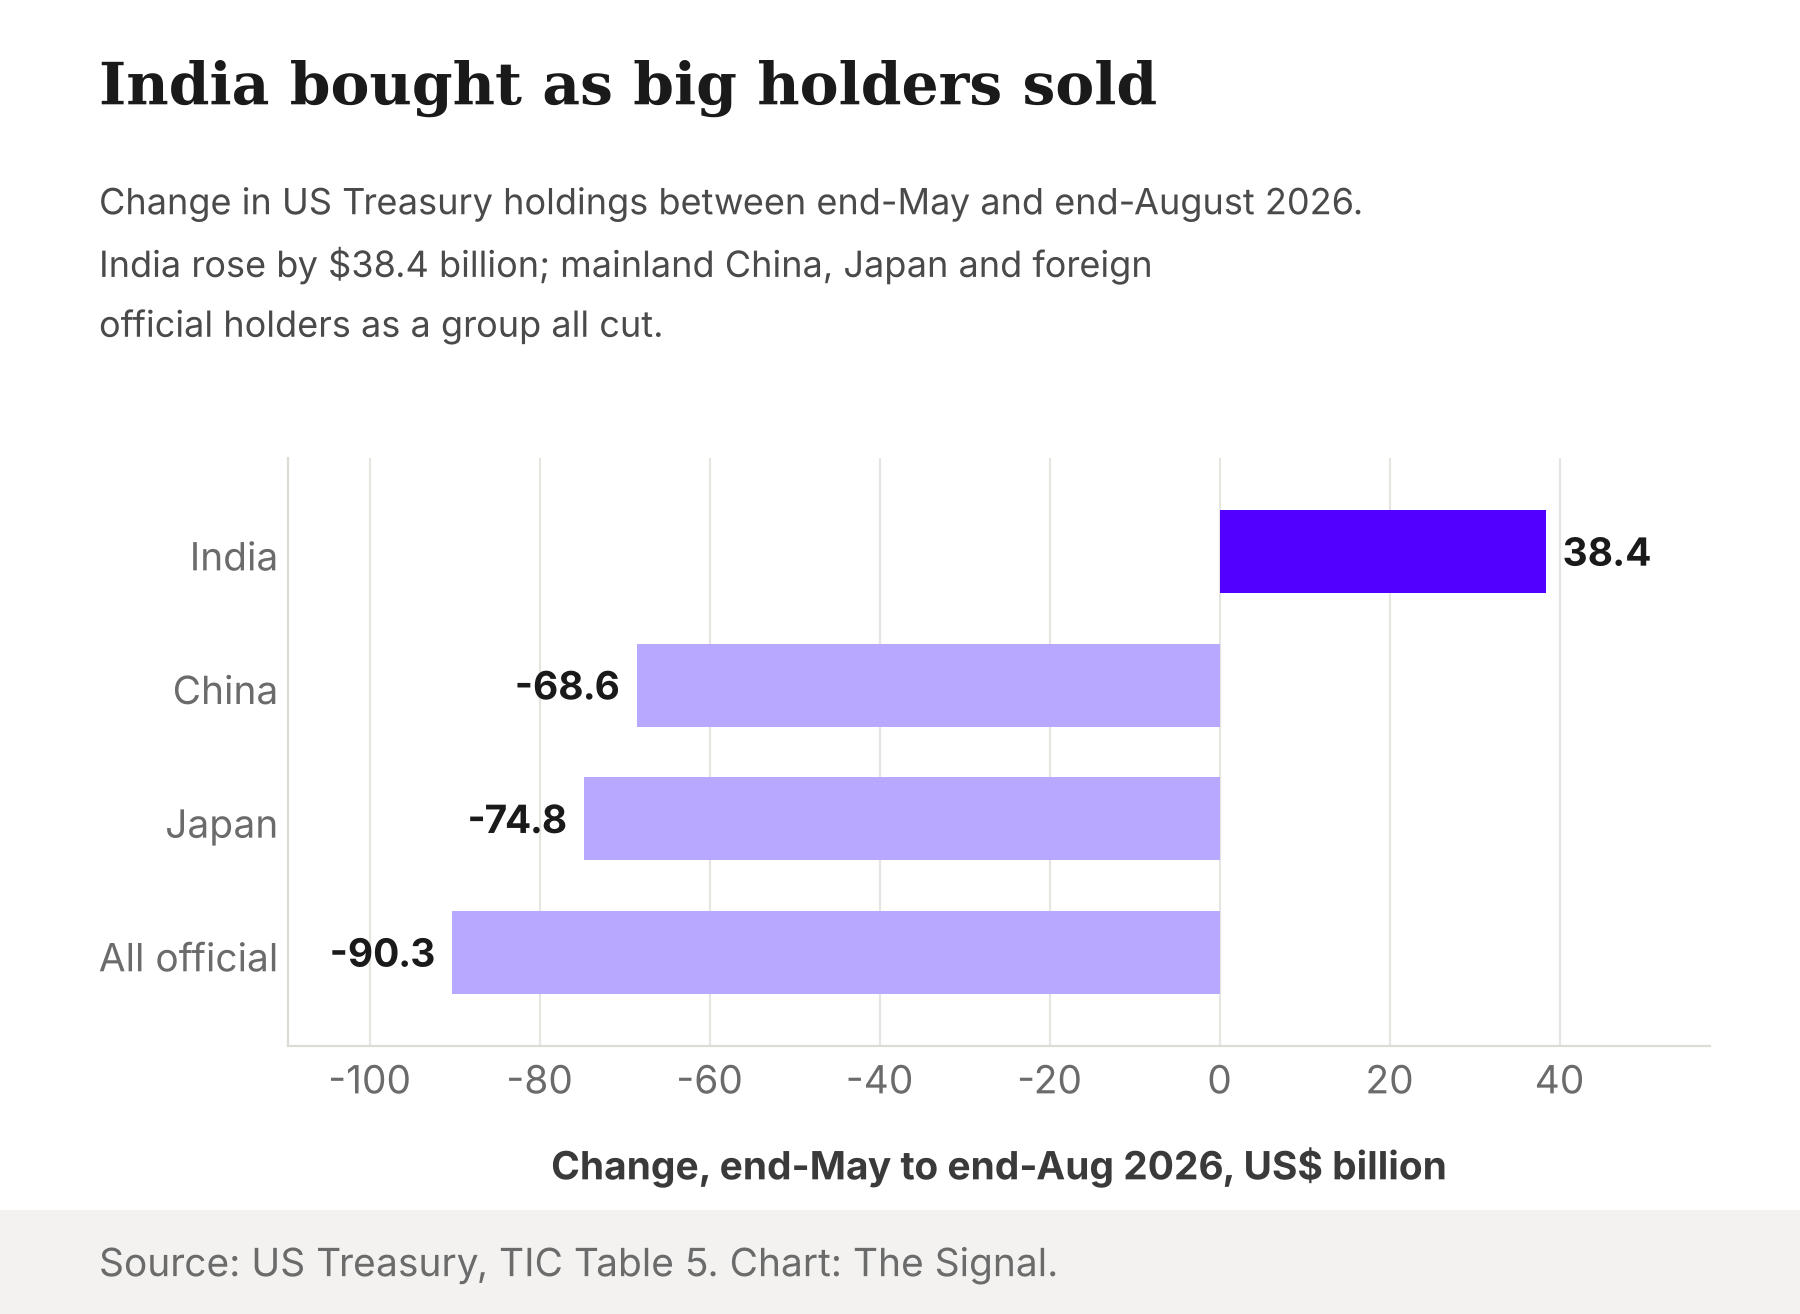
India was moving the other way from the biggest official holders. Between end-May and end-August 2026, mainland China's Treasury holdings fell from $659.3 billion to $590.7 billion, Japan's from $1,143.1 billion to $1,068.3 billion, and total foreign official holdings from $3,845.9 billion to $3,755.6 billion.
The Federal Reserve's custody data point the same way. Marketable Treasuries held at the Fed for foreign official accounts averaged $2,686.6 billion in the week ended May 27, 2026 and $2,601.9 billion in the week ended August 26. Central banks as a group were trimming.
The global composition data tell a slow version of the same story. The dollar's share of world foreign exchange reserves slipped to 56.70 percent in the second quarter of 2026 from 57.18 percent in the first.
| Holder | End-May 2026 | End-Aug 2026 | Change |
|---|---|---|---|
| India | $181.3 bn | $219.7 bn | +$38.4 bn |
| China (mainland) | $659.3 bn | $590.7 bn | -$68.6 bn |
| Japan | $1,143.1 bn | $1,068.3 bn | -$74.8 bn |
| All foreign official | $3,845.9 bn | $3,755.6 bn | -$90.3 bn |
Source: US Treasury, TIC Table 5.
Why buying Treasuries fits a borrowed dollar
Read the purchase as a bet on America and it looks contrarian. Read it as liability matching and it looks ordinary. The RBI took in dollars it must hand back to banks on known dates three to five years out. The asset that best matches a dated dollar debt is a liquid dollar bond that can be sold or held to maturity on that horizon. Gold cannot do that cleanly, and neither can euro or yen assets without adding currency risk to a dollar obligation.
The design is not new. In 2013 too, the RBI's swap was a simple buy/sell foreign exchange swap covering the principal of the deposits. What changed is scale. The 2013 window was a patch. The 2026 window is large enough to show up in the US Treasury's country tables.
The honest objection
The strongest objection is that dollars are fungible and the data are noisy. Reserves are one pool, so nobody can tag a particular FCNR dollar to a particular Treasury bill. The TIC figures are compiled from US custodians, and the Treasury itself warns that securities held in overseas custody may not be attributed to their actual owners. The India line also covers private Indian holders, not just the RBI. On this view, the timing could be coincidence and the reading of intent is a stretch.
All of that is fair, and it rules out any claim that the RBI bought Treasuries with NRI money in an accounting sense. It does not touch the balance-sheet point. Over the same three months, foreign currency assets rose about $54.5 billion, a swap window brought in far more than that, and the country line for Treasuries rose $38.4 billion against falling prices while the large official holders sold. Whatever the custody noise, India's reserve gain since June is largely borrowed and largely held in the dollar's most liquid form. The fungibility argument changes the label on the money, not the obligation behind it.
The Signal
India's record reserves are a stronger buffer than they were in May, but a smaller net one than the headline suggests. A large part of the August gain arrived with a promise to sell the dollars back, and roughly seven of every ten new reserve dollars sit in US government debt while China and Japan sold. That is prudent asset matching, not a political vote for the dollar. The bill comes later. Between 2029 and 2031 the swaps fall due, and the dollars go back to the banks. Watch the TIC country line for India and the RBI's forward dollar commitments over the next two years: if Treasuries hold steady while the forward liabilities stay large, the buffer is being kept for the repayment, not spent on the rupee. A record built on borrowed dollars still has to be repaid in dollars.
Reporting basis: India's, China's, Japan's and total foreign official Treasury holdings come from the US Treasury's TIC Table 5, and Treasury yields from the US Treasury's daily par yield curve; both are one origin, the US Treasury. Foreign official custody holdings are from the Federal Reserve's H.4.1 release. Reserve levels on May 29 and August 28, 2026 are from the RBI's Weekly Statistical Supplement, and the swap inflows to August 21 are from an RBI press release; the August 31 total is RBI data as reported by All India Radio, so it is the same RBI origin, relayed. The swap's tenor and at-par terms are per Business Today's explainer of the RBI scheme, and that single report is the sole source for those 2026 terms; the 2013 swap structure is from the RBI's 2013 FAQ. The 2013 scheme's total is per a Canara Bank research note, and the global dollar reserve share is from the IMF's COFER data. The foreign currency asset gain, the seven-in-ten share, the comparison with the 2013 scheme, the changes by holder and the repayment window are The Signal's calculations from those figures.