
From FY21 to FY25, individual investors were net buyers in the NSE cash market every year. Then the streak broke. In FY26, individual investors were net sellers of Rs 5,803 crore in the NSE cash market, according to the exchange's own September 2026 Market Pulse. The easy read is that small investors lost their nerve and left equities.
The same table says otherwise. In the same year, individuals put Rs 42,608 crore into IPO applications of up to Rs 2 lakh, for combined net flows of Rs 36,805 crore. The money did not leave. It changed doors.
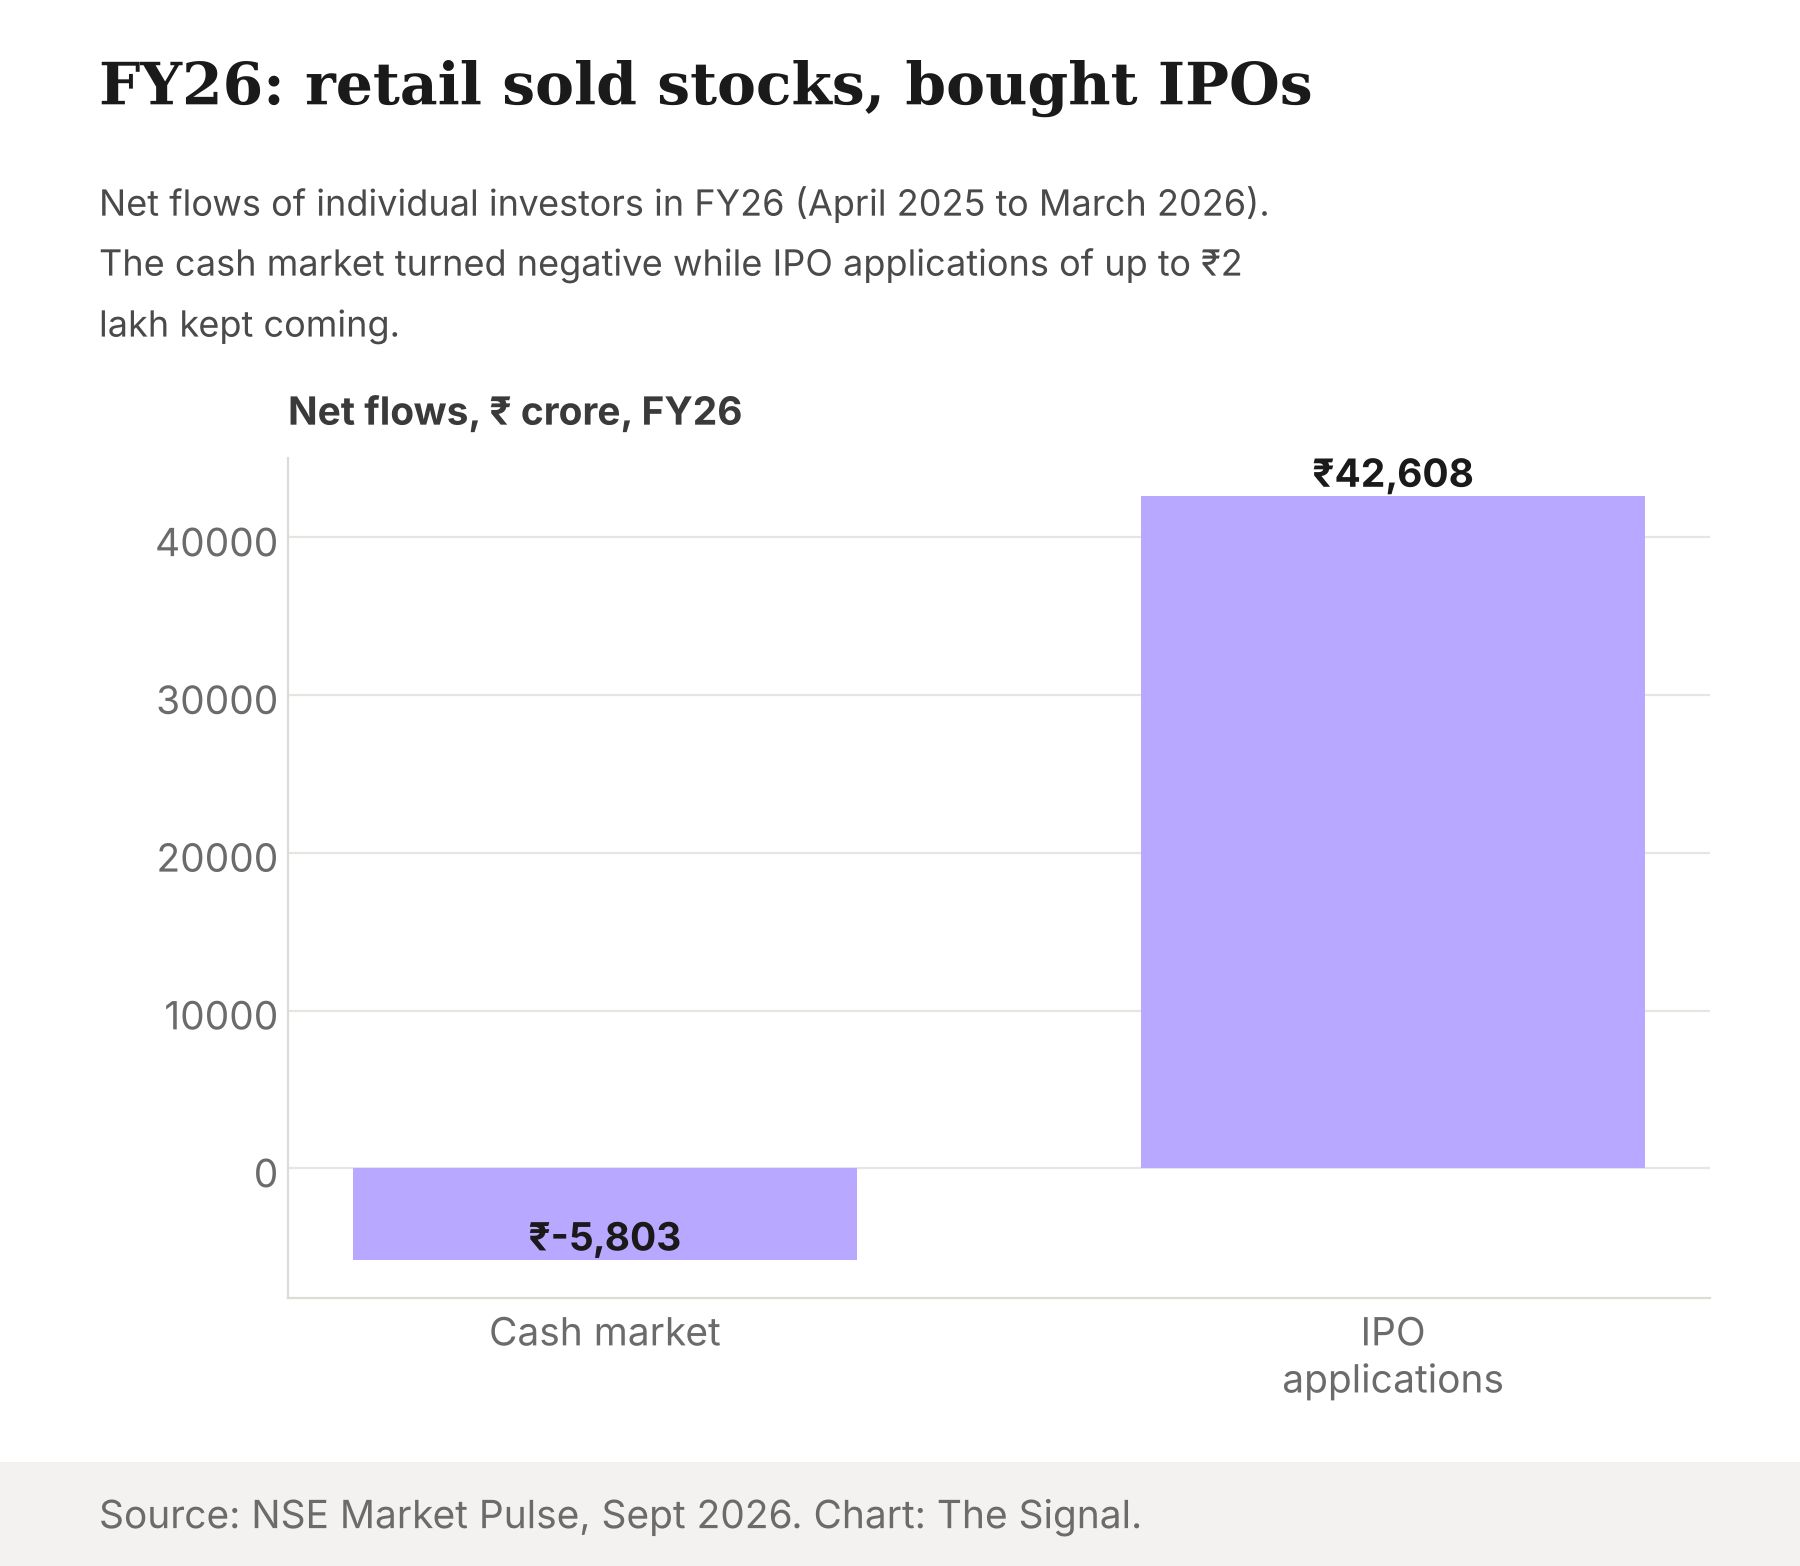
The new money all came through the IPO door
Put the two flows side by side. The IPO figure was larger than the total: Rs 42,608 crore against net flows of Rs 36,805 crore, or about 116 percent. Every rupee of net retail inflow in FY26, and then some, went through the primary market.
A year earlier the mix was reversed. In FY25, individuals put Rs 1,25,127 crore net into the cash market and Rs 34,336 crore into the primary market, so IPOs were about 22 percent of the Rs 1,59,463 crore total. Retail investment through 28 February 2026 was Rs 33,537 crore against Rs 1.59 lakh crore in FY25, the Tribune reported from NSE data, which is the same fall seen from a different date.
The sharper number is the swing. The cash market went from Rs 1,25,127 crore of net buying in FY25 to Rs 5,803 crore of net selling in FY26, a turn of Rs 1,30,930 crore. IPO money did not fall to fill the gap. It rose from Rs 34,336 crore to Rs 42,608 crore, an increase of Rs 8,272 crore, about 24 percent. Retail investors pulled back from trading listed stocks by far more than a cautious mood would explain, and kept applying for new issues.
What an IPO offers that the cash market did not
NSE's tables show the flows, not the motive, so this part is inference. An IPO application of up to Rs 2 lakh is a different bet from buying a listed stock. The buyer takes an allotment at a fixed price, with no choice of entry point. The cash market asks the buyer to name a price every day.
The listing record is consistent with the appeal. In August 2026, 18 Main Board IPOs raised Rs 28,976 crore, and all 18 debuted above their issue price. None of the companies that listed in the preceding six months had gained more than 50 percent on listing. About 17 percent of August's did. A cohort of IPOs that mostly opens above the issue price rewards the investor who applied, whatever the secondary market is doing.
The honest objection
The strongest case against a "rotation" story is that it already reversed. In FY27 to 31 August 2026, individuals were net buyers of Rs 37,070 crore in the cash market and Rs 13,925 crore in IPOs, Rs 50,995 crore in all. That is more than six times the FY26 cash-market outflow, in five months. The IPO share of net flows fell to about 27 percent. On this view retail did not abandon stocks. It sat out a weak stretch, took what new issues offered, and came back.
That is a fair reading, and the data cannot rule it out. It still leaves a pattern worth watching: individual money moves between the primary and secondary markets in large swings. In calendar 2026 to 31 August, individuals were net buyers of Rs 48,898 crore on NSE, while domestic institutions bought Rs 5,63,505 crore and foreign portfolio investors sold Rs 2,24,442 crore. Domestic institutions bought more than 11 times as much as individuals.
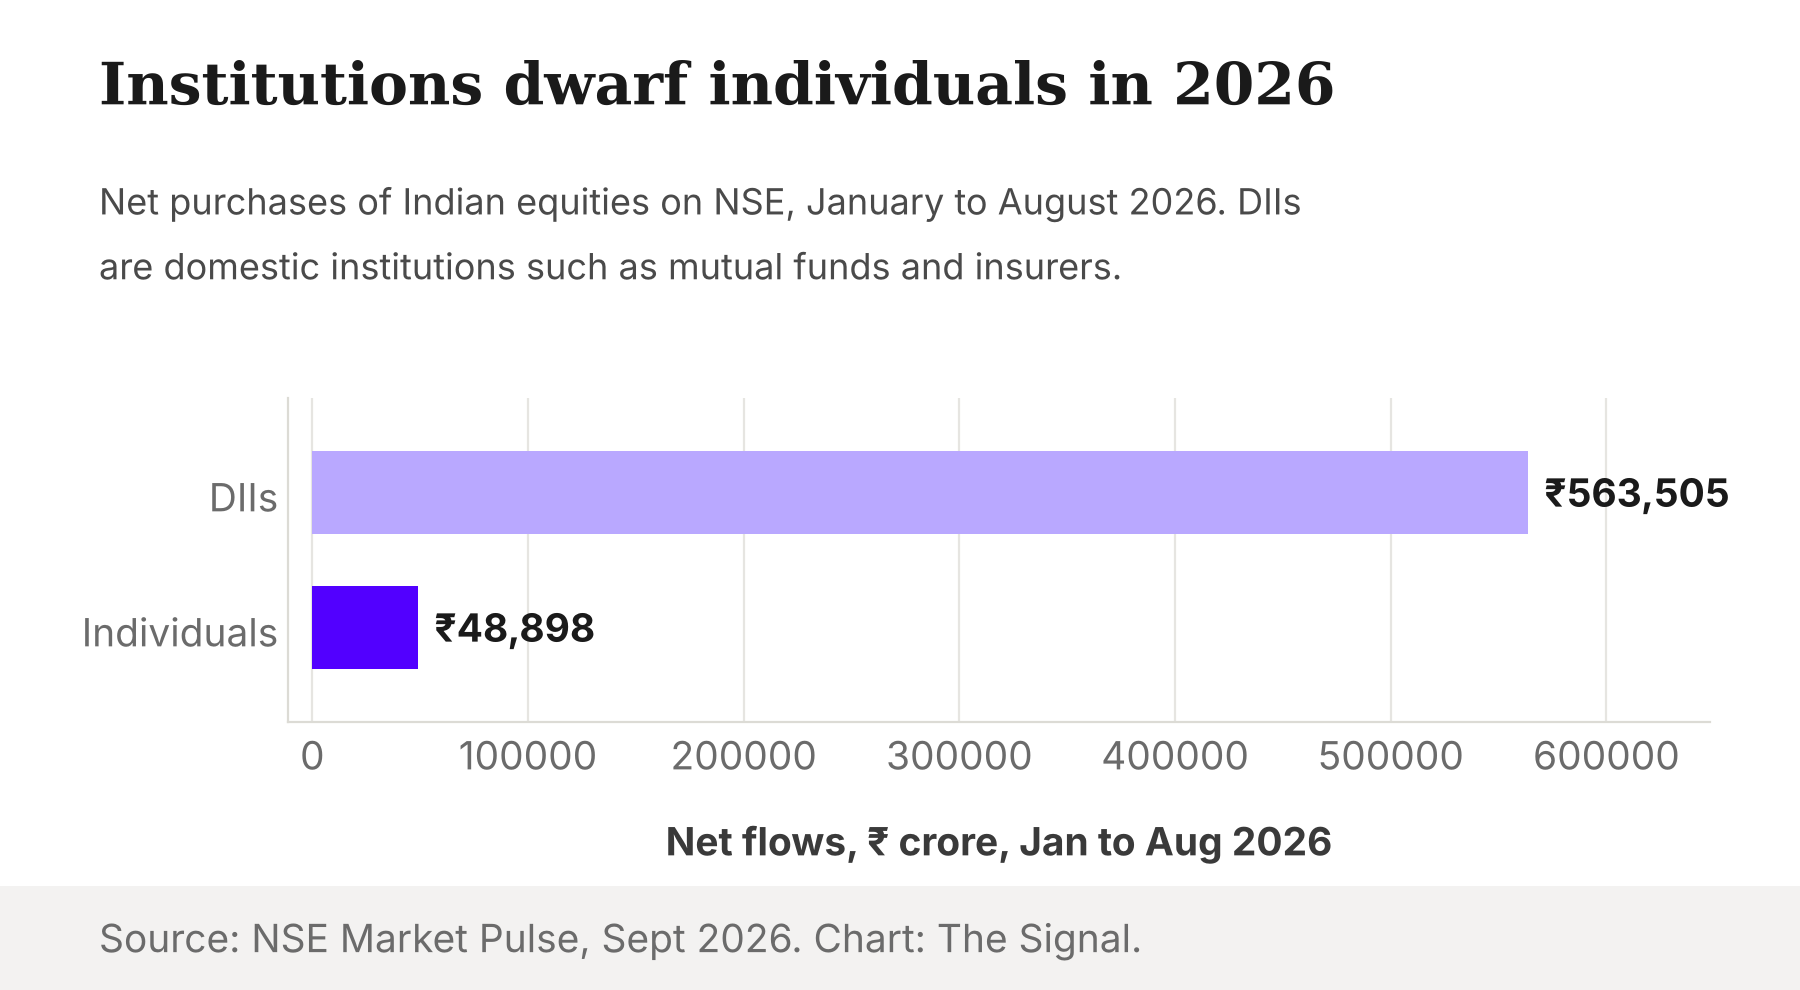
There are two more limits. The IPO figures count only applications of up to Rs 2 lakh, and the cash-market figures are secondary-market net flows on NSE alone. And individual activity is concentrated: the top 0.2 percent of cash-market investors accounted for 78.1 percent of turnover. A small group can move the net number, so "retail" is not a single mood.
The Signal
In FY26 the primary market took the small investor's net cash and the cash market did not. The reversal in FY27 shows this is a cycle in how households route money, not a permanent exit from stocks. What matters is which door looks more rewarding at the moment. August's listings, all above issue price, made the IPO door look good, and the six months before it, when none gained more than 50 percent, made it look ordinary.
The number to watch is the primary share of retail net flows. On NSE's FY25, FY26 and FY27 to date figures it was about 22 percent, about 116 percent and about 27 percent. The next NSE Market Pulse will show whether it keeps falling.
Reporting basis: every retail-flow, IPO, listing-gain and turnover figure comes from one origin, NSE's own Market Pulse of September 2026, the exchange's compilation of its trading and allotment records with data to 31 August 2026. The piece therefore rests on a single origin and cannot be cross-checked here against SEBI or depository data. The FY26 retail figure to 28 February 2026 is per The Tribune, reporting NSE data via ANI. NSE's primary-market series counts individual applications of up to Rs 2 lakh only. The shares of net flows, the swing in cash-market flows, the rise in IPO money and the institution-to-individual multiple are The Signal's calculations from those figures.