The oil price gets the headlines. This autumn the price of moving the oil has been the bigger story. Chartering a supertanker to carry two million barrels from the US Gulf of Mexico to China for November loading hit $80 million in the week of 9 October 2026, according to shipbroker data on LSEG reported by Reuters. Divide $80 million by two million barrels and the freight alone is $40 a barrel. The same Reuters report puts the figure at $8.60 a barrel before the US-Israeli war on Iran began in February.
The obvious read for an Indian reader is that a record freight bill must be landing on India. It is worth slowing down on that, because the direct channel is narrower than it looks.
Freight per barrel rose from $8.60 to $40, Reuters reports, a multiple of about 4.7.

The freight shock is the oil shock, in a second place
The US Energy Information Administration (EIA) says high tanker rates, which reached record levels in September, reflect increasing insurance costs and are putting additional upward pressure on delivered crude oil prices to refiners. In the same October 2026 outlook, it reports that Brent averaged $114 a barrel in September, $23 higher than in August.
Set the two side by side: $40 of freight against a $114 crude price is about 35 percent. That compares one voyage on one route with a monthly average, so treat the 35 percent as a sense of scale, not a precise cost share.
What the US export data show, and what they cannot
The EIA's monthly series shows American crude leaving the country in smaller volumes through the summer. Total US crude exports ran at 5,593 thousand barrels a day in April 2026, 5,728 in May, 4,735 in June and 3,556 in July. From May to July that is a fall of 38 percent.
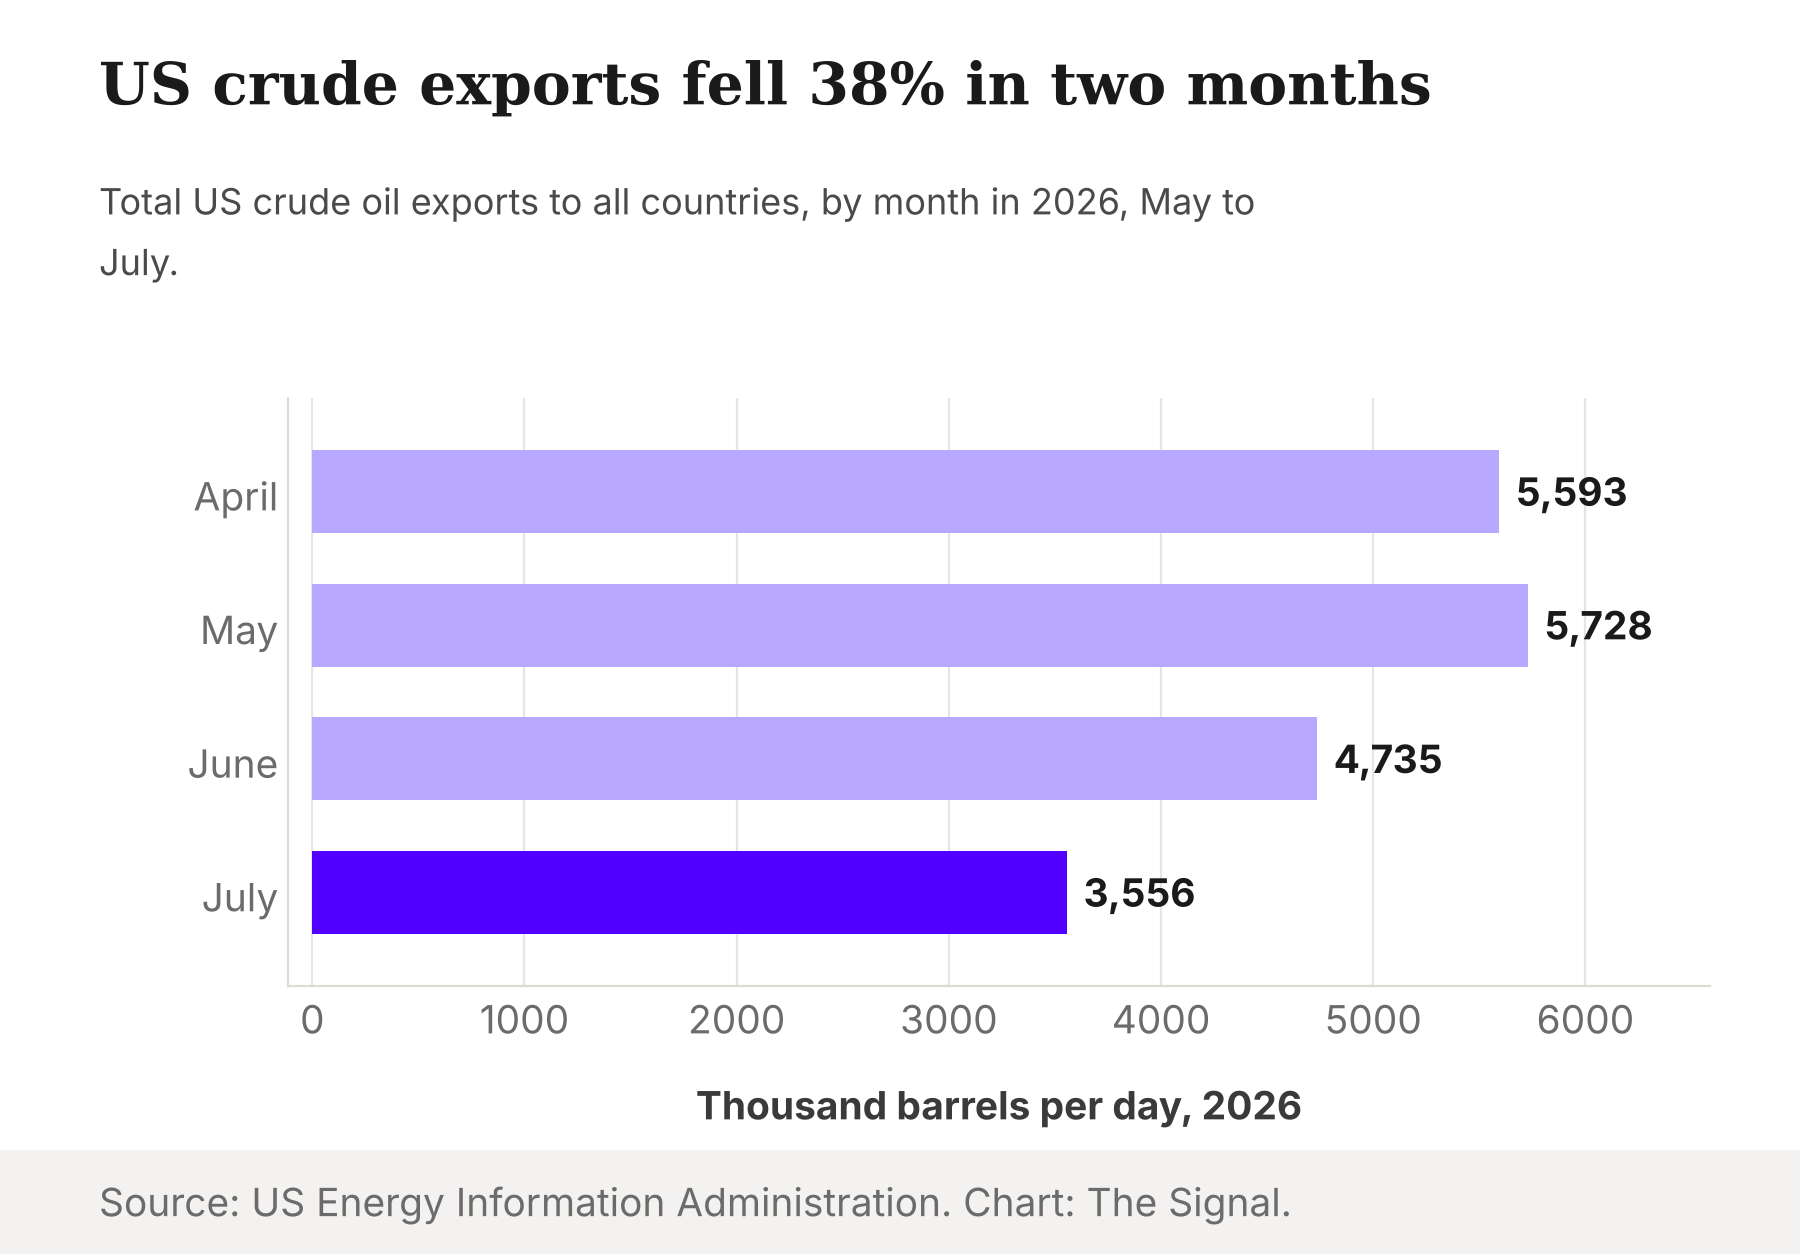
The story needs restraint here. July is the newest month in the EIA series, and the record freight readings came later, in September and October. The July drop cannot be pinned on the record tanker rates. The data show volume falling before the freight peak. They do not show why.
Where India actually sits
India is a small buyer of American crude. US crude exports to India were 177 thousand barrels a day in January 2026, 184 in March, 126 in April and 85 in July. From April to July that is a fall of about a third.
A different data source gives a recent snapshot. Kpler ship-tracking data, as reported by ThePrint, put India's September 2026 crude imports at about 5.3 million barrels a day, with US supply near 141,000 and Russia near 1.74 million. On those figures the US supplied about 2.7 percent of India's crude that month, and Russia supplied about 33 percent, roughly twelve times as much.
The two sources measure different things, so their numbers should not be spliced into one trend. The EIA counts American exports, and Kpler tracks cargoes arriving in India. What they agree on is the scale: a few percent of India's crude, not a pillar of it.
That is the reversal: a freight spike that is reshaping the US-to-Asia trade hits a market where India has little stake. The $40 US-to-China freight charge is not one Indian refiners pay on any large volume.
The honest objection
The strongest counter is that India is not insulated at all. Every barrel it imports travels by tanker, and the EIA's finding that high tanker rates push up delivered crude prices is not limited to American cargoes. On that view, 2.7 percent is a misleading figure, because the exposure is to the price of oil that arrives, not to the share from any one country.
That case is largely right, and it is the more important one. It moves the thesis rather than refuting it: India is exposed through the price of the oil that arrives, not through the US-Asia trade that makes the headlines. The sources here include no freight rates for India's own routes, so we cannot say how large that cost is.
The Signal
The headline number is $40 a barrel for a voyage most Indian refiners do not book. For India, the bigger number is Brent at $114 in September, and the insurance and routing costs behind it. Watch whether US supply to India rises from its July low of 85 thousand barrels a day. A cargo is only cheap if it can get to you.
Reporting basis: the $80 million charter cost and the $40 and $8.60 per-barrel figures are from Reuters, reporting shipbroker data on LSEG, as carried by Baird Maritime, and rest on that single reporting chain. The tanker-rate statement and the Brent figures are from the EIA's October 2026 Short-Term Energy Outlook. US export volumes, in total and to India, are from the EIA's monthly petroleum data, which run to July 2026. India's September import volumes and supplier split are from Kpler, as reported by ThePrint, and rest on that one secondary source. The per-barrel multiple, the freight-to-Brent share, the 38 percent fall in exports, the one-third fall in exports to India, the 2.7 percent and 33 percent supplier shares and the twelvefold ratio are The Signal's calculations from those figures.