On 7 October the Reserve Bank of India raised the policy repo rate by 25 basis points to 5.50 per cent, with the Monetary Policy Committee voting unanimously for the increase. The conventional reading is simple: banks reprice floating-rate loans quickly on the way up, so borrowers feel it fast. Hikes are passed on promptly, the usual complaint runs, and cuts take their time.
It is worth slowing down on that. The RBI's own numbers from the last tightening show there is no single "borrower" in that sentence. There are two, and the gap between them is large.
Two borrowers, two speeds
Over May 2022 to April 2024, the repo rate rose 250 basis points, and the RBI reports that the weighted average lending rate on fresh rupee loans rose 204 bps while that on outstanding loans rose 111 bps. A basis point is one hundredth of a percentage point.
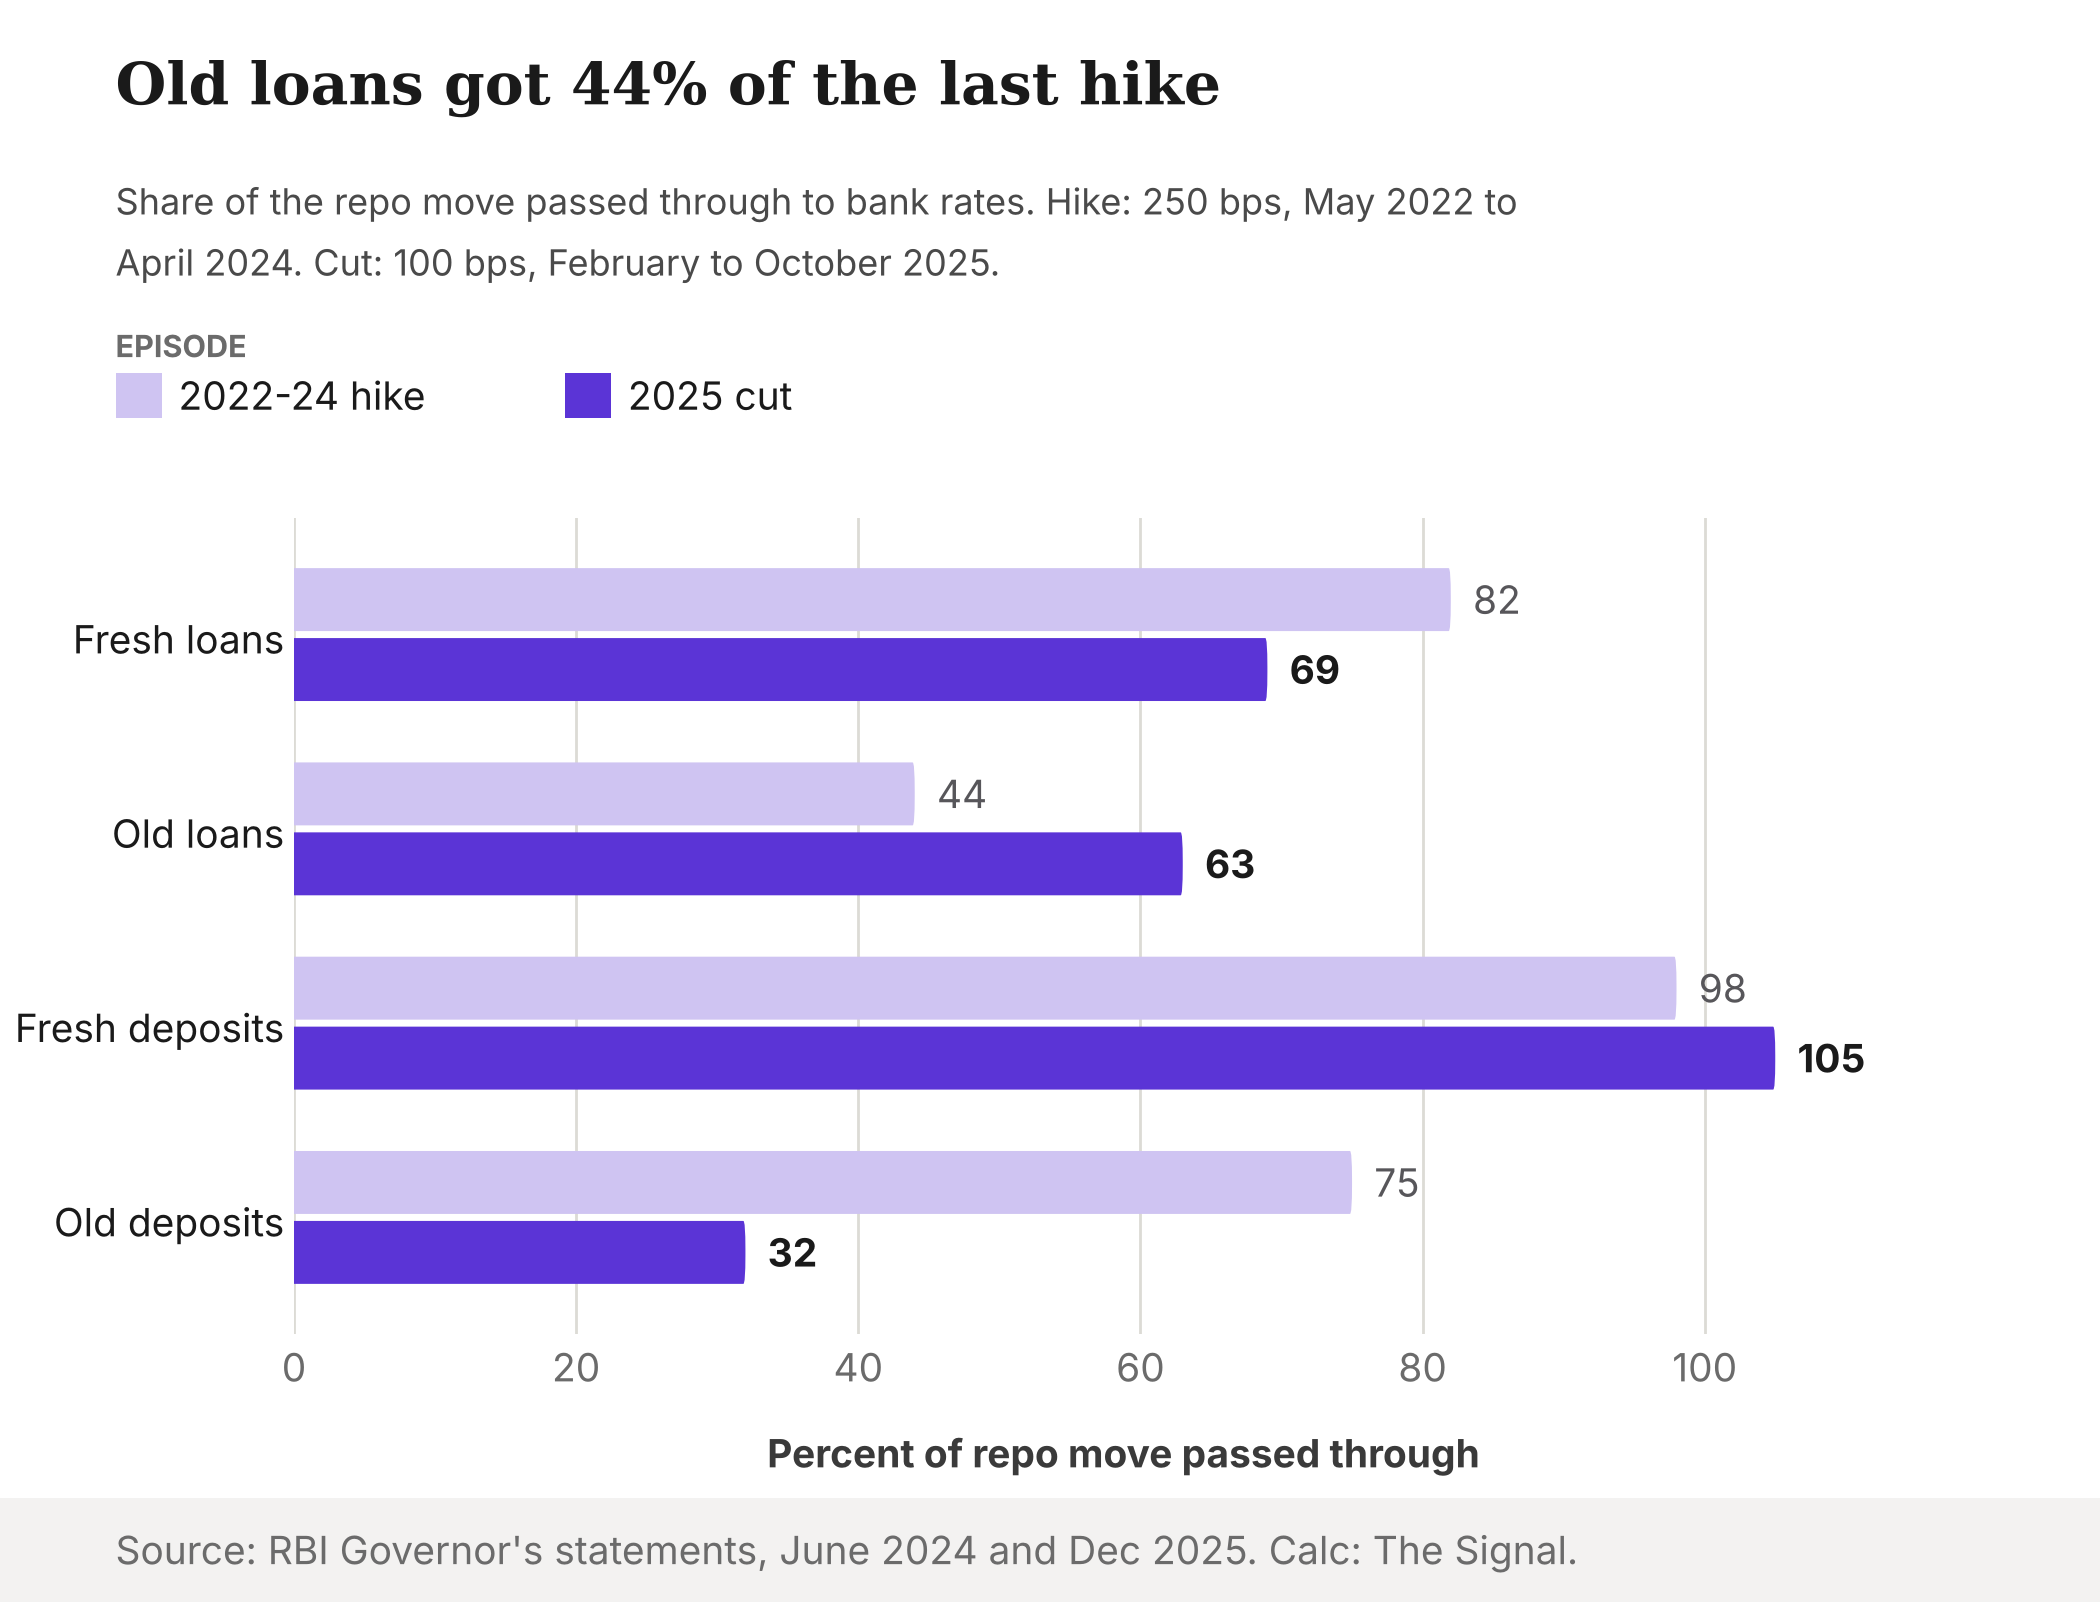
Put those against the 250 bps move: 204 is about 82 per cent and 111 is about 44 per cent. A new borrower saw about 82 per cent of the hike in the rate they were offered, and an existing borrower about 44 per cent, even two years on (RBI). Nearly twice as much of the hike reached the person signing a loan today than the person already paying one.
Fresh loans repriced almost in step with the hike. Existing loans had passed on less than half of it two years later (RBI).
The RBI data do not say why in these passages. The usual explanation is that older loans sit on benchmarks that reset slowly, while new loans are priced off today's rates. Whatever the mix, the practical consequence is concrete: how much of the 7 October hike lands on a household depends heavily on whether the loan is new or old.
The cut tells a different story
The folk wisdom says cuts are slower. The RBI's data on the last easing cycle do not support it for existing borrowers. After a cumulative 100 bps repo cut during February to October 2025, the RBI reports the lending rate on fresh rupee loans fell 69 bps, and the lending rate on outstanding loans fell 63 bps.
That is 69 per cent of the cut for new loans and 63 per cent for existing ones (RBI). The old-loan figure is far above the 44 per cent seen in the hike. A caution applies: the hike is measured over 24 months and the cut over about nine. So this is a comparison of two episodes, not a law. But on this evidence, "banks pass on hikes faster than cuts" is true for new loans only (82 against 69), and reversed for old ones.
The real lag is on the deposit side
The sharper asymmetry sits on the other side of the bank's balance sheet. In the same 2022 to 2024 hike, the RBI reports term deposit rates rose 245 bps on fresh deposits and 188 bps on outstanding deposits. That is 98 per cent and 75 per cent of the hike.
When rates fell, the picture split. Over the 2025 cut, the RBI reports fresh deposit rates fell 105 bps and outstanding deposit rates only 32 bps. New deposits repriced by 105 per cent of the cut. Old deposits repriced by 32 per cent.
Read the two sides together for existing customers. In the hike, outstanding deposit rates rose 77 bps more than outstanding loan rates (188 against 111, per the June 2024 statement). In the cut, outstanding loan rates fell 31 bps more than outstanding deposit rates (63 against 32, per the December 2025 statement). In both episodes the gap between what banks charged on old loans and paid on old term deposits narrowed. That is a gap between two averages, not a margin: banks also earn on current accounts and savings, which the data above do not cover. But it shows who bore the transmission lag. Depositors in the cut were slower to lose, and in the hike banks paid up on their old deposits faster than they collected on their old loans.
Where banks start this hike
Banks enter this hike in an unusual position. In July and August 2026, the lending rate on fresh loans hardened by 8 bps while that on outstanding loans was unchanged, and fresh deposit rates fell 28 bps, driven by lower bulk deposit rates after a surge in liquidity from foreign-currency deposit inflows. The fresh-loan rate stood at 8.61 per cent in August 2026, and the fresh term deposit rate was 5.67 per cent. That is a gap of 2.94 percentage points.
Banks start this hike with a wide gap between what they charge new borrowers and what they pay new depositors.
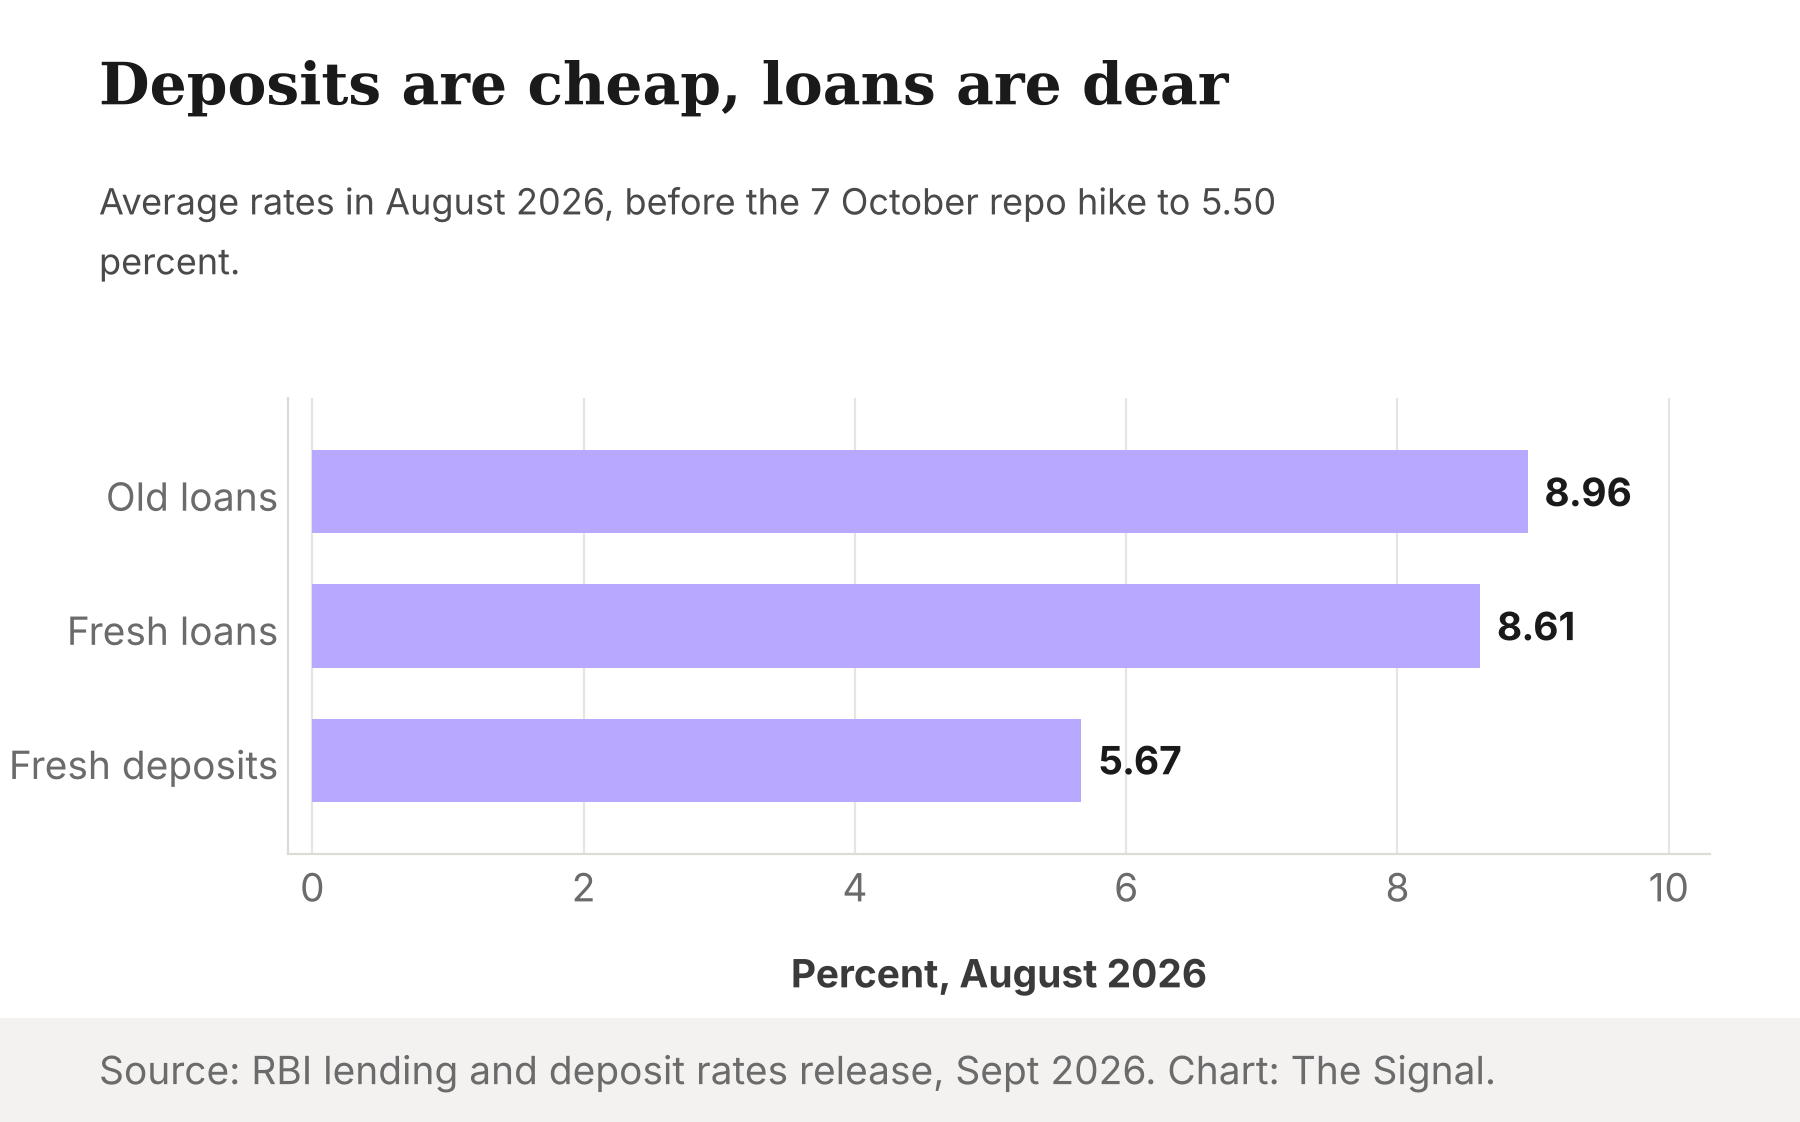
The one-year median MCLR, a benchmark for older loans, declined to 8.61 per cent in September 2026 from 8.70 per cent in August. Cheap funding gives banks room to absorb part of the hike rather than pass all of it on.
The honest objection
The strongest case against reading too much into this is that every figure above comes from the RBI's own averages across all banks and loan types. Averages hide mix. A shift in the share of loans on repo-linked benchmarks, or in the composition of lending toward higher-rate segments, can move a weighted rate with no change in how any single loan is priced. The RBI itself attributes the recent hardening of fresh lending rates to robust credit demand and a change in the composition of lending, not to repricing.
That is fair, and it argues for humility about causes, but it does not undo the observation. Even with mix effects, the gap between 204 and 111 bps is the RBI's own measurement of what happened to the average new and existing borrower.
The Signal
The 25 bps hike is a small number, and the RBI has moved its stance to calibrated tightening. If the last cycle is a guide, it will reach new borrowers nearly in full and existing ones in part, and banks' fresh deposit rate of 5.67 per cent in August 2026 gives them room to absorb some of it. What to watch is the monthly RBI lending and deposit rates release: if the fresh-loan rate climbs while the fresh deposit rate stays near 5.67 per cent, banks are keeping the spread. If both rise together, the hike is being shared. The rate on the loan you already have is the last one to move.
Reporting basis: every figure in this piece comes from the Reserve Bank of India, as published in its own Monetary Policy Statement and Governor's statements of 7 June 2024, 5 December 2025 and 7 October 2026, and its monthly lending and deposit rates releases of 31 August and 30 September 2026. The article therefore rests on a single origin, the RBI, and its figures are weighted averages across all scheduled commercial banks. The hike and cut windows differ in length (May 2022 to April 2024, and February to October 2025). The pass-through percentages, the 77 bps and 31 bps gaps, and the 2.94 point gap are The Signal's calculations from those figures.