By the numbers the Nifty 50 has told investors this year, nothing looks especially alarming. The index has gone largely nowhere for two years, and over the trailing year through 28 September 2026, the National Stock Exchange's own data show the Nifty 50 down 7.46 percent, just 5.63 percent over the trailing 30 days. That reads like an ordinary correction, not a crisis.
One layer down, the picture stops matching the headline. Eighteen of the Nifty 50's own 50 constituent stocks, 36 percent of the index, are trading more than 20 percent below their individual 52-week highs, the standard definition of an individual bear market. That fall has wiped out roughly Rs 31.35 lakh crore in market capitalisation across those 18 names alone, even as the benchmark itself sits far closer to its own high.
The Nifty 50 is carrying a bear market inside itself.
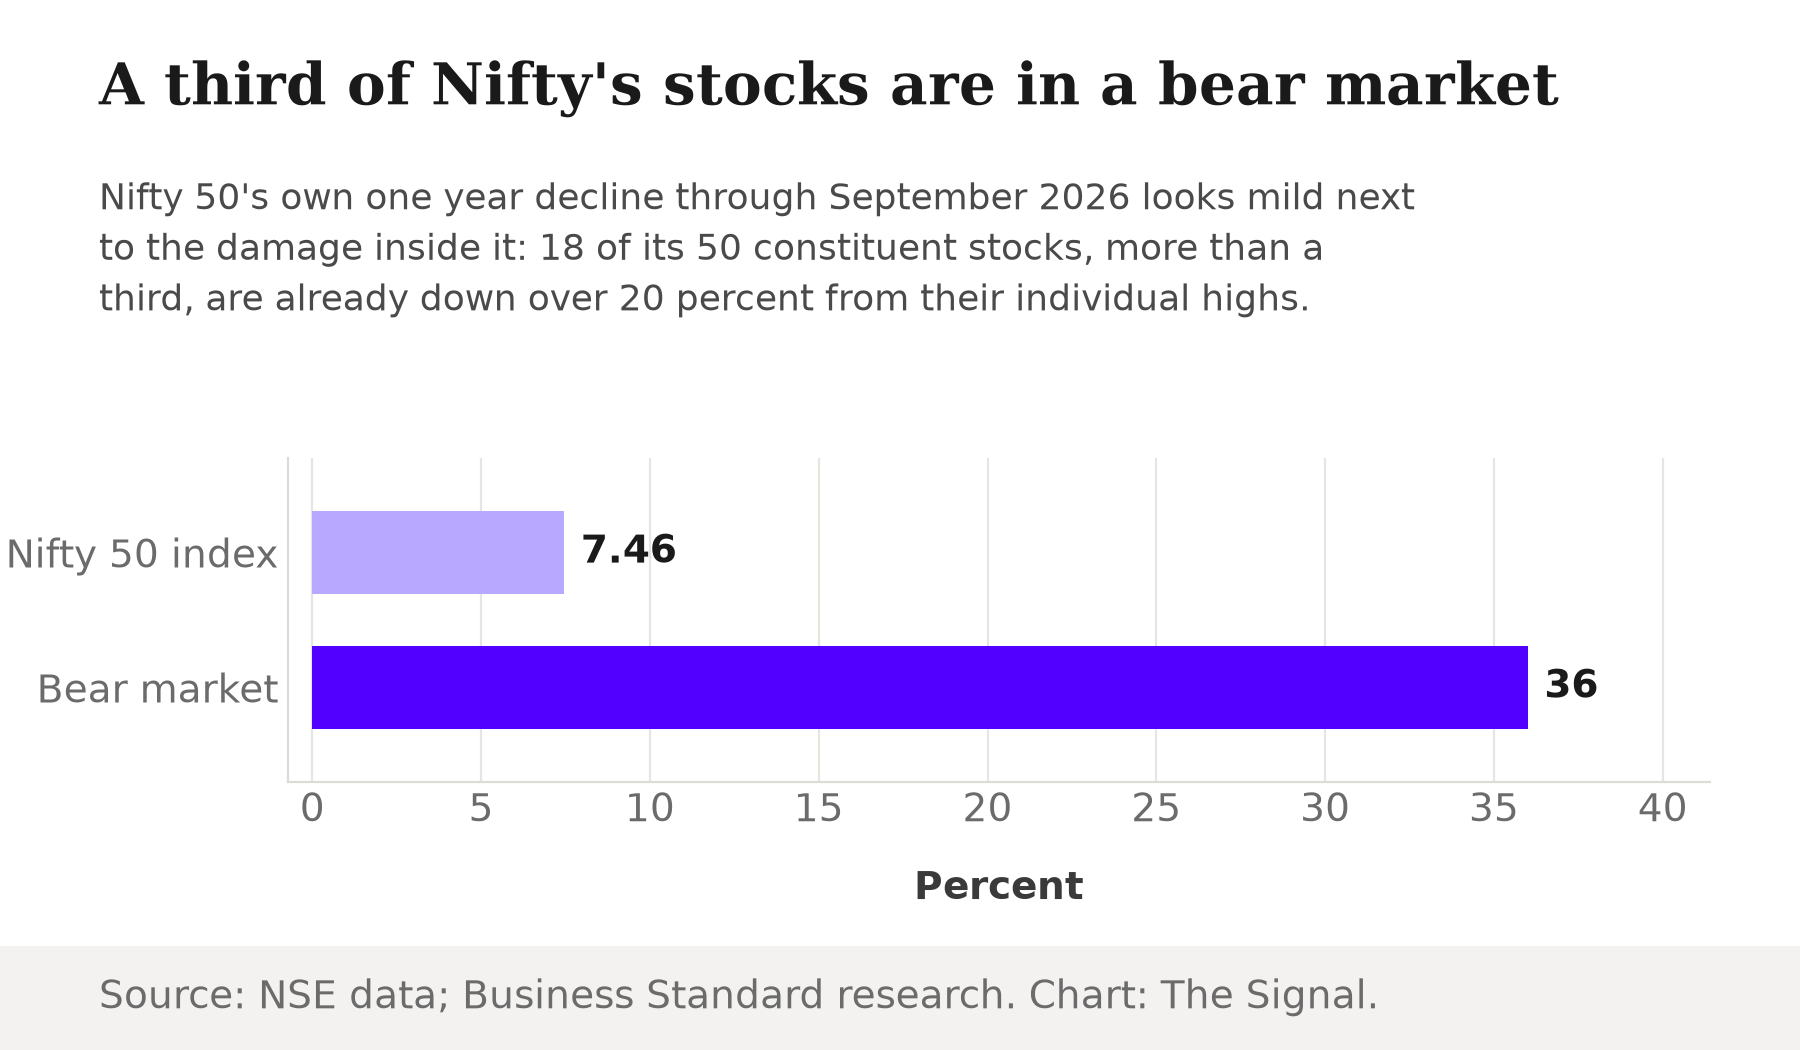
It is worth slowing down on the arithmetic behind that gap. The Nifty 50 itself stood at 23,140.5 on 25 September 2026, against its own 52-week high of 26,373.2, set on January 5, 2026: a decline of about 12 percent from peak to that date. A dozen percent off a high is unremarkable, but that number describes the index, a weighted average dominated by its largest members, not the median constituent. For more than a third of the Nifty's own names, the real number is nowhere near 12 percent.
The names doing the damage
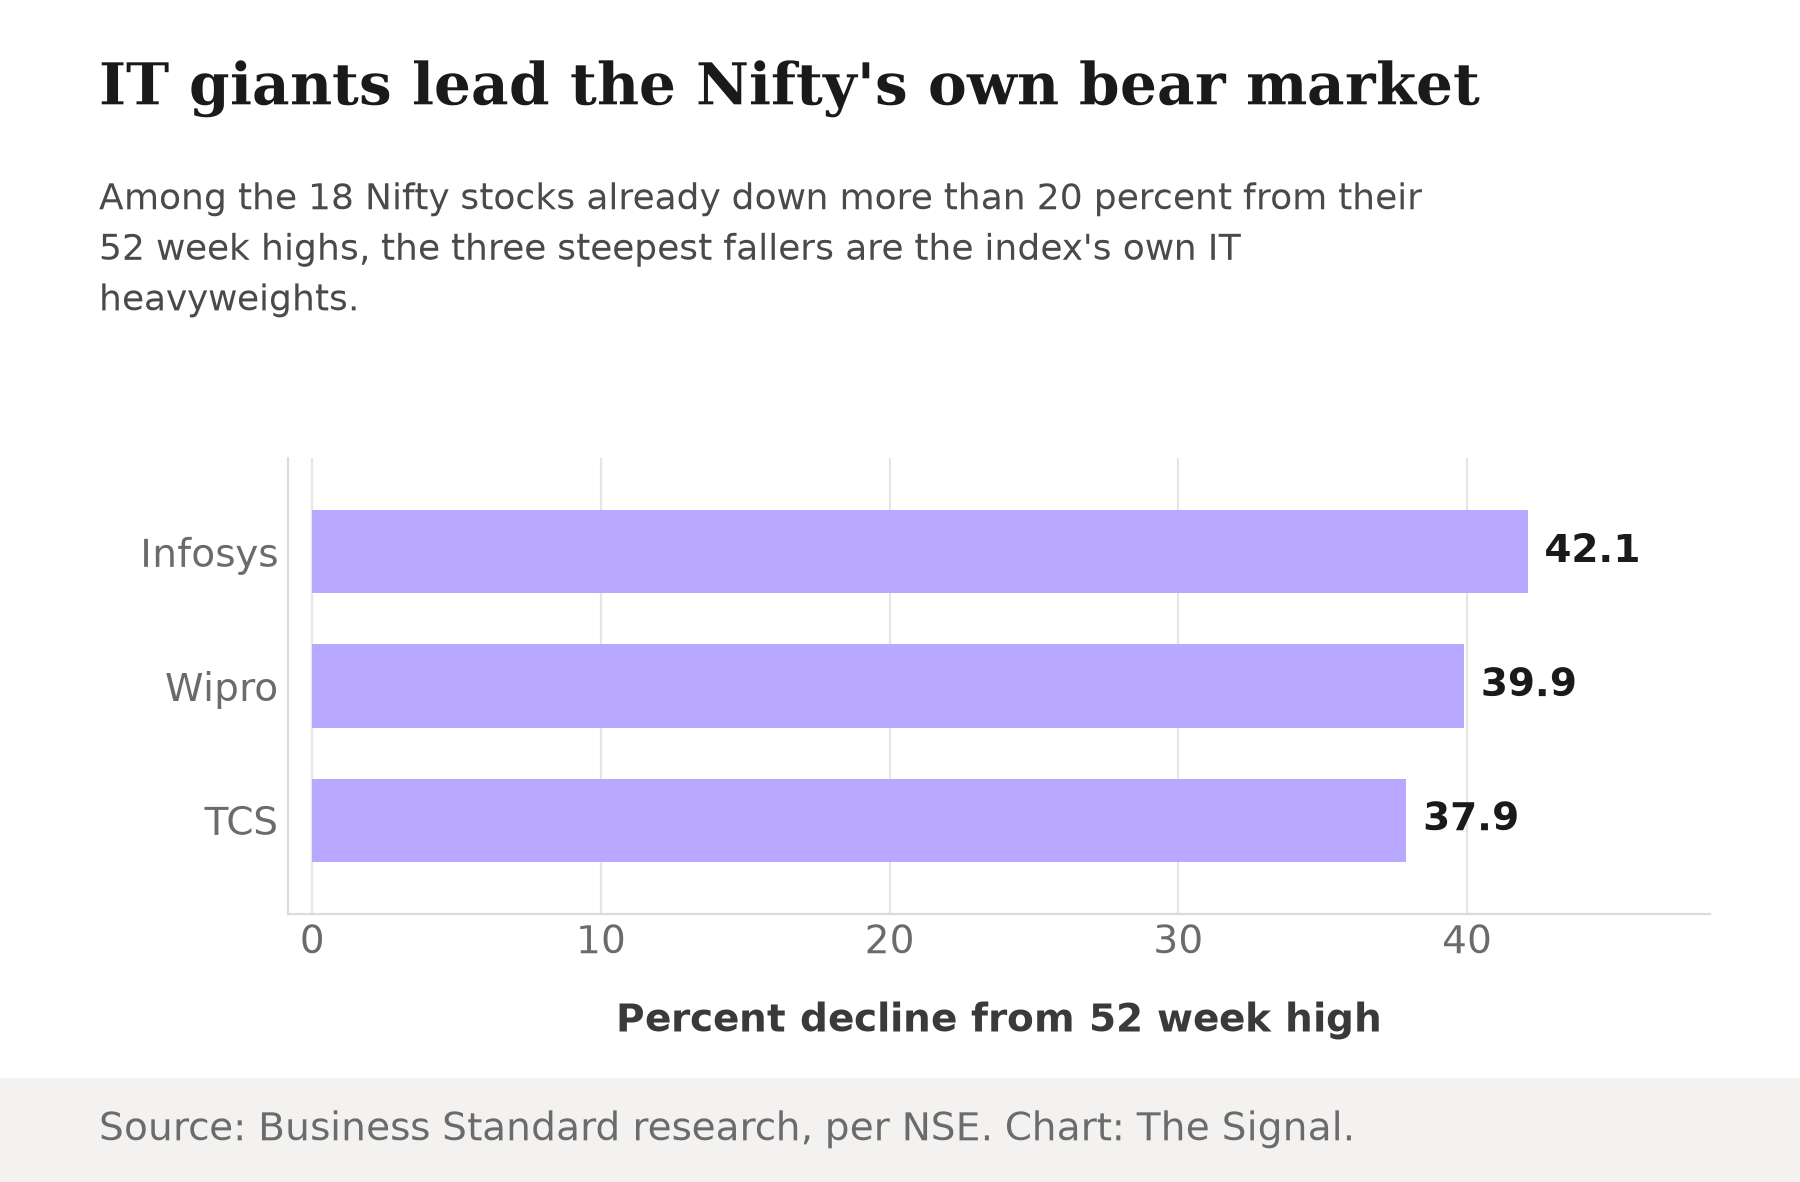
The steepest fallers are three of India's best known technology companies, not obscure small caps hiding inside a broad index: Infosys has fallen 42.1 percent from its 52-week high, Wipro 39.9 percent, and Tata Consultancy Services 37.9 percent, all three inside the same 50-stock index whose headline number looks unremarkable.
The damage is not confined to IT. Reliance Industries' market capitalisation has fallen by about Rs 4.76 lakh crore from its 52-week high, and HDFC Bank's has fallen from Rs 15.49 lakh crore to Rs 11.34 lakh crore, a decline of roughly Rs 4.15 lakh crore. Together, India's largest energy company and its largest private bank account for close to Rs 8.9 lakh crore of the Rs 31.35 lakh crore erosion.
Reliance and HDFC Bank alone account for close to a third of the total erosion.
The remaining names on the list span far beyond IT and banking. Trendlyne's live 52-week-high screener for the Nifty 50, updated 28 September 2026, independently confirms the same 18-stock bear-market cohort and names every one of them: alongside Infosys, Wipro, TCS, Reliance and HDFC Bank sit ITC (down 37.5 percent from its high), Tata Motors Passenger Vehicles (down 61.7 percent, the index's single steepest faller), HDFC Life Insurance (down 32.5 percent), Maruti Suzuki (down 31.1 percent), HCL Technologies (down 30 percent), Jio Financial Services (down 29.4 percent), Hindustan Unilever (down 28.5 percent), Tata Consumer Products (down 25.2 percent), ONGC (down 24.6 percent), Trent (down 22.7 percent), Mahindra & Mahindra (down 22.1 percent), NTPC (down 22.1 percent) and State Bank of India (down 21.8 percent). Autos, insurance, FMCG, energy and public-sector utilities are all represented: this is not a two-sector story.
| Company | Market cap at 52-week high | Market cap now | Decline |
|---|---|---|---|
| Reliance Industries | Rs 21.35 lakh crore | Rs 16.59 lakh crore | ~Rs 4.76 lakh crore |
| HDFC Bank | Rs 15.49 lakh crore | Rs 11.34 lakh crore | ~Rs 4.15 lakh crore |
Source: Business Standard, research compilation.
None of this is a one-week wobble. The Nifty 50 has now fallen for seven straight weeks through 25 September 2026, matching its losing streak during the Covid crash of 2020. And in a single trading session on 28 September 2026, the NSE's own data show only 1 of the Nifty 50's 50 constituents advancing against 49 declining: a near-total washout buried inside a single day's index move that barely registers as news.
This is not new. It has been climbing for a while
The gap between a calm index and a rotting median stock is not new. As early as 26 February 2026, a Monarch AIF analysis found nearly 80 percent of India's broader listed universe, companies with market capitalisation above Rs 1,000 crore, already in individual bear-market territory even as headline indices like the Nifty traded near all-time highs, down only 3 to 5 percent, a divergence building since September 2024. That reading covered a far broader universe than the 50-stock Nifty, so the percentages are not directly comparable, but the direction is the same phenomenon at a later stage: damage that started in the broader market has since reached deep enough into the index's own top 50 that more than a third of the Nifty itself now qualifies.
The last week's own internals point the same way. In the week to 25 September 2026, the Nifty Midcap 100 fell 2.1 percent and the Nifty Smallcap 100 fell 0.9 percent, while the Nifty 50 itself fell only 0.9 percent, the smaller-cap indices taking the sharper hit.
The broader market takes the harder hit even in an ordinary week.
| Index | Change, week to 25 Sep 2026 |
|---|---|
| Nifty 50 | -0.9% |
| Nifty Midcap 100 | -2.1% |
| Nifty Smallcap 100 | -0.9% |
Source: Deccan Herald.
Who is still buying
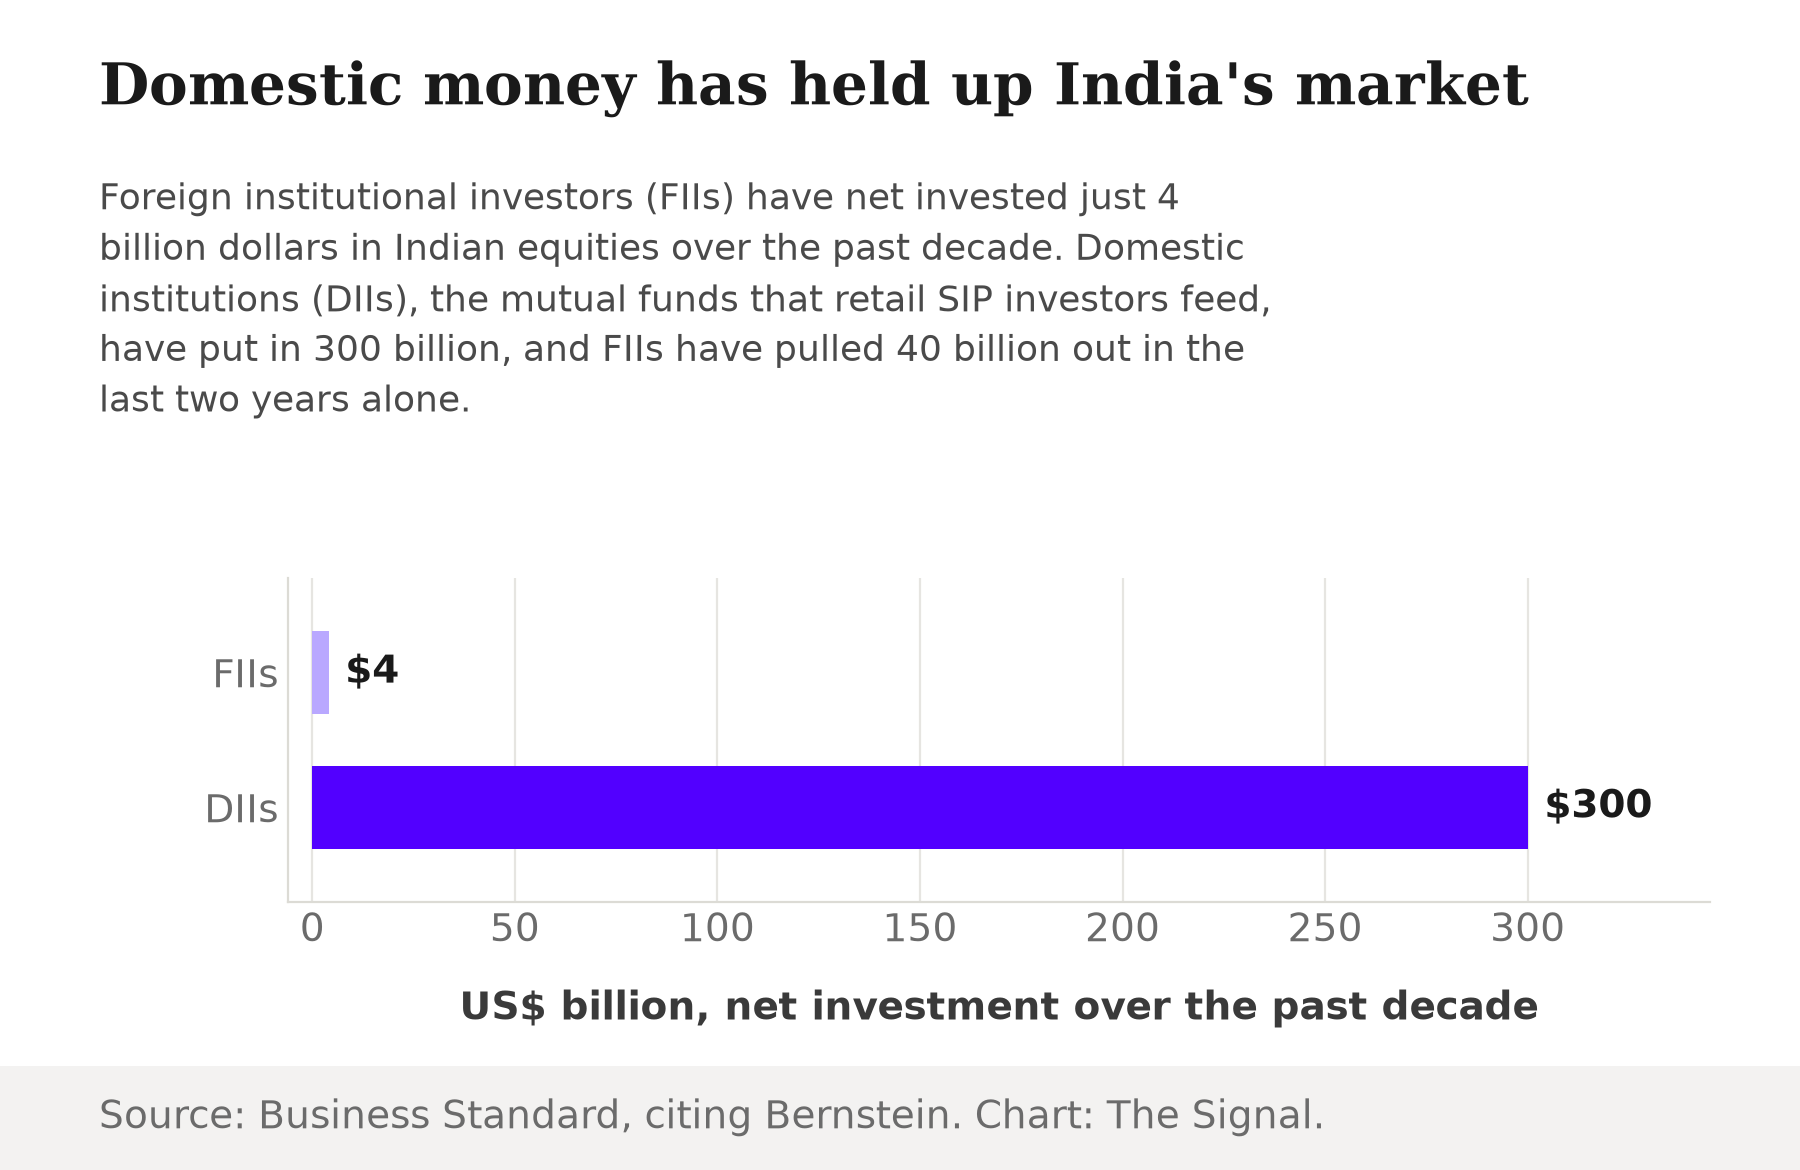
If a third of the Nifty's own stocks are down 20 percent or more, someone is still holding the index up: domestic money, not foreign, and it is not close. Bernstein data, cited by Business Standard, show foreign institutional investors have net invested just $4 billion in Indian equities over the past decade, against $300 billion from domestic institutions, and FIIs have withdrawn $40 billion in the last two years alone.
2026 has followed the same pattern. Foreign portfolio investors net sold Indian equities in every month of the year except February, July and August, for a cumulative net outflow of about Rs 2.42 lakh crore between January and 25 September 2026. Someone has been buying enough to keep the index a mere 12 percent off its own high rather than in freefall, and a large share of that buying is retail money moving through mutual funds. Equity mutual fund schemes held 18.92 crore investor folios as of 31 August 2026, with net inflows of Rs 29,328.62 crore into equity schemes in that month alone. That money is not spread evenly: small-cap funds topped the inflow chart for a second straight month with a record Rs 7,973 crore, mid-cap funds gathered nearly Rs 7,000 crore, while large-cap funds saw net outflows of more than Rs 1,000 crore in each of July and August 2026, retail money tilting toward exactly the segment that a flat Nifty 50 headline does not describe.
Domestic institutions, fed largely by retail SIP money, have absorbed nearly all of the foreign selling and then some.
That is the second-order problem: the same retail investors whose SIP contributions are cushioning the index are reading the index level as their proxy for the market. An index down 7.46 percent over the trailing year tells a SIP investor that patience is being rewarded. It says nothing about the fact that 36 percent of the very companies inside that index have already lost a fifth or more of their value, or that a fund tilted toward mid or small caps has likely fared closer to the Midcap 100's 2.1 percent weekly decline than to the benchmark's 0.9 percent.
The honest objection
The strongest case against reading this as rot is that it may be a healthy, overdue repricing, not a warning sign. DSP Mutual Fund's Sahil Kapoor describes the last two years as a "time correction," in which the Nifty's price stayed flat while earnings and book values caught up underneath it: by July 2026 the index's price-to-book ratio had fallen below 3 times for the first time since December 2020, trailing price-to-earnings had moved close to 20 times, and the latest quarter saw Nifty 50 profits reach a 10-quarter high. On that reading, a flat index sitting atop rising earnings is not hiding damage, but getting fundamentally cheaper while overextended individual stocks give back what they owe.
That case is real and fits the aggregate index numbers well. It fits less comfortably with a single trading session in which 49 of the Nifty's 50 stocks declined together, or with three of India's largest, most heavily analysed IT companies each down close to 40 percent from their highs at the same time. A falling price-to-book ratio can coexist with genuine repricing in some names and genuine distress in others; the breadth data cannot say which stock is which. It cannot say the calm index number is a reliable stand-in for either story.
The Signal
The Nifty 50 was built to summarise the market in one number, and for a retail investor checking a SIP statement, that one number is what registers. But an index level is a weighted average that can stay calm while a large share of its own members do not: that is arithmetic, not conspiracy. What has changed since February 2026 is where that gap sits: it started outside the Nifty, in the broader market, and has since climbed into the index's own top 50, IT and banking heavyweights included. The money holding the headline number up is increasingly the same domestic, retail-fed capital reading that number as reassurance. The figure worth watching from here is not the Nifty's next percentage move. It is whether the 36 percent share of Nifty stocks already in their own bear market keeps rising, because if it does, retail investors treating the flat index as the whole story will be the last to notice.
Reporting basis: the bear-market breadth count, the market-cap erosion, and the Infosys, Wipro, TCS, Reliance and HDFC Bank figures are all from a single Business Standard research compilation. The full 18-name list is independently corroborated by Trendlyne's live 52-week-high screener, whose individual percentages differ slightly from Business Standard's (different snapshot dates and methodology) but confirm the same 18-stock cohort and 20 percent cutoff. The Nifty 50's own index level, 52-week range, 30-day and 365-day changes, and single-session advance-decline count are from NSE's own live index data. The seven-week losing streak and the FII-versus-DII decade flows are from Business Standard, citing Bernstein research, resting on a single outlet's relay of that analysis. The prior week's Nifty 50, Midcap 100 and Smallcap 100 returns are from Deccan Herald. The "time correction" framing and the valuation and profit figures are as described by DSP Mutual Fund's Sahil Kapoor to Business Today. Equity fund folio counts and August 2026 aggregate inflows are from AMFI's official monthly report; the scheme-type breakdown (small-cap, mid-cap and large-cap flows) is from Business Standard, reporting on that same AMFI data. The 2026 FPI outflow figures are from NSDL's official data. The February 2026 broader-market reading is from a separate Business Standard report citing Monarch AIF, a different universe than the Nifty 50. The Rs 8.9 lakh crore combined erosion and the roughly 12 percent index peak-to-date decline are The Signal's calculations from those figures.