India's mutual fund industry closed the year to March 2026 on a record. SEBI's Annual Report 2025-26 shows the number of SIP accounts grew 3.9 percent to 10.45 crore, with the average net monthly SIP contribution up 25.8 percent to a record Rs 16,413 crore, from Rs 13,052 crore in FY2024-25. The same report shows the industry's unique investor base grew 13.2 percent to 6.1 crore, with Tier-II cities doing the heavy lifting: their investor count surged 37.6 percent, from 1.0 crore to 1.4 crore. Read only the totals, and a decade-long campaign to turn small, disciplined monthly investing into a mass habit looks like it is working exactly as designed.
Every headline number in SEBI's Annual Report 2025-26 points the same way: up.
| Metric, FY2024-25 vs FY2025-26 | 2024-25 | 2025-26 | Change |
|---|---|---|---|
| Total SIP accounts | 10.05 crore | 10.45 crore | +3.9% |
| Average net monthly SIP inflow | Rs 13,052 crore | Rs 16,413 crore | +25.8% |
| Unique mutual fund investors | 5.4 crore | 6.1 crore | +13.2% |
| Tier-II city investors | 1.0 crore | 1.4 crore | +37.6% |
Source: SEBI, Annual Report 2025-26.
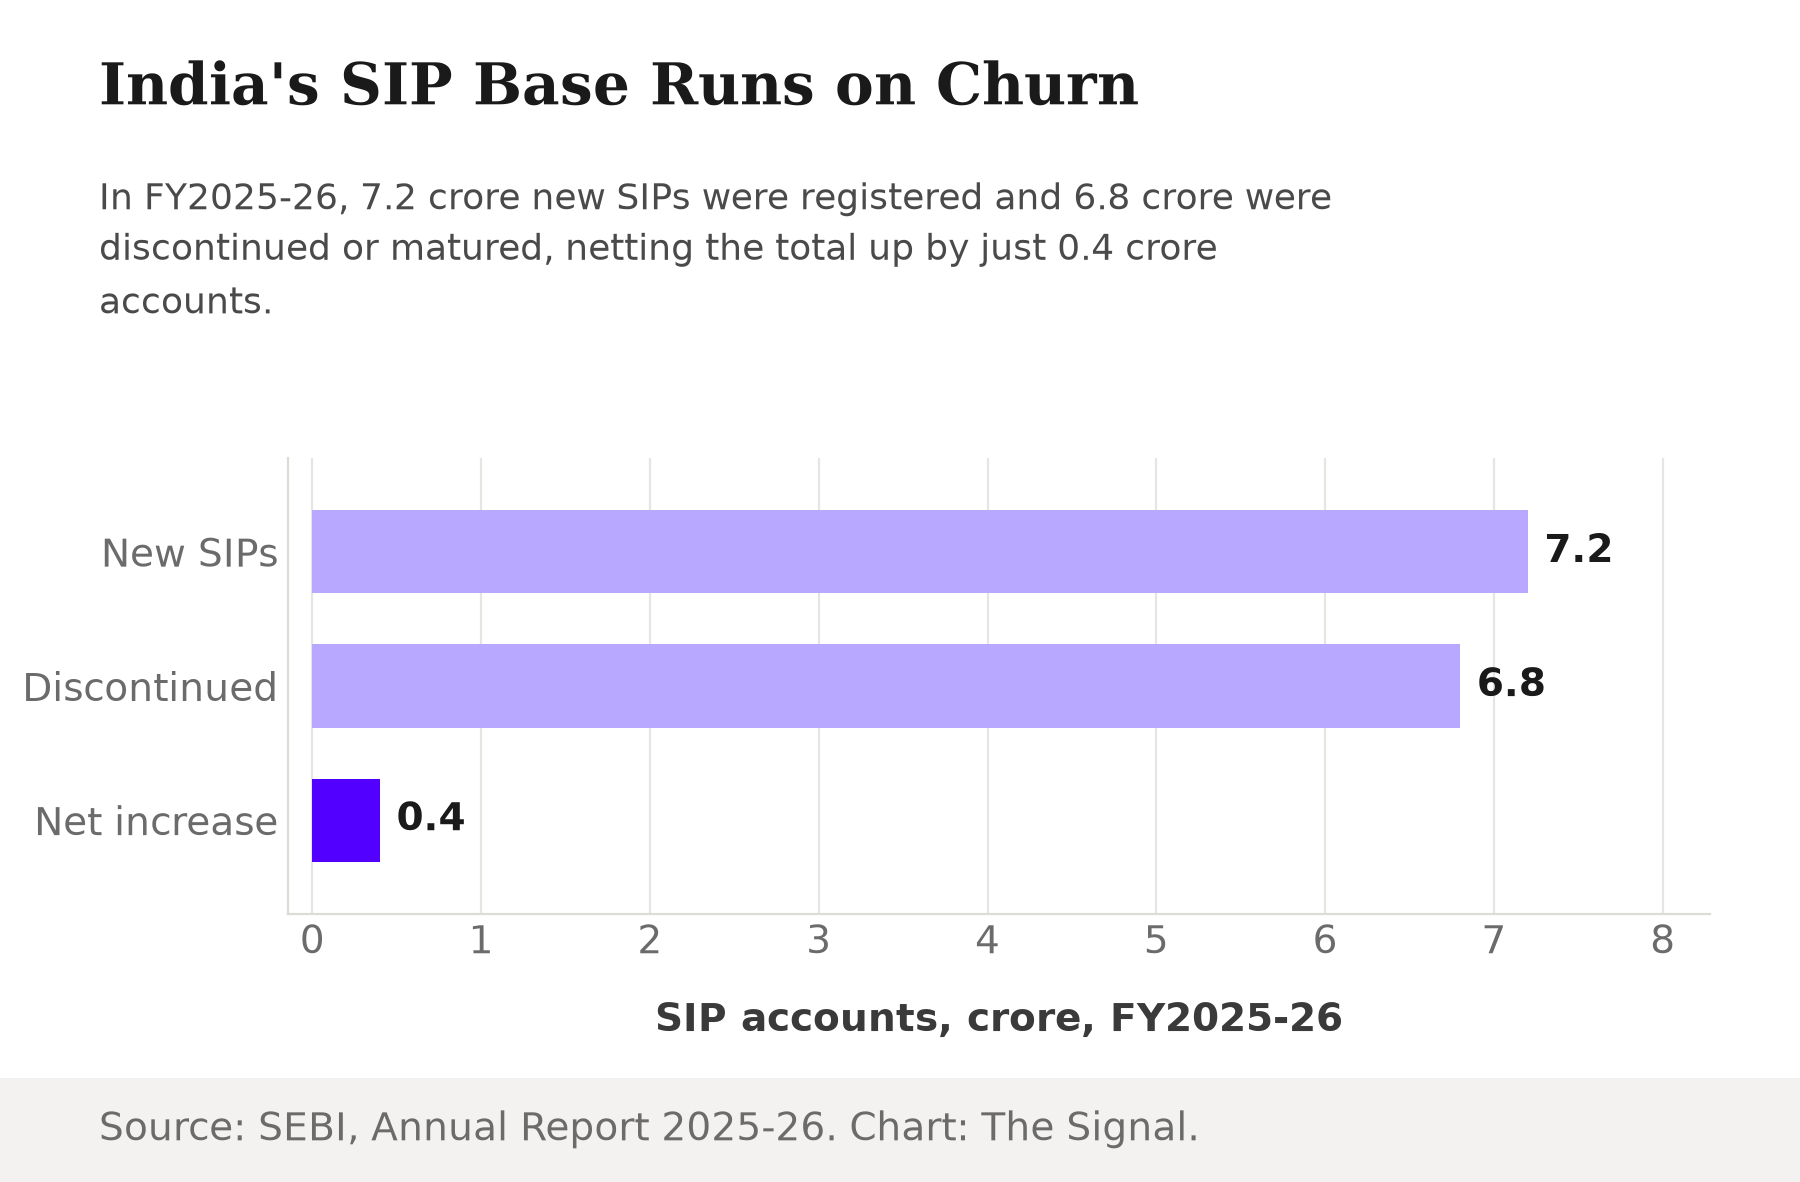
It is worth slowing down on that framing. The same SEBI report shows that behind the 3.9 percent net rise in accounts sits a churn rate the topline number hides completely: 7.2 crore SIPs were newly registered in FY2025-26, and 6.8 crore were discontinued or matured. Nearly as many accounts closed as opened. The net gain of 0.4 crore is not a smooth accretion of new savers. It is the residue left after a much larger churn underneath.
Who is opening them, who is closing them
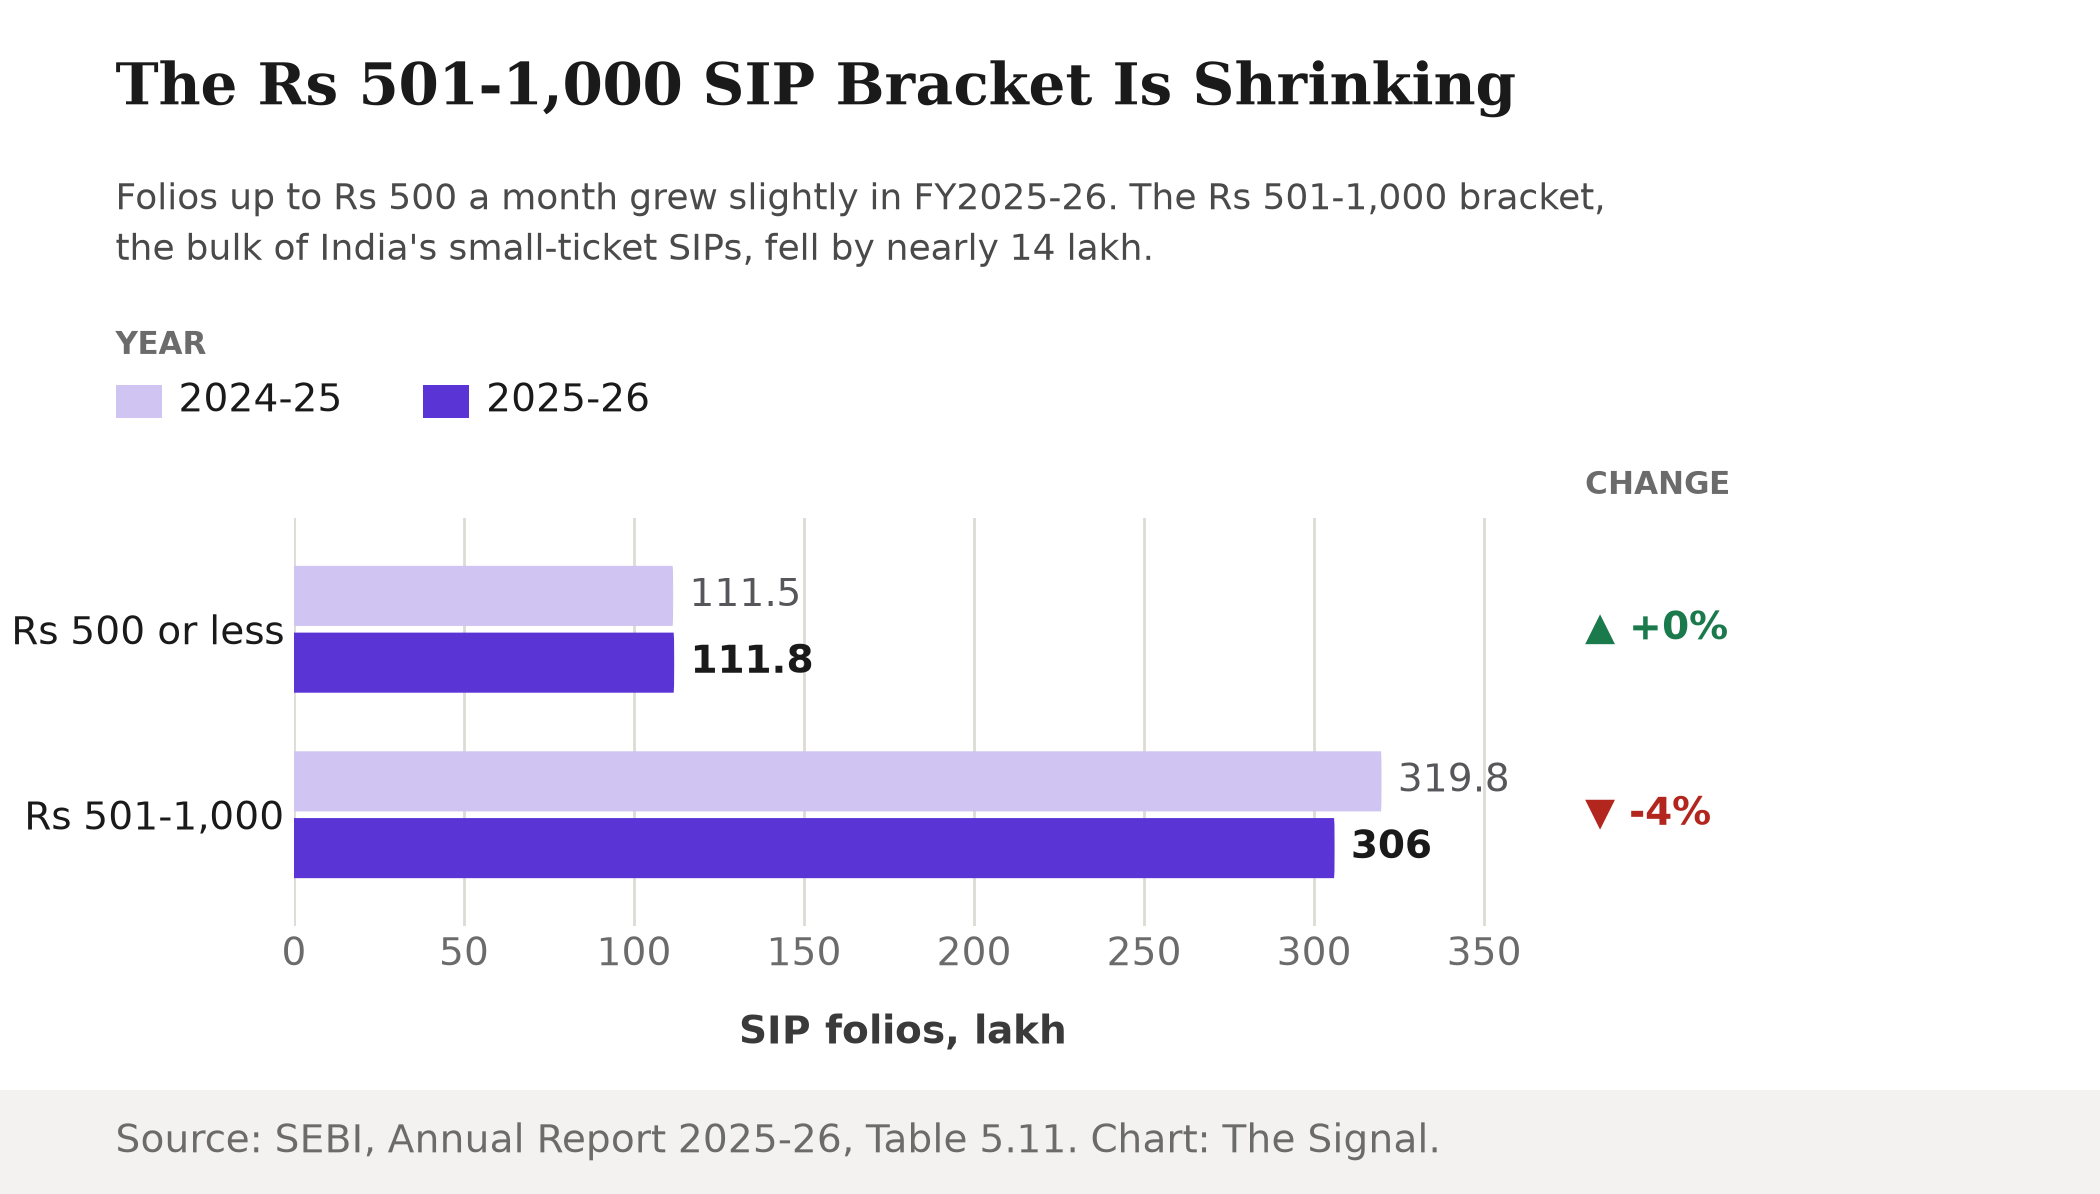
The clean growth number gets murkier again once you look at who is opening and closing these accounts. SEBI's report breaks SIP folios down by the size of the monthly instalment, and the smallest bracket did not shrink at all: folios contributing Rs 500 a month or less rose slightly, from 1,11,51,596 to 1,11,76,428. The decline sits one rung up. Folios in the Rs 501-1,000 bracket, the bulk of India's small-ticket SIPs, fell 4.33 percent, from 3,19,83,946 to 3,05,97,939, a drop of nearly 13.86 lakh accounts. Combined, folios contributing Rs 1,000 a month or less fell from 4.31 crore to 4.18 crore in FY2025-26, a net decline of about 13.6 lakh accounts, driven almost entirely by that one bracket.
A Rs 500 monthly SIP is not a rounding error to the household making it. MoSPI's Household Consumption Expenditure Survey 2023-24 shows average monthly per-capita spending was Rs 4,122 in rural India and Rs 6,996 in urban India in 2023-24, which puts a Rs 500 SIP at roughly one-eighth of a typical rural Indian's entire month of spending (our calculation from those two figures). That is the bracket holding steady. The one actually shrinking, Rs 501 to Rs 1,000 a month, is not the poorest tier of investor. It is the rung just above: someone with enough discretionary income to commit Rs 501 to Rs 1,000 a month and, on FY2025-26's numbers, less willing or less able to keep doing it.
The market is leaning on this money
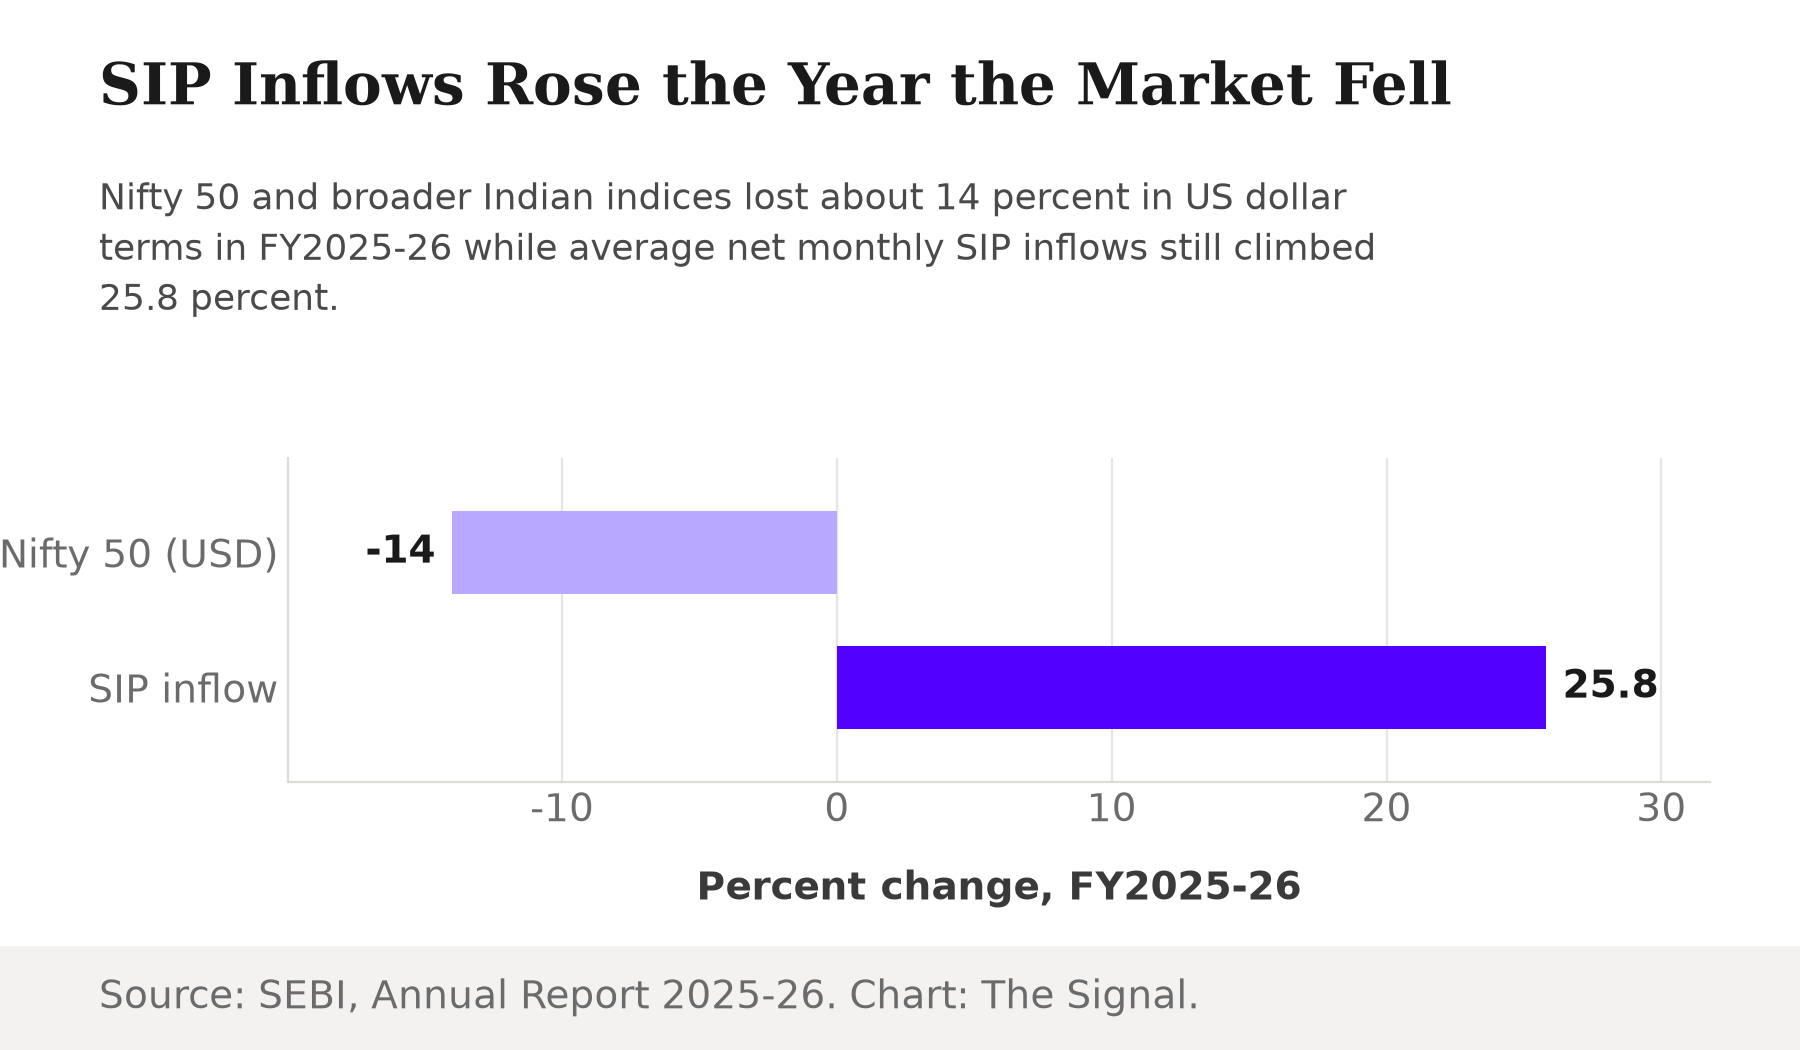
The stakes of that shift are larger than one bracket of folios, because domestic SIP money spent FY2025-26 doing real work for the market. SEBI's Annual Report 2025-26 shows the Nifty 50 and broader Indian equity indices declined about 14 percent in US dollar terms over the full year, a genuinely weak year by the market's own account. The report also shows foreign portfolio investors pulled a record USD 19.7 billion net out of Indian equities during the fiscal year, the highest such outflow on record, with selling intensifying after the Middle East conflict broke out. Domestic institutional investors, fed by that same SIP machine, provided the buffer, with SIP flows staying robust and partially offsetting the foreign selling.
SIP inflows kept climbing in the one year foreign investors ran for the exit.
The freshest print agrees, mostly
AMFI's July 2026 monthly note reports gross SIP contributions of Rs 31,961 crore that month, up 12.3 percent year on year, and describes it as sustained investor interest. The same note puts the number of active SIP accounts at 9.90 crore in July 2026, below the 10.45 crore SEBI recorded for the full fiscal year ended March 2026. The two bodies are not measuring quite the same thing, SEBI's fiscal year-end tally against AMFI's monthly active-account count four months on, so this is not fresh evidence of decline. But it is a reminder that even the newest official print does not resolve into one tidy number, and that "record" and "shrinking" can both be true descriptions of the same underlying base depending on which slice a reader is handed.
The honest objection
The strongest case against reading any of this as distress is that SIP accounts have always churned this way. A SIP is typically tied to a goal, a child's school fee, a house down payment, a fixed multi-year mandate, and by design a healthy share matures or gets closed every year as goals are met or investors switch schemes or funds. SEBI's own report shows the unique investor base still grew 13.2 percent to 6.1 crore in FY2025-26, with Tier-II cities alone adding roughly 40 lakh new investors. That is not the profile of a market losing its lower-income base. It is one still finding new savers faster than it is losing old accounts, just not uniformly across every ticket size.
That case holds for the account-level churn. It holds less well for the bracket-level pattern, because churn alone does not explain why the total kept rising even as this one bracket fell. SEBI's report shows total SIP accounts still rose 3.9 percent in FY2025-26, which means the growth had to come from somewhere else, bigger tickets, new Tier-II investors, not from the Rs 501-1,000 cohort itself. SEBI's full folio-value table confirms exactly where: every bracket above Rs 1,000 grew, and the growth rate rises with ticket size, from 0.5 percent in the Rs 1,001-3,000 band to 2.8 percent in Rs 3,001-5,000, 5.0 percent in Rs 5,001-10,000, and 5.95 percent in the Rs 10,001-and-above band, its fastest-growing bracket in FY2025-26. A stable base that churns in place is one story. This base grows in aggregate while one specific, middling ticket size shrinks, and grows fastest at its very top: the record is being carried by a changing mix of investors, not a widening one.
The Signal
The number to watch next year is not the 10.45 crore total, and not the 3.9 percent growth rate. It is what SEBI's next annual report shows about the Rs 501-1,000 bracket specifically. If that bracket stabilises as this year's new Tier-II investors mature into steadier habits, FY2025-26 was a one-off dip inside a genuinely broadening market. If it keeps shrinking while the headline total keeps climbing, the SIP boom is getting taller rather than wider, resting on fewer, bigger contributors even as the industry keeps quoting a record that increasingly describes a different kind of investor than the one the SIP-culture push was built to reach. A record total can rise while its middle narrows. Only the bracket breakdown tells you which one is happening.
Reporting basis: the SIP account and folio counts, the FY2025-26 churn figures, the equity index performance and the FPI outflow figure are all per SEBI's Annual Report 2025-26, drawn directly from the report's own tables and text. The July 2026 SIP contribution and active-account figures are per AMFI's monthly note for that month, the most recent print available, published by the mutual fund industry's own self-regulatory body. The rural and urban monthly per-capita spending figures are from the Ministry of Statistics and Programme Implementation's Household Consumption Expenditure Survey 2023-24, the government's most recent full consumption survey. The rural-spending share of a Rs 500 SIP and the approximate Tier-II investor addition are The Signal's calculations from the SEBI and MoSPI figures.