Every time foreign investors head for the exit, the same conversation starts: is this the selloff that finally breaks the market's back. It came up hard in 2025, when net FPI/FII equity investment into India came to an outflow of ₹166,286 crore for the year, and it has come up again in 2026: foreign investors have sold a net ₹237,451 crore of Indian equities in the year to 14 August 2026 alone, the heaviest annual outflow in NSDL's decade of flow data. Two back-to-back years like that look like exactly the kind of stress a foreign-funded market should show.
It is worth slowing down on that premise, though. Add up every calendar year of NSDL's FPI equity flow data going back to 2016, the good years and the bad, and the whole decade nearly cancels out. Ten full years plus 2026's first seven and a half months net to an outflow of only about ₹17,700 crore, roughly $2 billion, on a market where a single year's swing regularly ran into the hundreds of thousands of crore in either direction. Over that same stretch, the market did not merely hold up: the Sensex climbed from around 26,600 in 2016 to near 85,000 by the end of 2025, its tenth consecutive year of positive returns. Foreign investors did not fund that run. On net, across ten and a half years, they barely showed up to it.
Ten years of swings that cancel out
The decade was never quiet. Foreign investors put in ₹170,262 crore in 2020, as global capital chased India's post-pandemic recovery trade, then pulled ₹121,439 crore back out in 2022 as global rates rose, then put ₹171,107 crore back in during 2023. Then the direction flipped and stayed flipped: barely any net flow in 2024, a ₹166,286 crore outflow in 2025, and a ₹237,451 crore outflow through the first seven and a half months of 2026. Every one of those swings looked decisive in the year it happened, yet none left a lasting mark on the total.
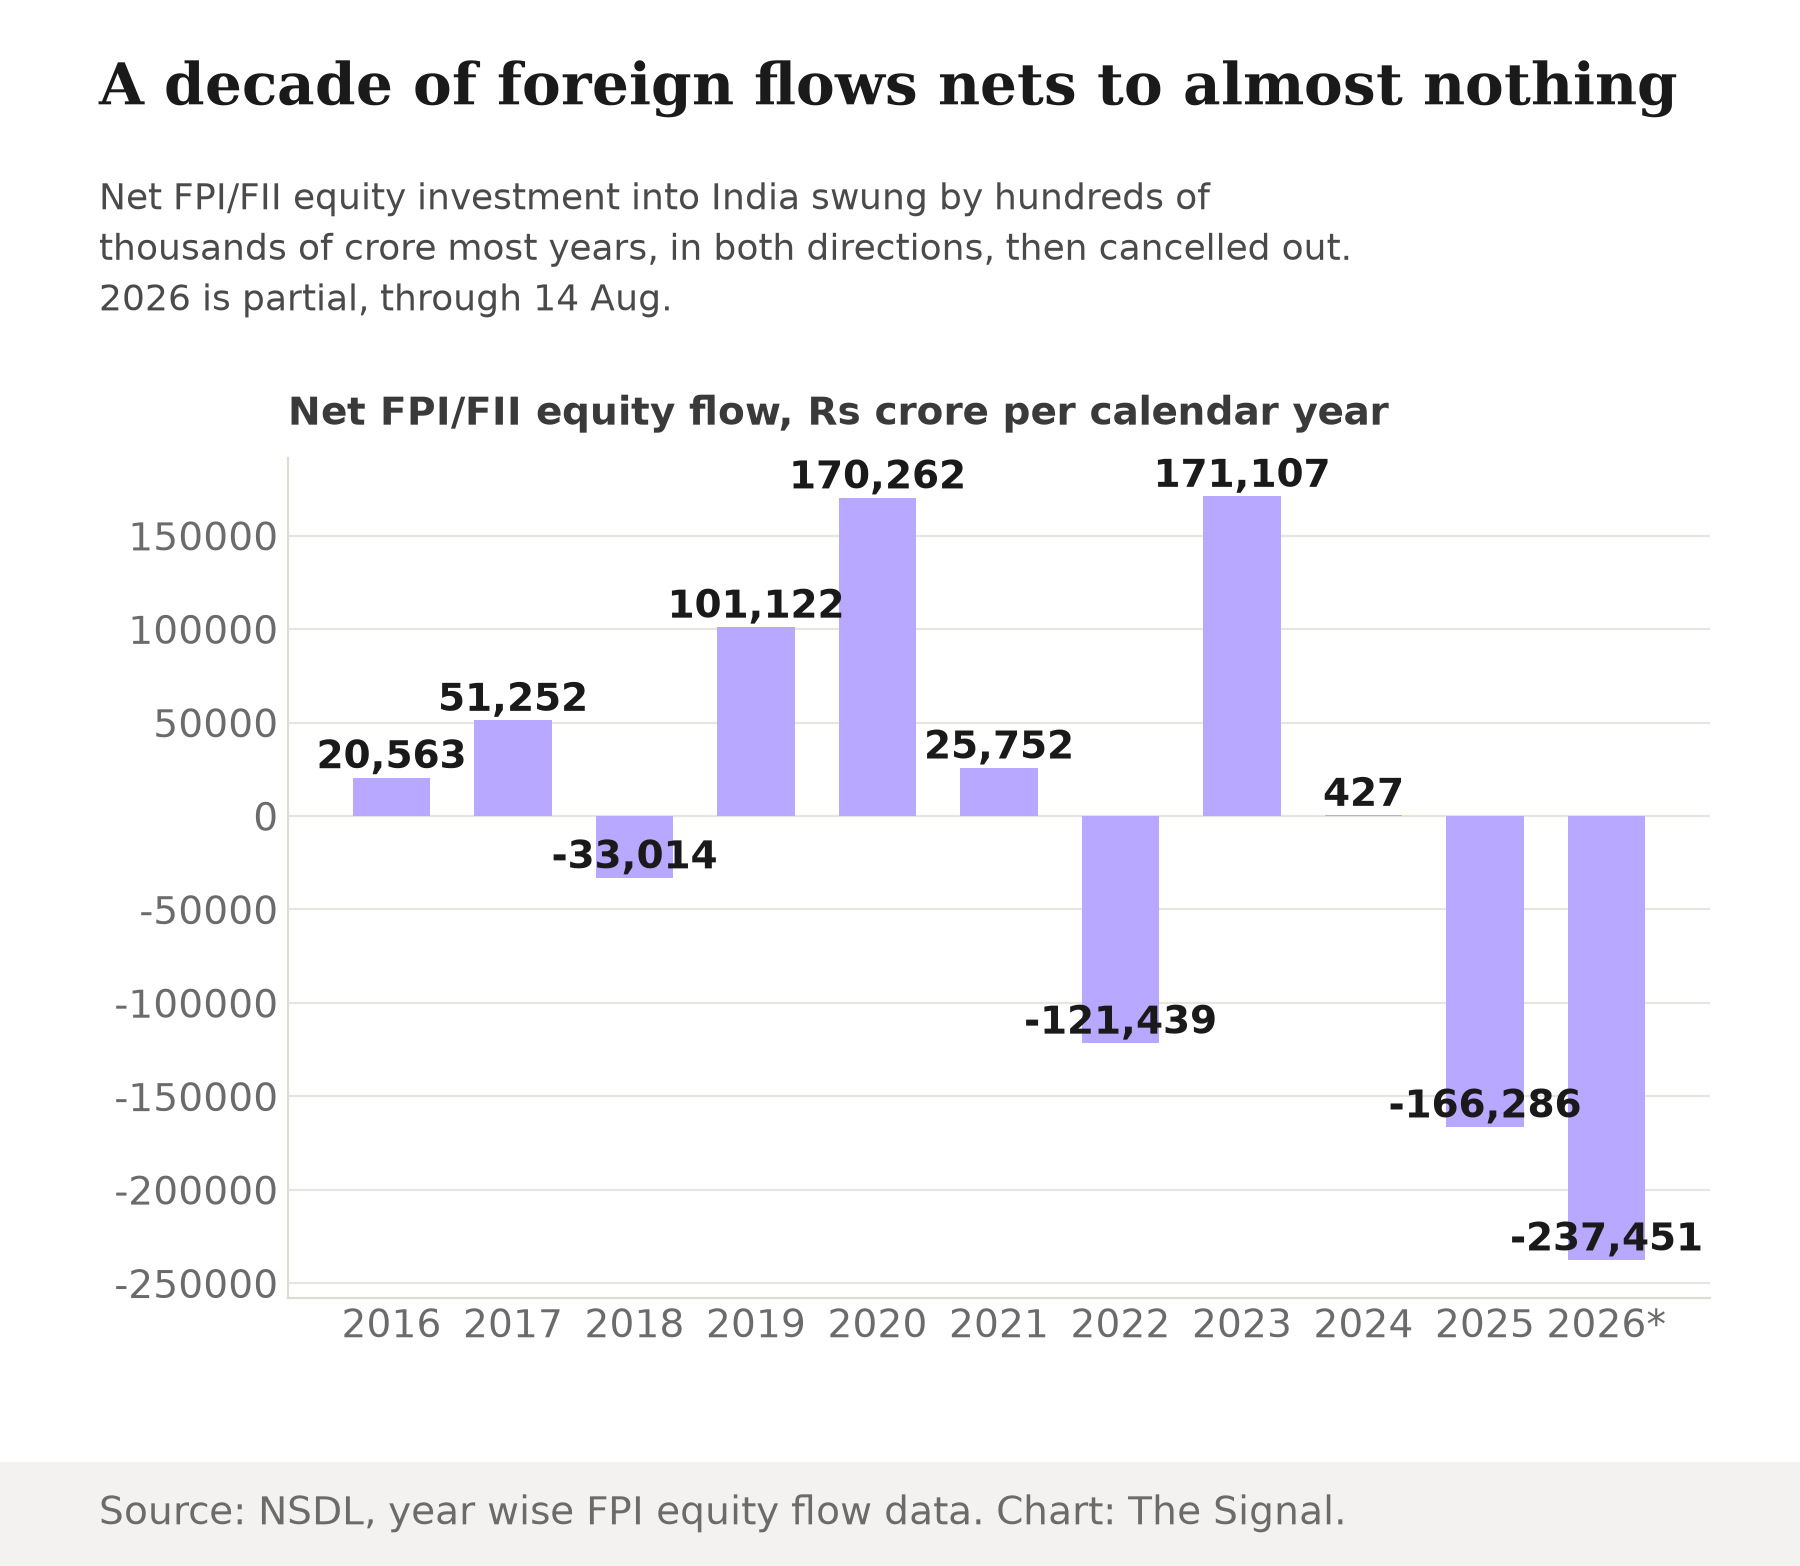
Add up the size of every year's move, ignoring which direction it ran, and foreign investors have shifted roughly ₹99,900 crore a year in or out of Indian equities on average across the decade, our calculation from NSDL's year-by-year figures. Add the same eleven periods up with direction intact, and they net to a number smaller than a single ordinary quarter's swing. The gross churn is real. The net contribution is close to a rounding error.
Domestic money is the base, not the backstop
If foreign flows were not funding the boom, something else was, and by two independent measures domestic investors have now pulled decisively ahead as owners of Indian equities. In its FY2025-26 annual report, SEBI recorded domestic institutional investors booking a record ₹8.5 lakh crore of cumulative net inflows against ₹1.8 lakh crore of FPI net equity outflows. That pushed FPI shareholding of the NSE-listed universe to a 15-year low of 15.8 percent, while DII ownership hit a record 17 percent, as of end-March 2026. Separately, a Motilal Oswal Financial Services report cited by Business Standard found domestic institutional investors holding a record 21 percent of the Nifty 500 in June 2026, against a record-low 17 percent for foreign institutional investors. Over the trailing 22 months, $166 billion of domestic inflows comfortably offset $58 billion of cumulative foreign outflows.
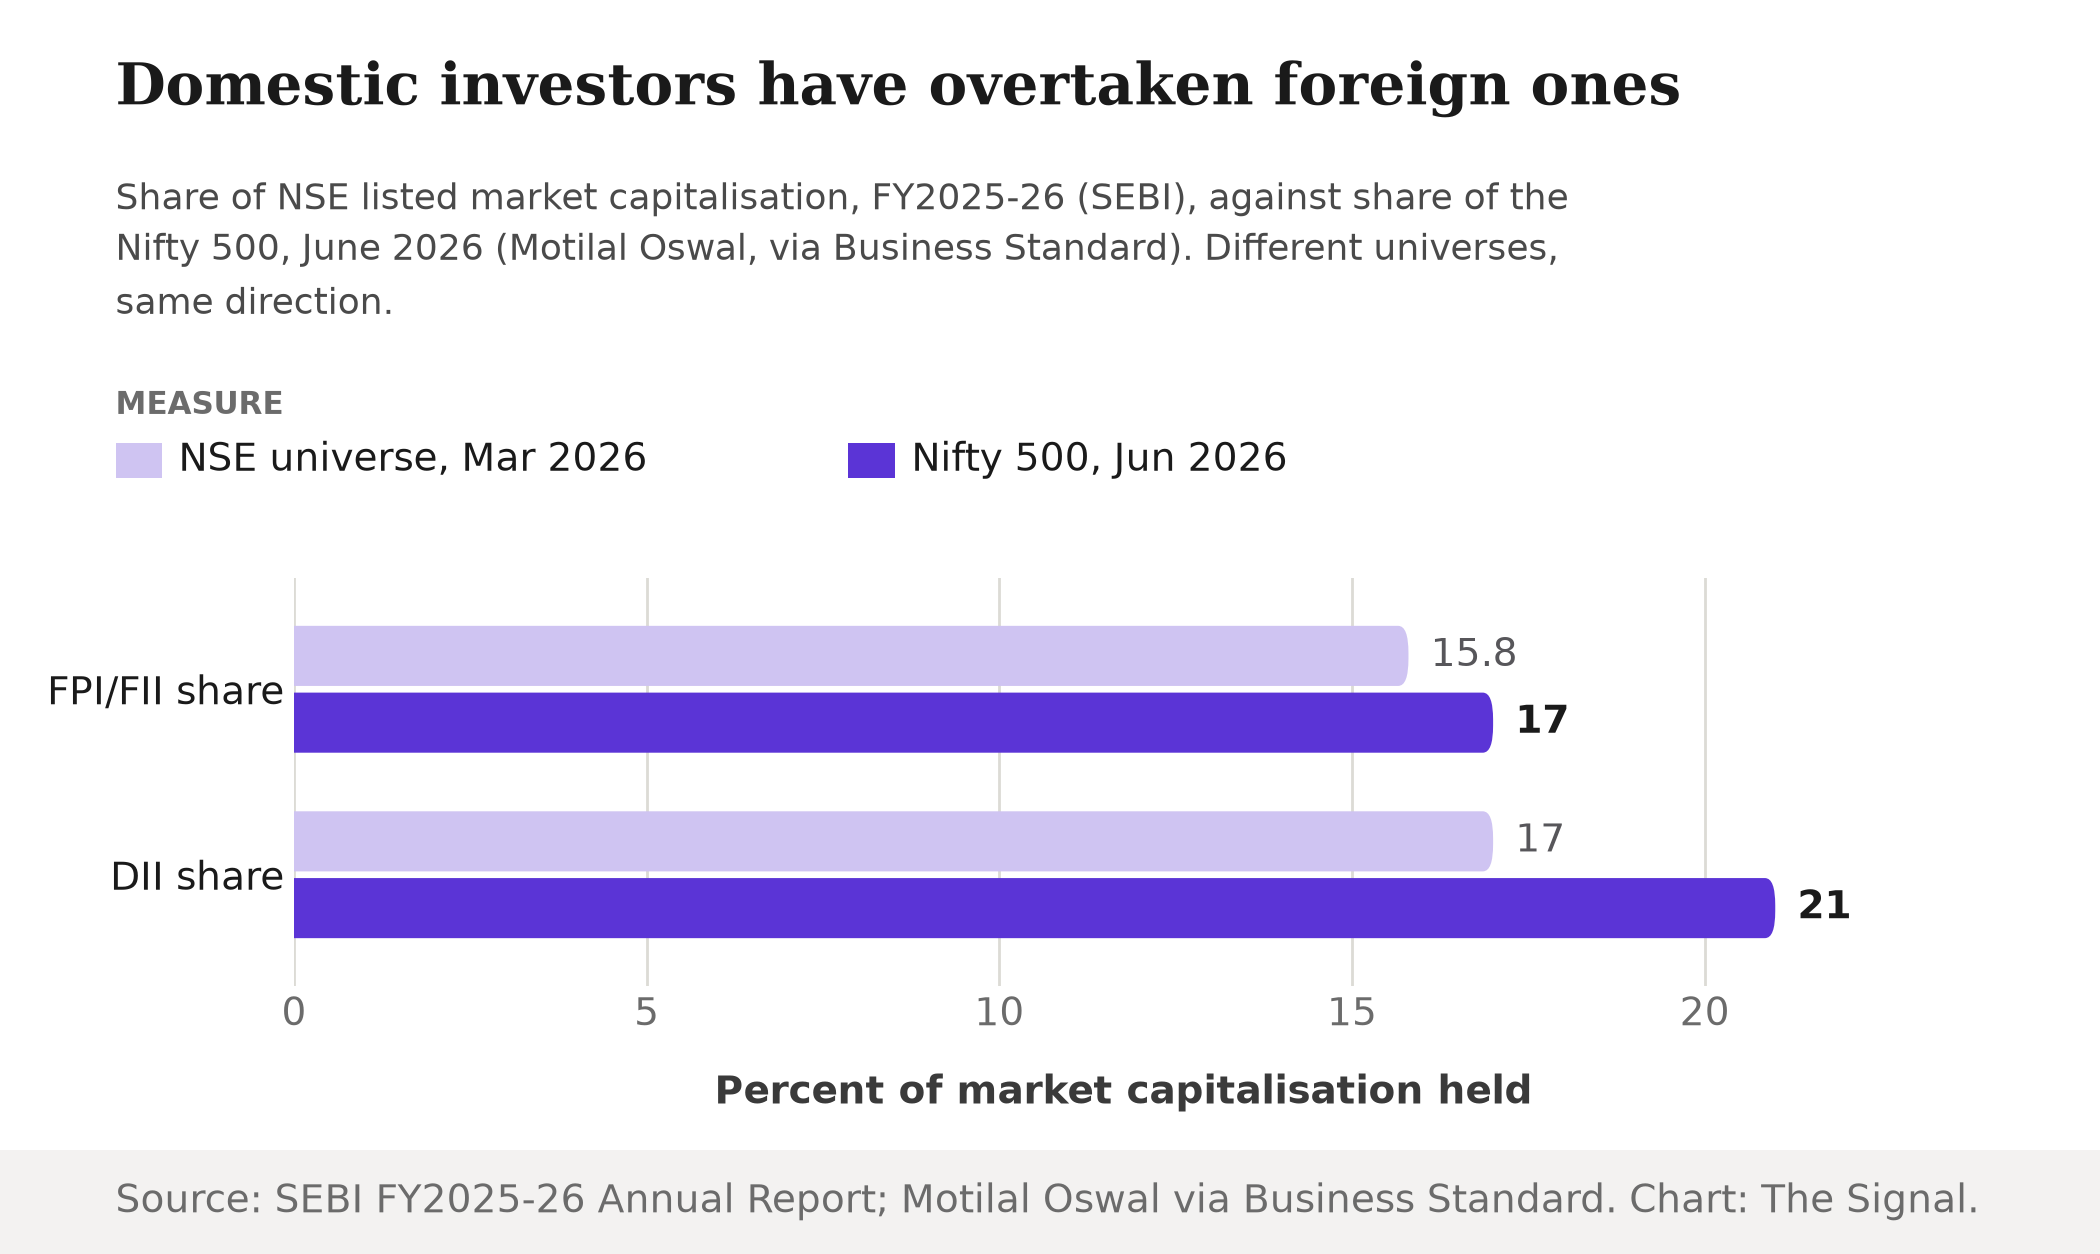
The two readings track different baskets, the whole NSE-listed universe against the Nifty 500, and different months. They still point the same way: however ownership gets sliced, domestic institutions now hold more of India's market than foreign ones do.
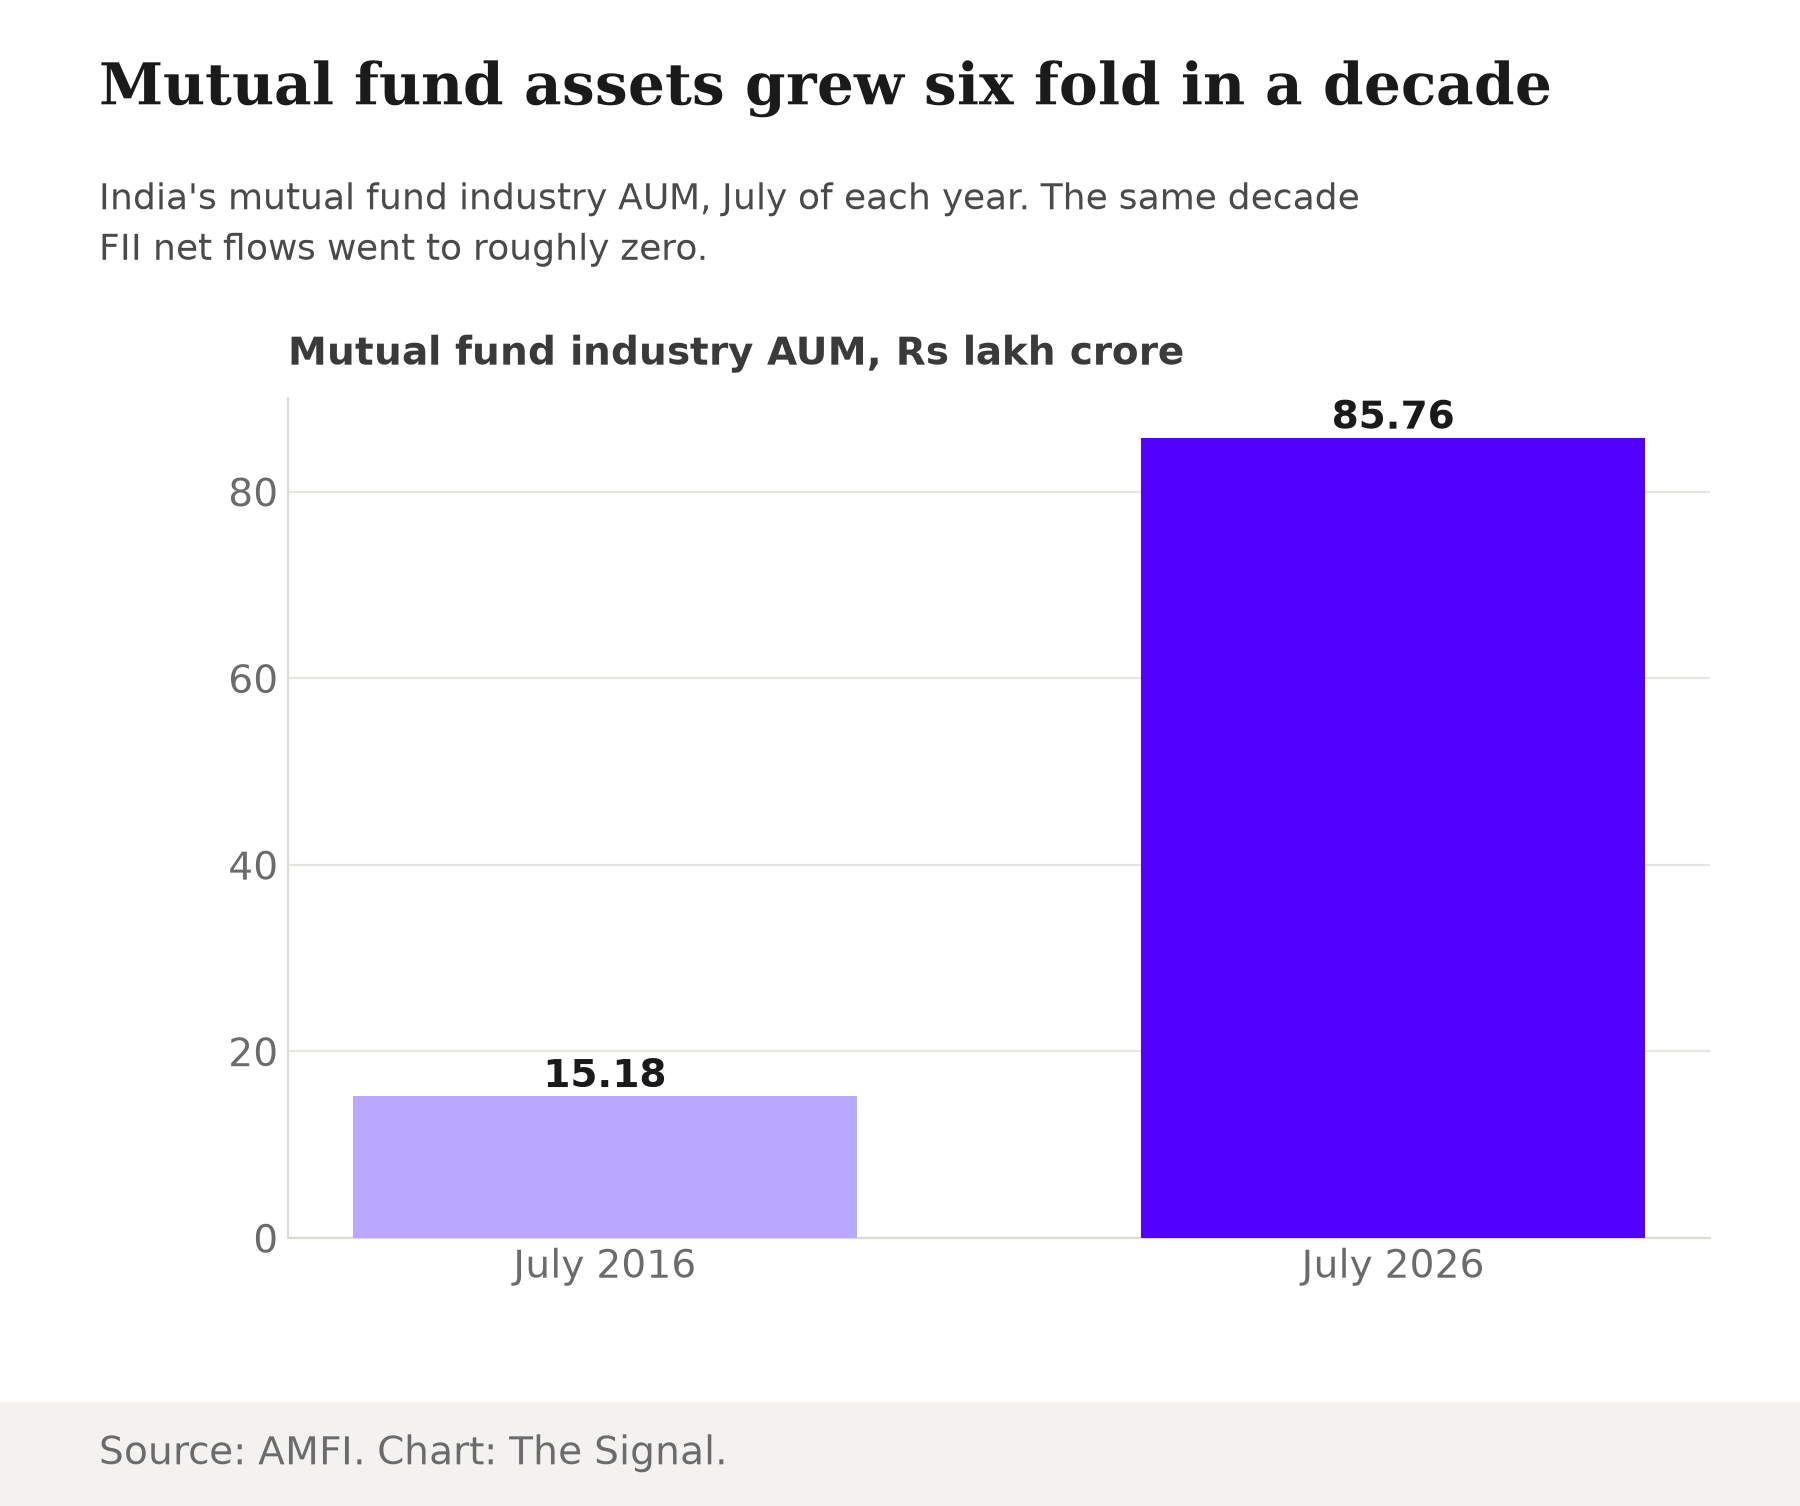
That institutional buying sits on top of a retail base that grew even faster. India's mutual fund industry assets under management grew roughly six-fold over the decade, from ₹15.18 lakh crore in July 2016 to ₹85.76 lakh crore in July 2026.
The monthly retail inflow behind that growth now runs bigger than a whole crisis year's foreign selling once did.
| Channel | Value | As of |
|---|---|---|
| Monthly SIP inflow into equity mutual funds | ₹31,961 crore | July 2026 |
| Total demat account base (NSDL + CDSL) | 21.0 crore (4.2 crore NSDL, 16.8 crore CDSL) | End-October 2025 |
Source: AMFI; SEBI data, via Business Standard.
One month of SIP buying in July 2026, ₹31,961 crore, is close to the size of foreign investors' entire net outflow for all of calendar 2018, ₹33,014 crore. What used to take a full year of foreign selling to move, a month of household savings now moves on its own.
The honest objection
The strongest case against the "net zero" framing is that 2025 and 2026 do not look like the decade's earlier swings. The combined outflow across those two stretches, ₹166,286 crore and ₹237,451 crore, is larger than any single prior down year, and unlike the reversals that followed 2018 and 2022, it has not turned yet. If it keeps running, foreign ownership could keep falling from an already 15-year low, and the decade's cancel-out arithmetic could end up reading less like noise and more like a snapshot taken mid-retreat.
That case deserves to be taken seriously. But it runs into the scale of the domestic river now sitting underneath it. Domestic institutional inflows of $166 billion over 22 months, or ₹8.5 lakh crore in FY2025-26 alone, are large enough on their own to keep absorbing sustained foreign selling without any net foreign money at all. The market did not have that capacity at the start of the decade, when mutual fund industry assets were less than a sixth of what they are now. Even if FII flows never turn positive again, the base now absorbing them has grown enough to keep the market functioning without them.
The Signal
The habit is to read every foreign-selling headline as news about the market's health. Mostly, it is not. Net foreign flows have been close to zero across this whole decade, an outflow of roughly ₹17,700 crore on a market that grew mutual fund assets six-fold to ₹85.76 lakh crore over the same span and now counts 21.0 crore demat accounts. Domestic money was never standing by as a backstop for a foreign-funded market. It was the market's engine for ten years running, and foreign capital was the part passing through. Watch the SIP number and the DII ownership share each month. That is where the market's actual foundation sits, whichever way the FII column runs.
Reporting basis: FPI/FII net equity flow figures for calendar years 2016 through 14 August 2026, the decade's cumulative net outflow, and the average annual gross swing are from the National Securities Depository Ltd's official yearwise FPI investment data. Domestic institutional investor and FPI ownership shares of the NSE-listed universe, and DII/FPI net-flow totals for FY2025-26, are from SEBI's FY2025-26 Annual Report. The Nifty 500 ownership shares and the trailing 22-month DII/FPI flow comparison are from a Motilal Oswal Financial Services report, as reported by Business Standard, and rest on that single origin. SIP and mutual fund industry AUM figures are AMFI's official data. India's demat account count is SEBI's monthly bulletin data, as reported by Business Standard/Capital Market. The Sensex's 2016-2025 level and its run of positive annual returns are Business Standard's year-end market data compilation. The decade's average annual gross flow and the SIP-to-2018-outflow comparison are The Signal's calculations from those figures.