An anchor investor exists to send a signal. Before an IPO opens to the public, a company sells a slice of the issue to hand-picked institutions at the offer price, locked in for 30 to 90 days. The pitch to everyone else is implicit: sophisticated money looked at this business ahead of the crowd and chose to hold it. That signal is part of why anchor books get built at all, and why bankers lean on them to justify pricing.
On August 13, 2026, SEBI's Department of Economic and Policy Analysis published a study that tracked what anchor investors actually did once the lock-in lifted, across 242 mainboard IPOs listed between April 2022 and October 2025. It is worth slowing down on the premise before the numbers. A lock-in period exists precisely because regulators assumed conviction needed enforcing. SEBI's study asked what happens the moment enforcement ends.
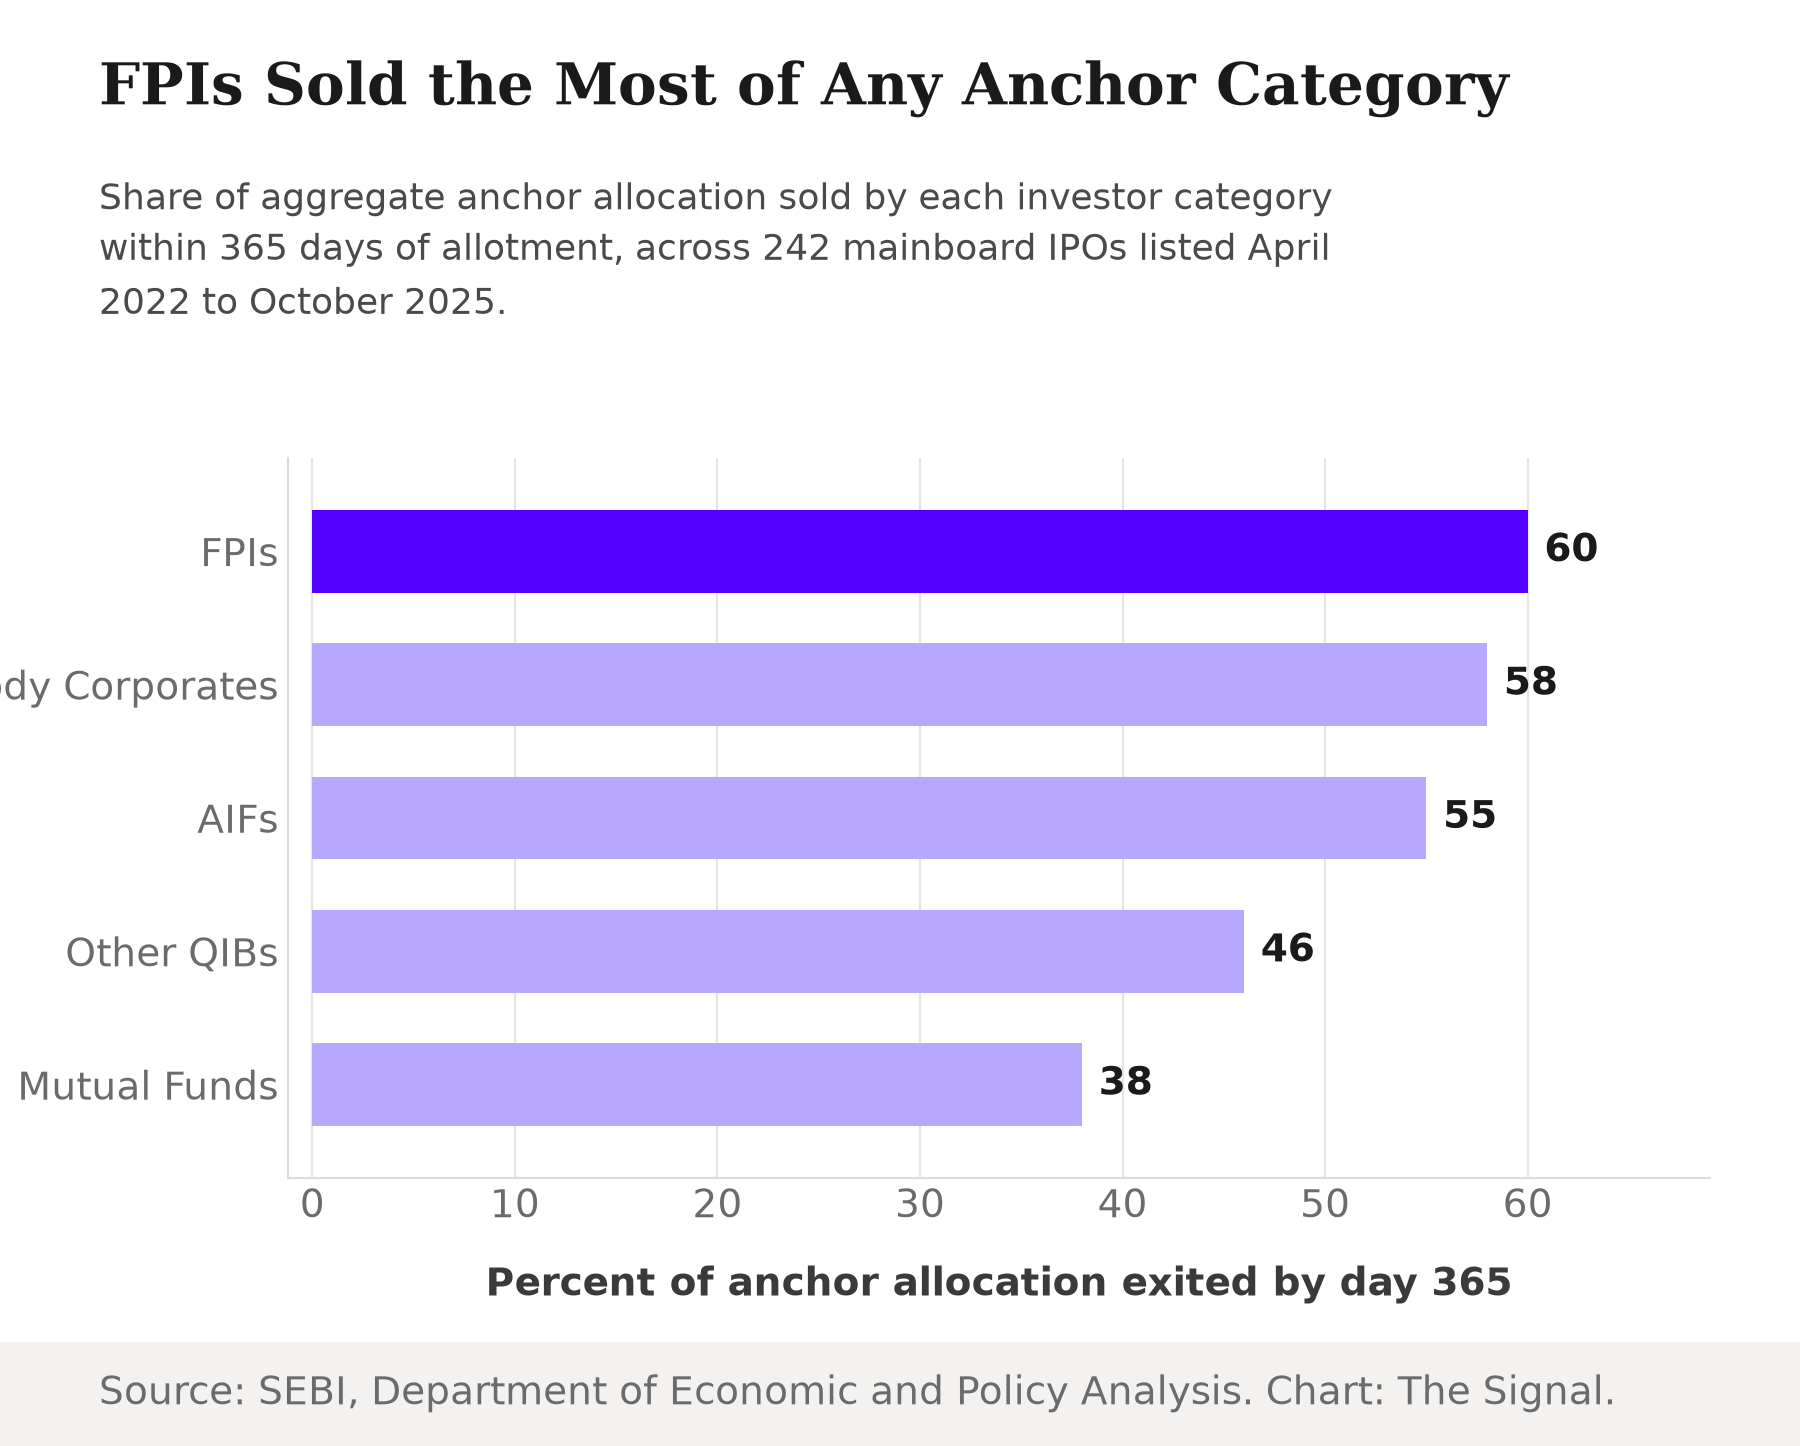
Foreign portfolio investors sold more of their anchor stake than any other category.
By 365 days after allotment, foreign portfolio investors (FPIs) had sold about 60% of their aggregate anchor allocation, the highest exit rate of any investor category tracked in the study. Mutual funds, the next-largest anchor buyer, sold the least of any category: 38%.
Source: SEBI, Department of Economic and Policy Analysis. Chart: The Signal.
Who actually fills the anchor book
FPIs are not a marginal player in this market being tracked for curiosity's sake. FPIs are the single largest category of anchor investors by allotment value, at 43.8%, followed by mutual funds at 38.5%; together the two account for over 82% of total anchor allotment value across the 242 IPOs studied.
FPIs and mutual funds together supply over four fifths of all anchor money.
| Investor category | Share of anchor allotment value |
|---|---|
| FPIs | 43.8% |
| Mutual funds | 38.5% |
| Other QIBs | 10.5% |
| AIFs | 5.3% |
| Body corporates | marginal |
Source: SEBI, Department of Economic and Policy Analysis.
That concentration is what makes the exit-rate gap matter: the two categories that supply most of the anchor book behave differently once the lock-in ends, and the larger of the two is the faster seller.
The unlock cascade
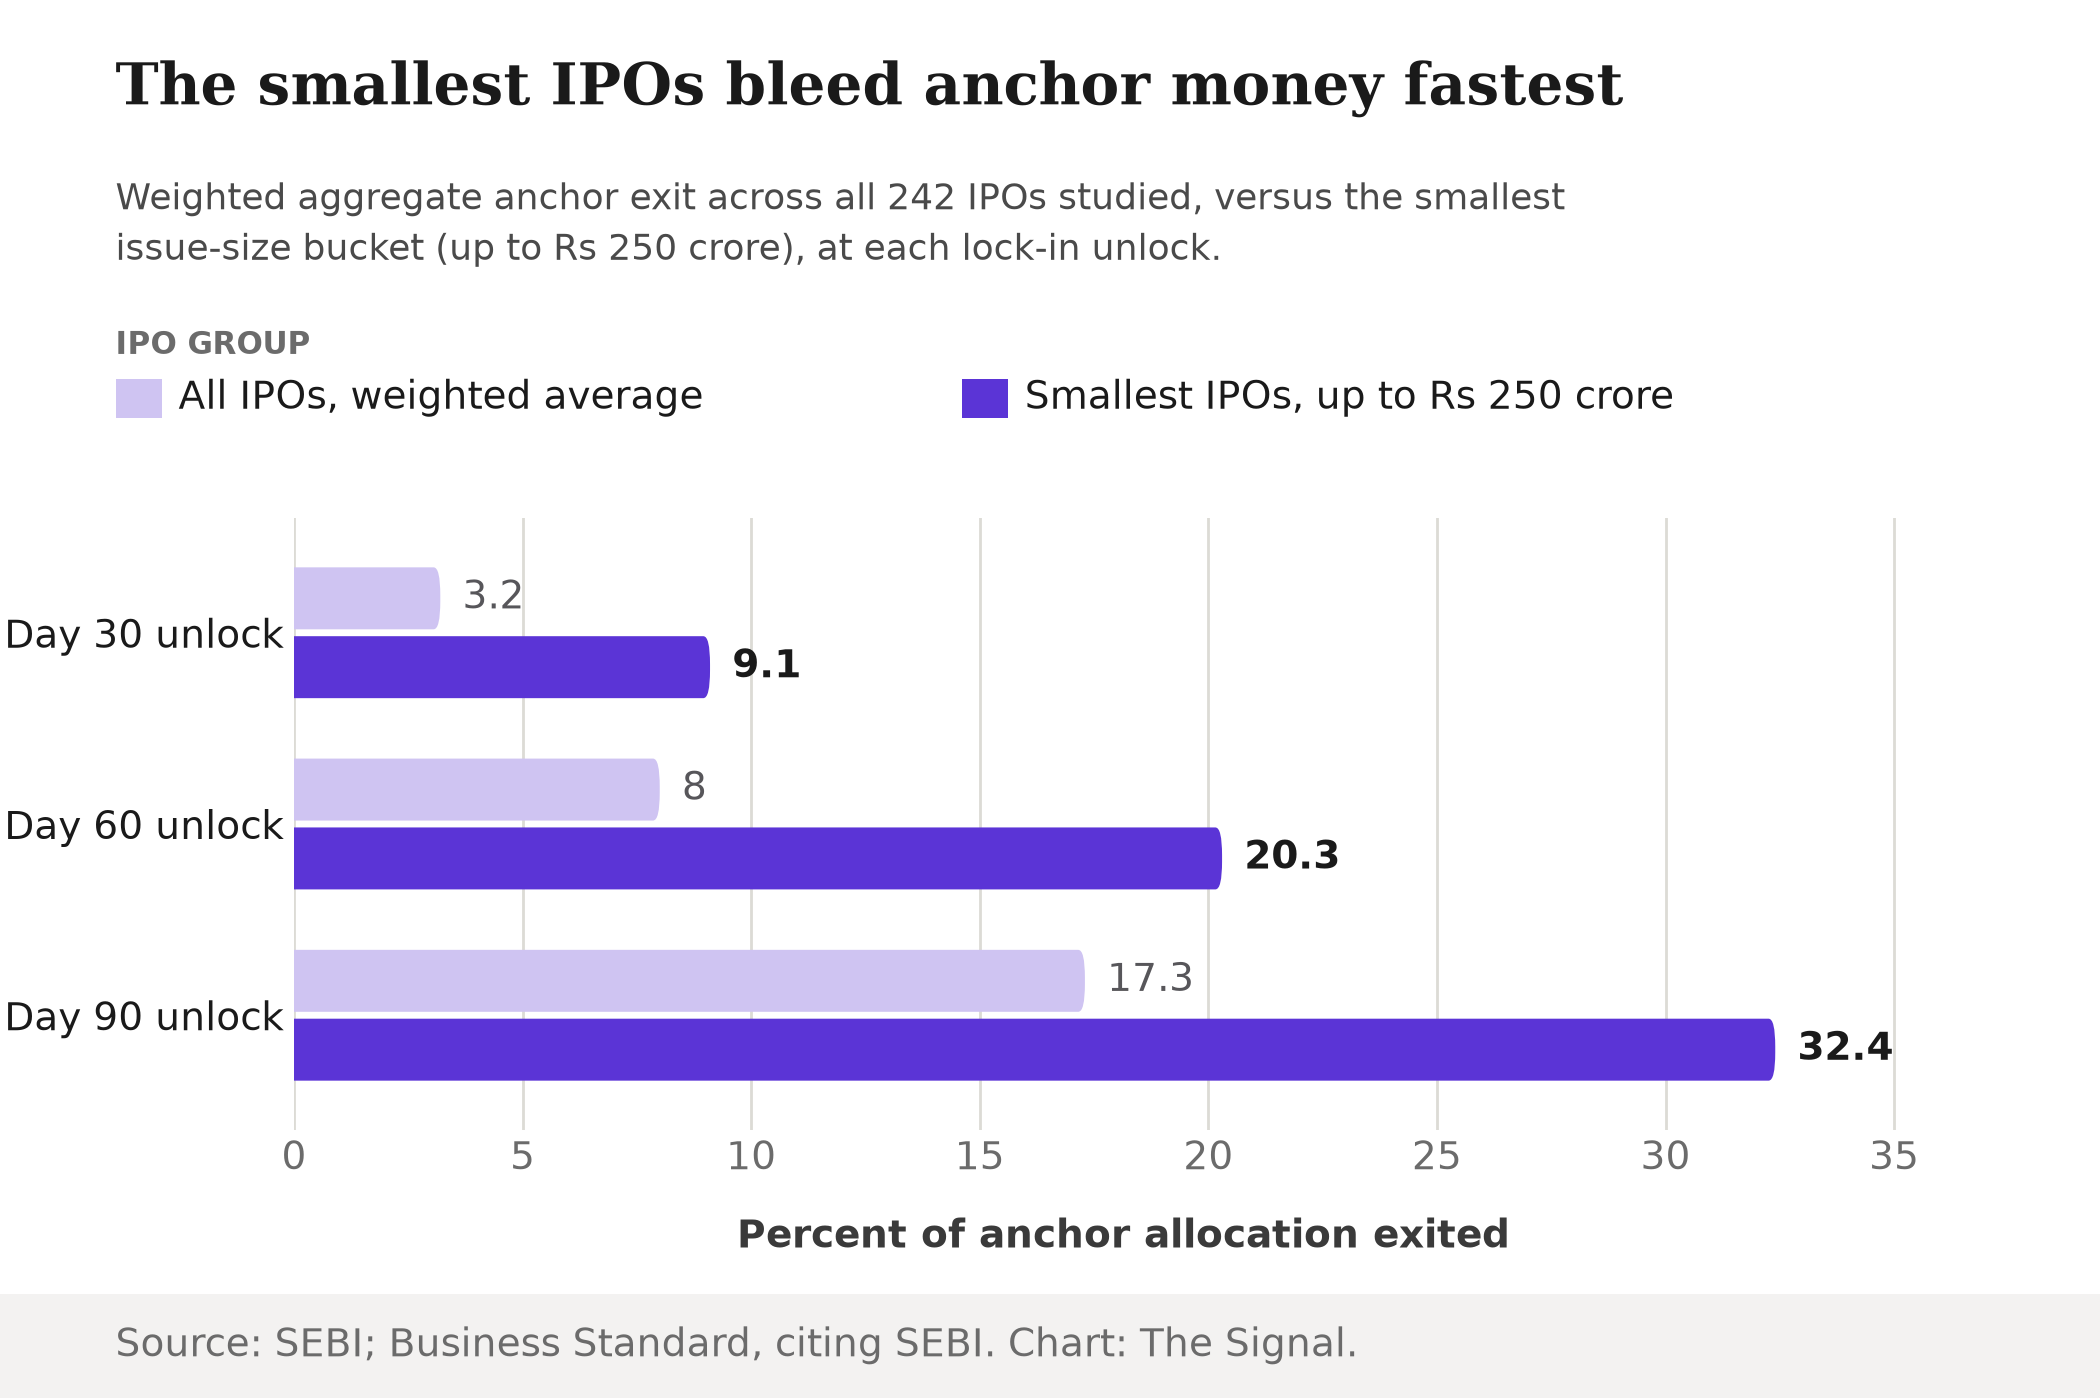
Anchor shares free up in stages: a first unlock around 30 days, a second around 90. Across all anchor investors combined, the weighted aggregate exit was just 3.2% right after the 30-day unlock, rising to about 8% by 60 days and 17.3% by the 90-day unlock. Read on its own, that looks restrained: most anchor money stays put through the first three months.
But restraint in the aggregate hides how widespread selling is. By the 90-day unlock, only one of the 242 IPOs studied showed zero anchor selling, meaning some anchor exit is close to universal across issues even though the amount sold stays modest for most. Nearly every anchor book leaks at least a little the moment it legally can. The 17.3% weighted average is not a story about a handful of aggressive sellers; it is a floor that almost every IPO's anchor book sits above.
FPIs pull ahead in both directions
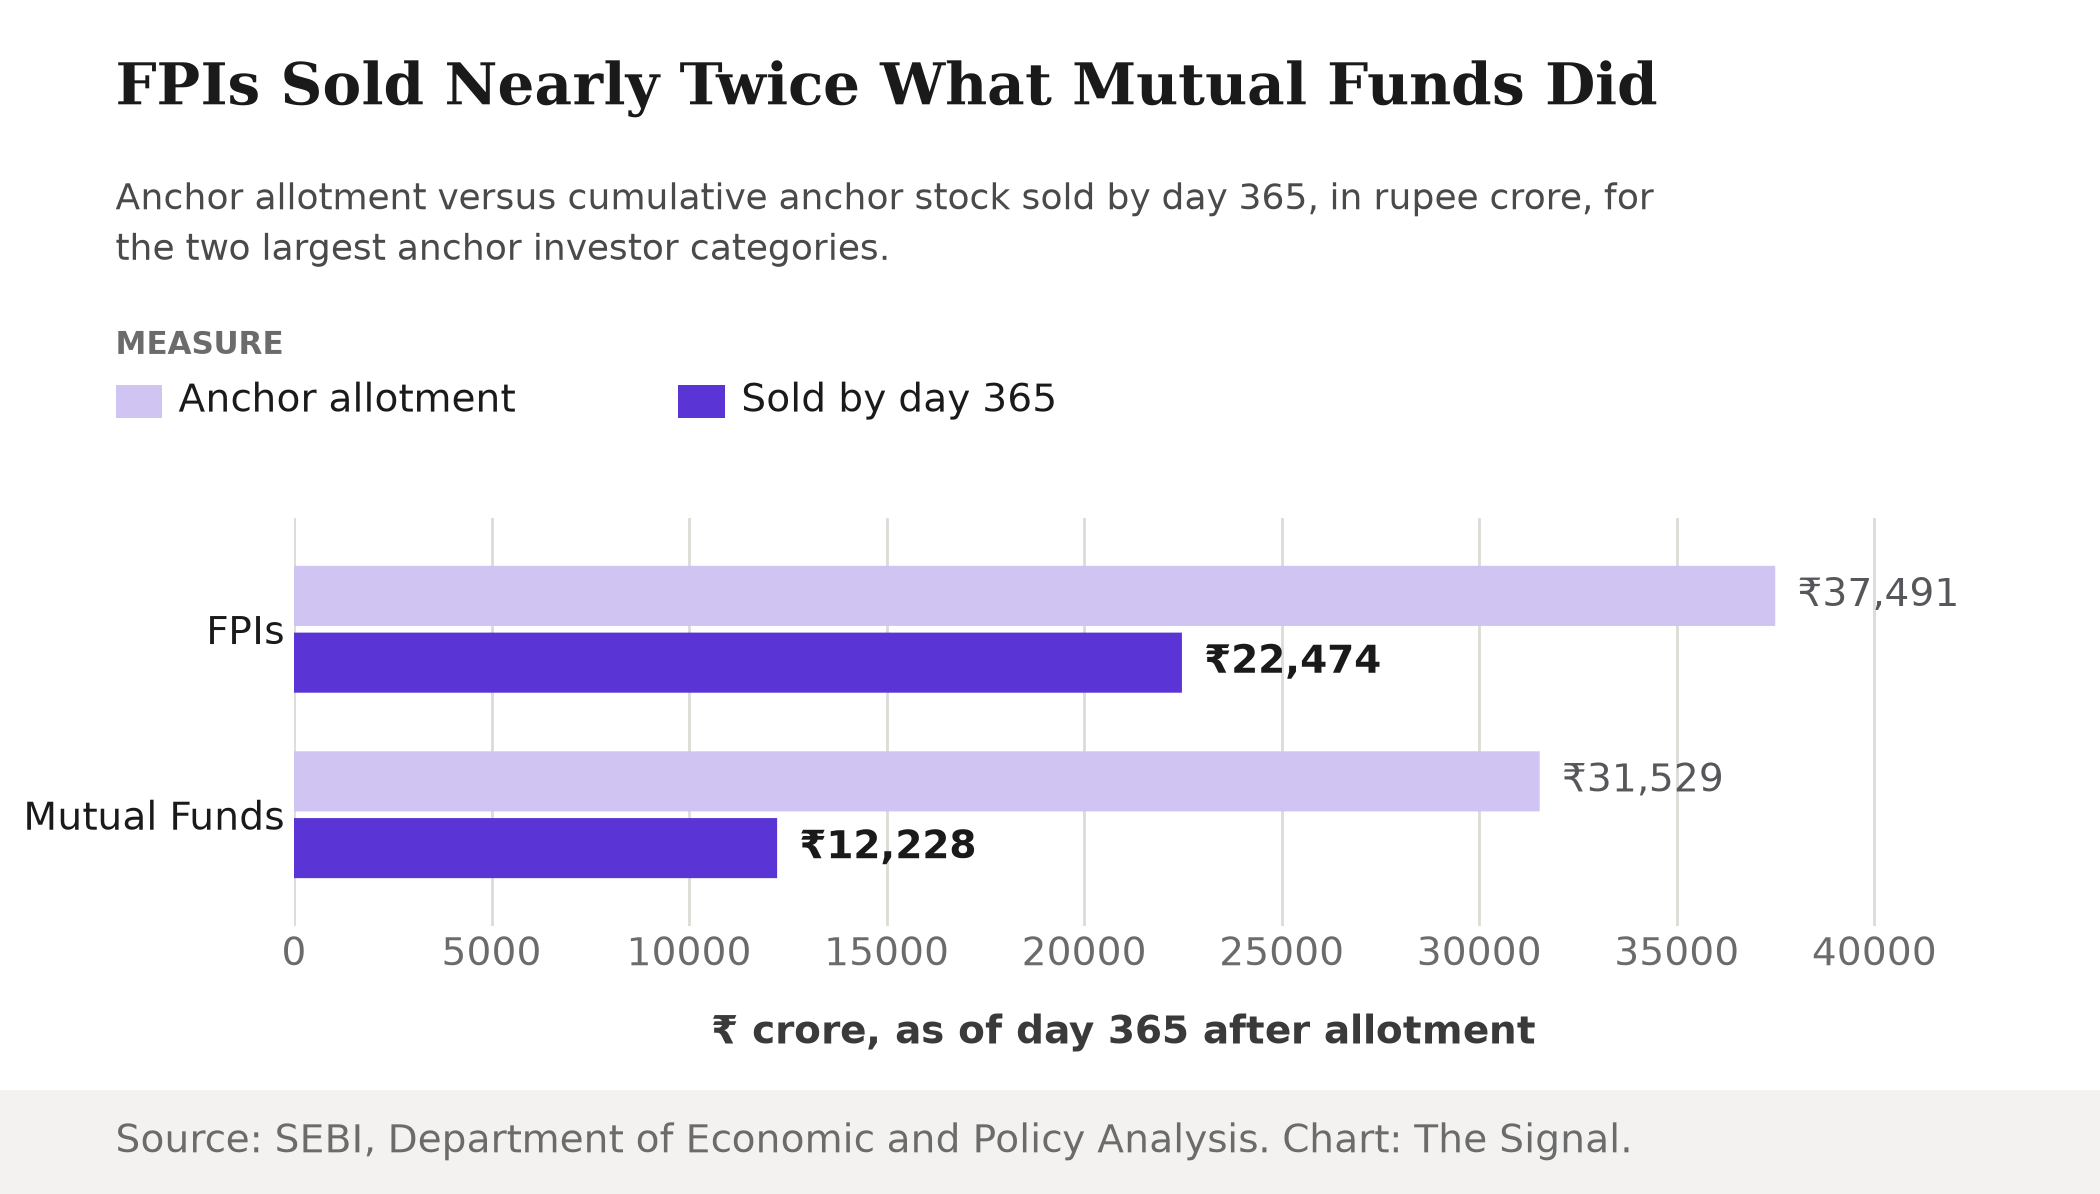
The category gap widens the longer the clock runs. On a weighted basis, FPIs had exited about 19.8% of their anchor allocation by the 90-day unlock versus 14.7% for mutual funds. SEBI's study says that gap means FPIs exited roughly 35% more of their allocation than mutual funds by that point. It shows up in rupee terms too: FPIs sold about ₹22,474 crore of their anchor holdings by 365 days, against a total FPI anchor allotment of ₹37,491 crore, nearly double the roughly ₹12,228 crore mutual funds sold.
Source: SEBI, Department of Economic and Policy Analysis. Chart: The Signal.
The lead holds even among the most aggressive sellers in the sample. Among IPOs where anchor investors sold more than 10% of their allocation in the first 30-day unlock window, FPIs were the single largest contributor, exiting 24.5% of their allocation on average, ahead of body corporates and other QIBs in that same high-selling subset. Wherever the study slices the data, the ranking does not change.
Small IPOs feel it first and worst
The anchor signal matters to a retail investor deciding whether to bid on an IPO too small to draw analyst coverage, and that is precisely the segment where anchor money empties out quickest.
The smallest IPOs lose anchor investors faster than the market average at every unlock.
Source: SEBI, Department of Economic and Policy Analysis. Chart: The Signal.
The gap does not close as the lock-in period lengthens. By 365 days, the smallest IPOs saw a 72.5% anchor exit rate, nearly double the 40.8% rate for IPOs in the ₹1,001-2,500 crore bracket. A retail investor reading "anchor investors participated" on a small-cap IPO's offer document is looking at the exact segment where that participation empties out fastest, both immediately after listing and over the full year that follows.
The honest objection
The strongest case against reading any of this as alarming is that a lock-in was never a promise of permanent conviction, only a temporary one. Institutional investors, FPIs included, run mandates that require rebalancing; selling once a legal restriction lifts is ordinary portfolio management, not a reversal of judgment. Mutual funds sold too, just less. And SEBI's own data shows the typical IPO's anchor book leaks only modestly: 171 of the 242 issues studied stayed under a 25% exit by the 90-day mark.
That case holds for the median IPO. It does not explain why the smallest issues, precisely where a retail investor has the fewest other signals to lean on, see a 365-day exit rate close to double the broader market's, on top of leading every unlock window from 30 days out. A lock-in expiring is not itself the story. What matters is that it expires fastest exactly where the anchor signal carries the most weight for the least-informed buyer.
A pattern larger than this one study
The 242 IPOs SEBI tracked are not the only anchor books that have cycled through lock-in. Separately, about $24 billion worth of shares from 108 listed companies were scheduled to come out of anchor lock-in between mid-December 2025 and the end of March 2026, a reminder of how large a single unlock window can run as India's IPO market has grown. That window closed months before SEBI published its findings. If FPIs exited it the way the study finds they exit anchor stakes generally, first and in the largest volume, the behaviour this study measured was still playing out in the market in real time, not confined to the 242 IPOs already tracked.
The Signal
SEBI is not alleging wrongdoing, and by its own numbers, the typical anchor book empties out slowly. But the study settles a question that used to rest on assumption: the investor category that supplies the biggest share of anchor money is also the one that pulls the biggest share of it back out, fastest, in both percentage and rupee terms. And the IPOs where that matters to an ordinary investor's decision, the small, thinly covered ones, are exactly where the exit runs sharpest. An anchor is supposed to hold something in place. What SEBI's numbers describe looks more like a deposit: money that shows up early and leaves first.
Reporting basis: the anchor-exit methodology, the by-category and by-issue-size exit rates, the allotment-value shares, the near-universal-exit finding, the FPI-versus-mutual-fund intensity comparison, the high-selling subset and the rupee-value figures are all from SEBI's Department of Economic and Policy Analysis study on anchor investor exit behaviour in mainboard IPOs, published August 13, 2026. The weighted aggregate exit-by-unlock figures are as reported by Business Standard, citing that same SEBI study, and the forward-looking anchor-unlock pipeline figure is as reported by Business Standard, citing a Nuvama Institutional Equities analysis. Every comparison stated here, including that FPIs exited roughly a third more of their allocation than mutual funds and that the smallest IPOs' 365-day exit rate ran close to double the mid-size bracket's, is as computed and stated in SEBI's own study, not a calculation performed by The Signal.