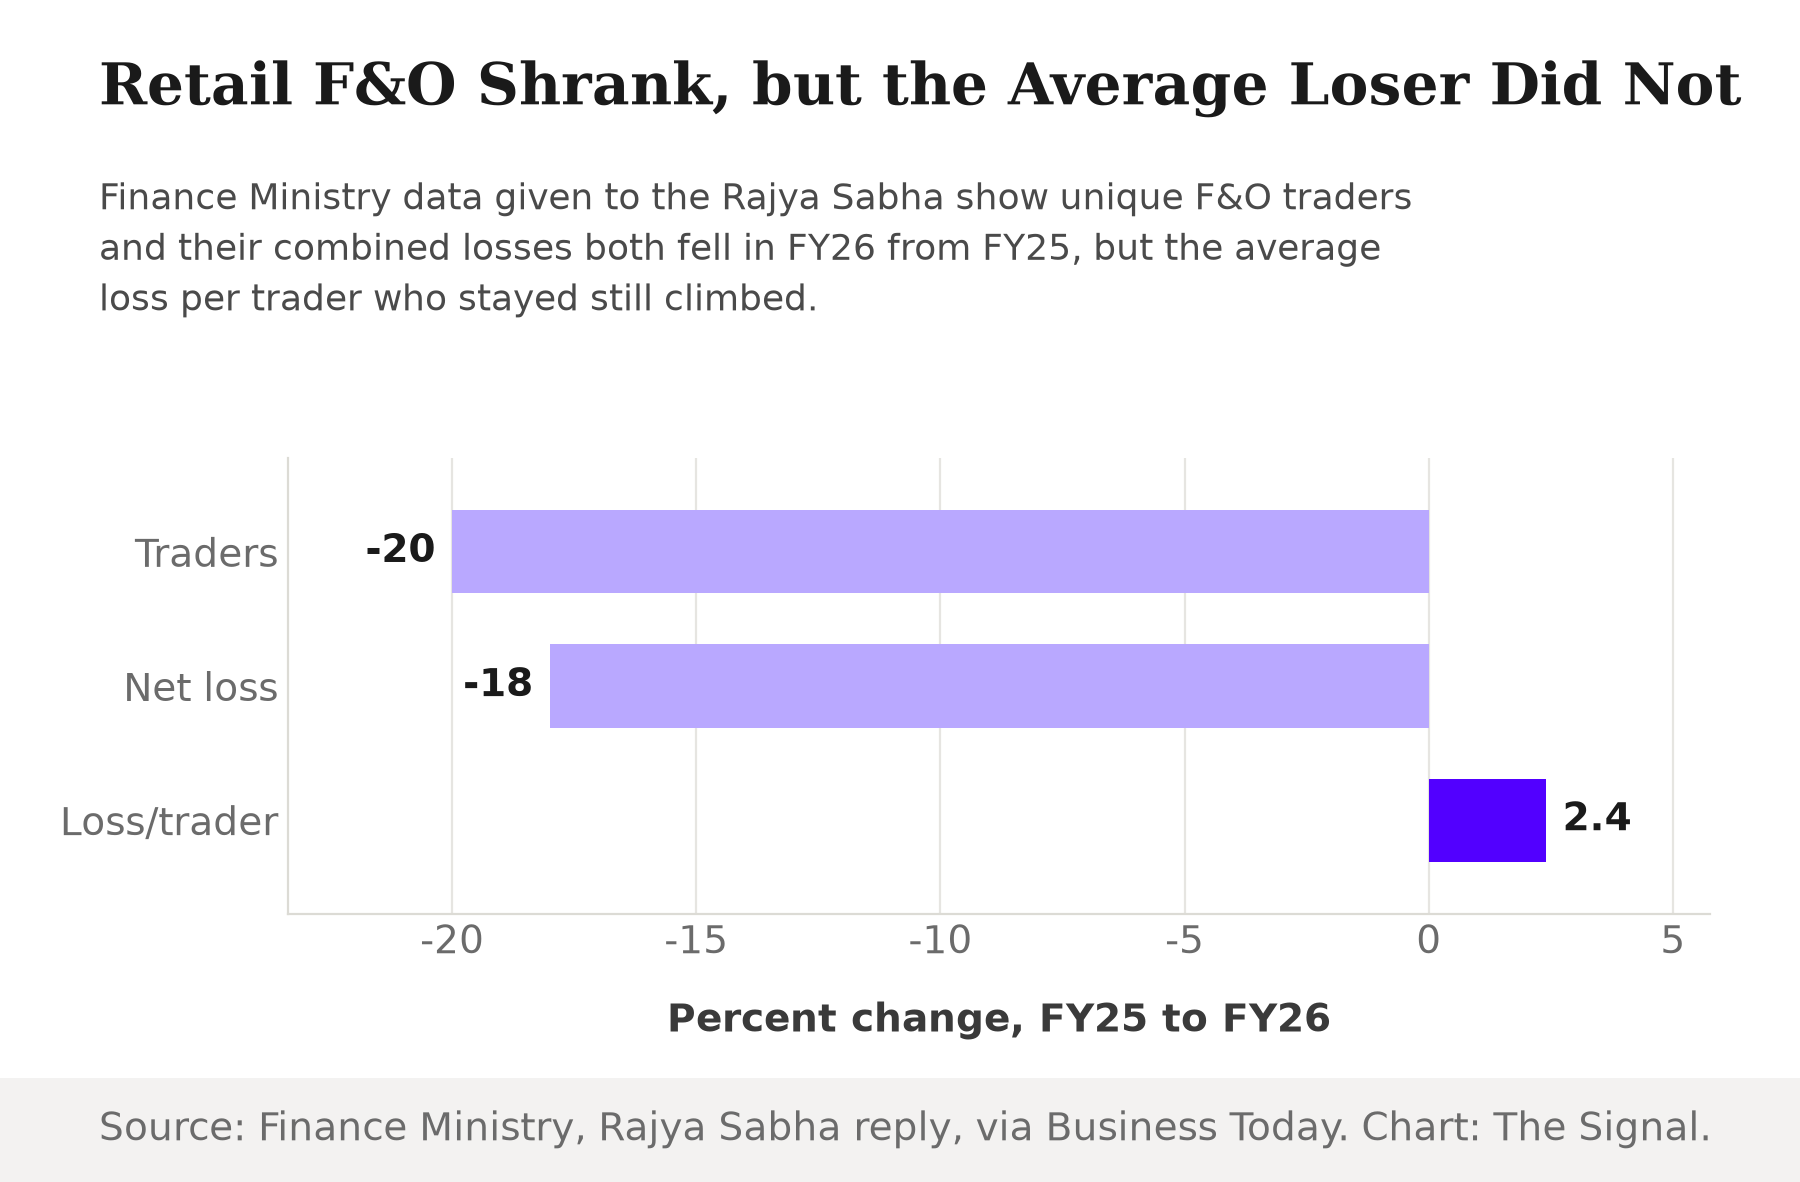
On August 11, 2026, the government told Parliament that its clampdown on retail derivatives trading is working. The number of unique individual traders in India's futures and options segment fell about 20 percent to 78.6 lakh in FY26 from 98.1 lakh in FY25, while their combined net loss fell 18 percent to Rs 91,685 crore from Rs 1,11,788 crore, Minister of State for Finance Pankaj Chaudhary said in a written reply to the Rajya Sabha. Read only those two numbers and the regulator's index-derivatives curbs look like a clean success: fewer people trading, and less money lost overall.
It is worth slowing down on that. The average loss per trader who kept trading rose to Rs 1,16,654 in FY26 from Rs 1,13,913 in FY25, a rise of about 2.4 percent. A fifth of the retail trader base left the segment, and the trader who stayed is, on average, slightly worse off than a year earlier. The reform did not make individual retail trading safer. It made the pool of people exposed to it smaller.
| Metric | FY25 | FY26 | Change |
|---|---|---|---|
| Unique individual F&O traders | 98.1 lakh | 78.6 lakh | -20% |
| Aggregate net loss | Rs 1,11,788 crore | Rs 91,685 crore | -18% |
| Average loss per trader | Rs 1,13,913 | Rs 1,16,654 | +2% |
| Total equity derivatives turnover | Rs 213 lakh crore | Rs 202 lakh crore | -5% |
Source: Ministry of Finance reply to the Rajya Sabha, via Business Today and via IANS.
What the reform actually did
The curbs behind these numbers were not a ban. A SEBI circular from October 2024 raised the minimum value of a new index derivatives contract from the Rs 5-10 lakh band set in 2015 to Rs 15-20 lakh, effective for new contracts from November 20, 2024. The same circular layered on three more changes: upfront collection of options premiums from buyers starting February 1, 2025, a cut to a single weekly-expiry benchmark index per exchange from November 20, 2024, and intraday position-limit monitoring from April 1, 2025. Every one of those changes raises the rupee amount a trader needs to put up to take a single position. None of them changes what happens once that trader is in the trade.
That distinction matters, because it predicts exactly the pattern the government reported: a smaller base, not a safer one. Larger lot sizes and margin requirements price out the trader with little capital to risk. They do nothing to the odds a trader faces once they have cleared that higher bar.
The mechanism, visible within a single year
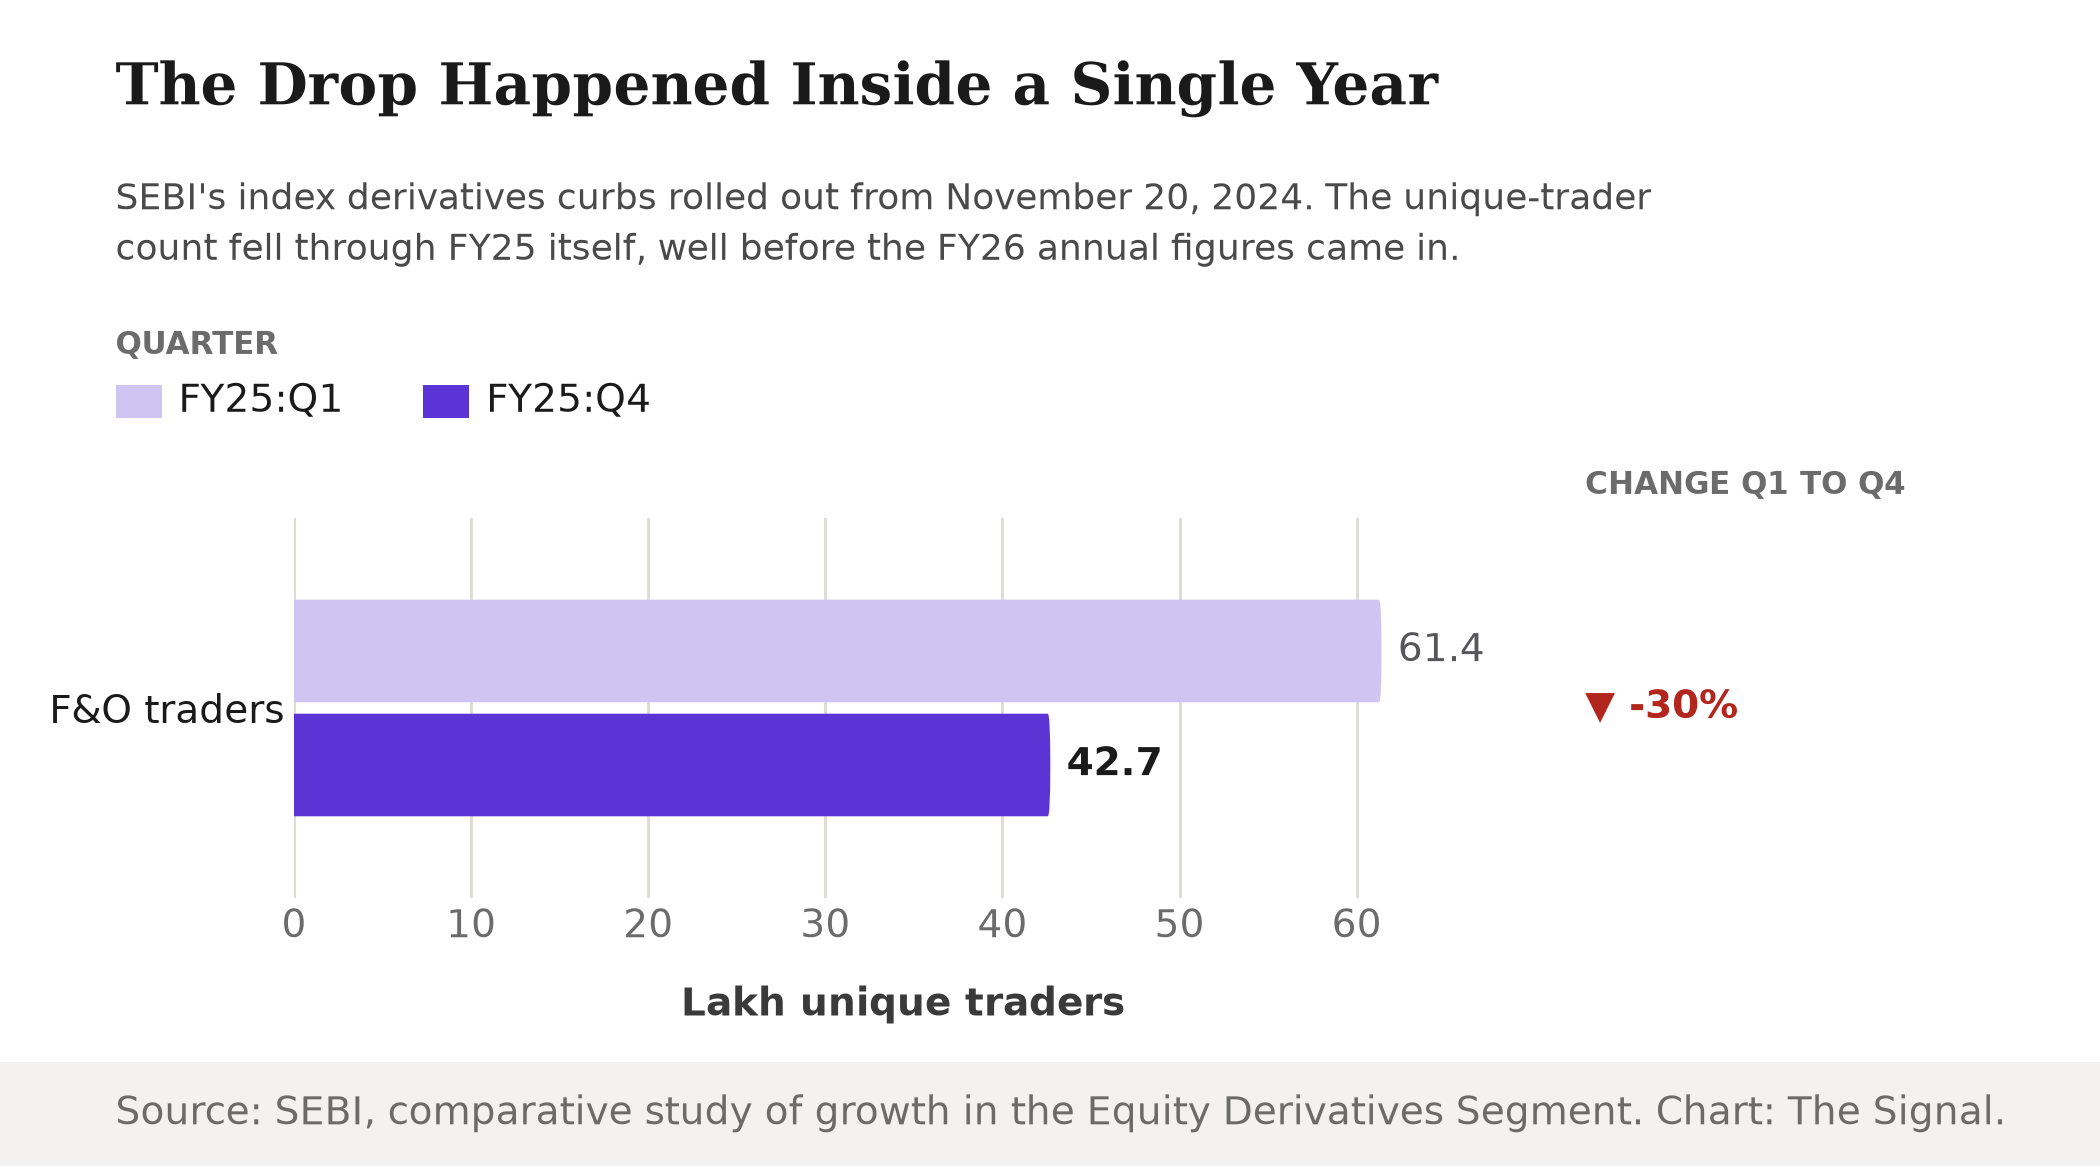
The clearest evidence for that mechanism does not come from the FY25-to-FY26 comparison. It comes from inside FY25 itself, the year the curbs actually rolled out. SEBI's own comparative study of the Equity Derivatives Segment found the number of unique individual traders fell from 61.4 lakh in the first quarter of FY25 to 42.7 lakh in the fourth quarter, a 30 percent drop in nine months, timed to when the measures took effect.
Source: SEBI, Study on Growth and Trends in the Equity Derivatives Segment. Chart: The Signal.
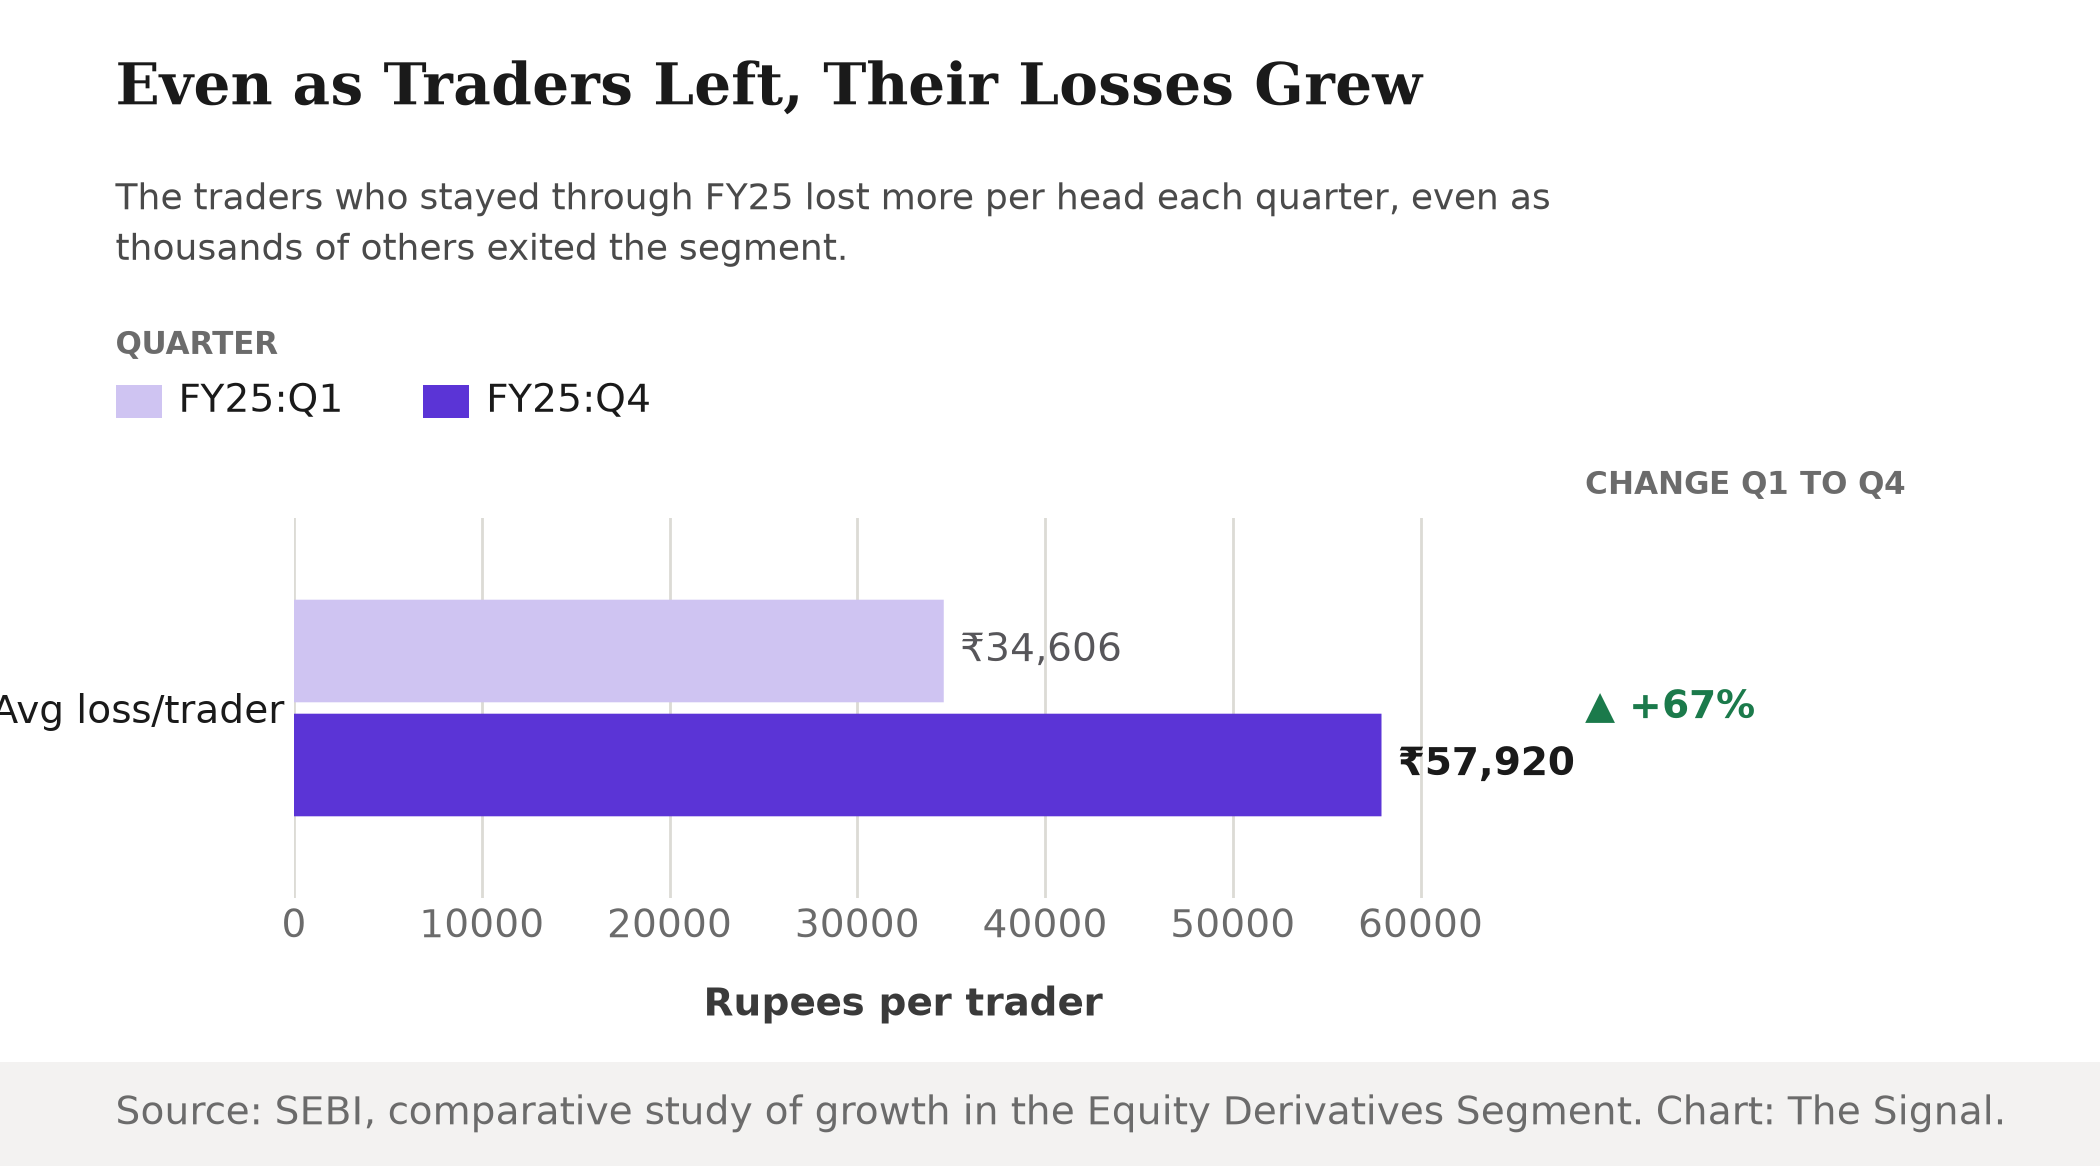
Over the same nine months, the average net loss per trader rose from Rs 34,606 in the first quarter to Rs 57,920 in the fourth, a 67 percent increase, a far sharper move than anything visible in the FY25-versus-FY26 annual figures. That was not a two-point jump between endpoints. The average loss per trader climbed for three straight quarters, reaching Rs 62,975 in the third quarter, before easing slightly to Rs 57,920 in the fourth: a steady rise through FY25, not a single outlier quarter. The same SEBI study also found the sharpest decline in headcount among traders with total turnover under Rs 1 lakh, the smallest-ticket segment, even as larger-turnover brackets shrank far less. That is the price-out effect stated in the regulator's own data: the traders leaving first were the ones with the least capital, not the ones taking the largest risks.
Source: SEBI, Study on Growth and Trends in the Equity Derivatives Segment. Chart: The Signal.
Why SEBI was acting on this at all
The scale of what the regulator was reacting to helps explain why it reached for a blunt, capital-based lever rather than a more targeted one. SEBI's own baseline study found the retail F&O trader base, sampled from the top 10 brokers, had grown more than 500 percent, to 45.2 lakh in FY22 from 7.1 lakh in FY19. Nine out of ten of those traders, 89 percent, lost money in FY22, with loss-makers losing an average of Rs 1.1 lakh each. A market that had grown fivefold in three years, with nine in ten participants losing money, is not a market a regulator can wait out. Raising the price of entry was the tool at hand. It was never going to change the odds inside the trade, only who could afford to sit down at the table.
The honest objection
The strongest case for the reform is that it hit its own stated target. Retail India's combined F&O losses fell 18 percent in FY26, real money that households did not lose. A 2.4 percent rise in the average loss per trader is small next to that, and could plausibly reflect nothing more than bigger lot sizes mechanically inflating the rupee value of each position, not a genuine increase in risk per trader. On that reading, SEBI simply reduced the number of Indians exposed to a game most of them were losing anyway, which is itself worth something.
That case is real, but it understates two things the data also shows. First, total equity derivatives turnover, across all participants, fell only to Rs 202 lakh crore in FY26 from Rs 213 lakh crore, a much shallower decline than the 20 percent drop in unique retail traders over the same period, meaning market activity held up far better than the retail base that supposedly shrank alongside it. Second, the 2.4 percent annual rise in average loss looks tame only next to the annual headline; the 67 percent jump inside FY25 itself, in the exact quarters the curbs rolled out, is not a rounding effect of bigger lot sizes. It is the same trader, trading a position sized to the new rules, still losing, and losing more.
The Signal
SEBI set out to shrink a market where nine in ten retail participants were losing money, and by its own headline numbers, it has: fewer traders, less money lost in aggregate. What it has not done is change the arithmetic facing any individual who clears the new, higher bar to enter. The reform filtered the field. It did not fix the game. Watch the FY27 figures for the same pairing: if the average loss per trader keeps climbing even as the base keeps shrinking, the curbs will have done what a higher membership fee does to a casino floor, thinning the crowd without touching the odds.
Reporting basis: the FY26 retail F&O participation and loss figures, and the FY25-to-FY26 turnover figure, are from Minister of State for Finance Pankaj Chaudhary's August 11, 2026 written reply to the Rajya Sabha, as reported by Business Today and, on the turnover figure, IANS. The FY25 quarterly trader figures, and the FY19-to-FY22 baseline growth and loss-maker figures, are from two SEBI studies of the Equity Derivatives Segment; the FY25 quarterly loss figures are from that same comparative SEBI work, with the third-quarter figure via Value Research's telling of it. The terms of the October 2024 reform are from SEBI's own circular. The FY25-to-FY26 and FY25 quarterly percent changes are The Signal's calculations from those primary figures.