India just posted its strongest growth print in years. MoSPI's provisional estimates show real GDP grew 7.7 percent in FY 2025-26, up from 7.1 percent in FY 2024-25, released June 5, 2026. On the usual reading, that number should be doing real work for the rupee: faster growth means more foreign capital chasing Indian assets, more dollars converted into rupees to buy them, and a currency that holds its ground or gains.
It is worth slowing down on that. The rupee closed at 95.2470 to the dollar on July 3, 2026, having depreciated 11.12 percent over the trailing twelve months, the same stretch in which the economy grew 7.7 percent. Growth accelerated. The currency did not follow.
The rupee fell 11.12 percent in the same year the economy grew 7.7 percent.
Line the two figures up and the disconnect is immediate.
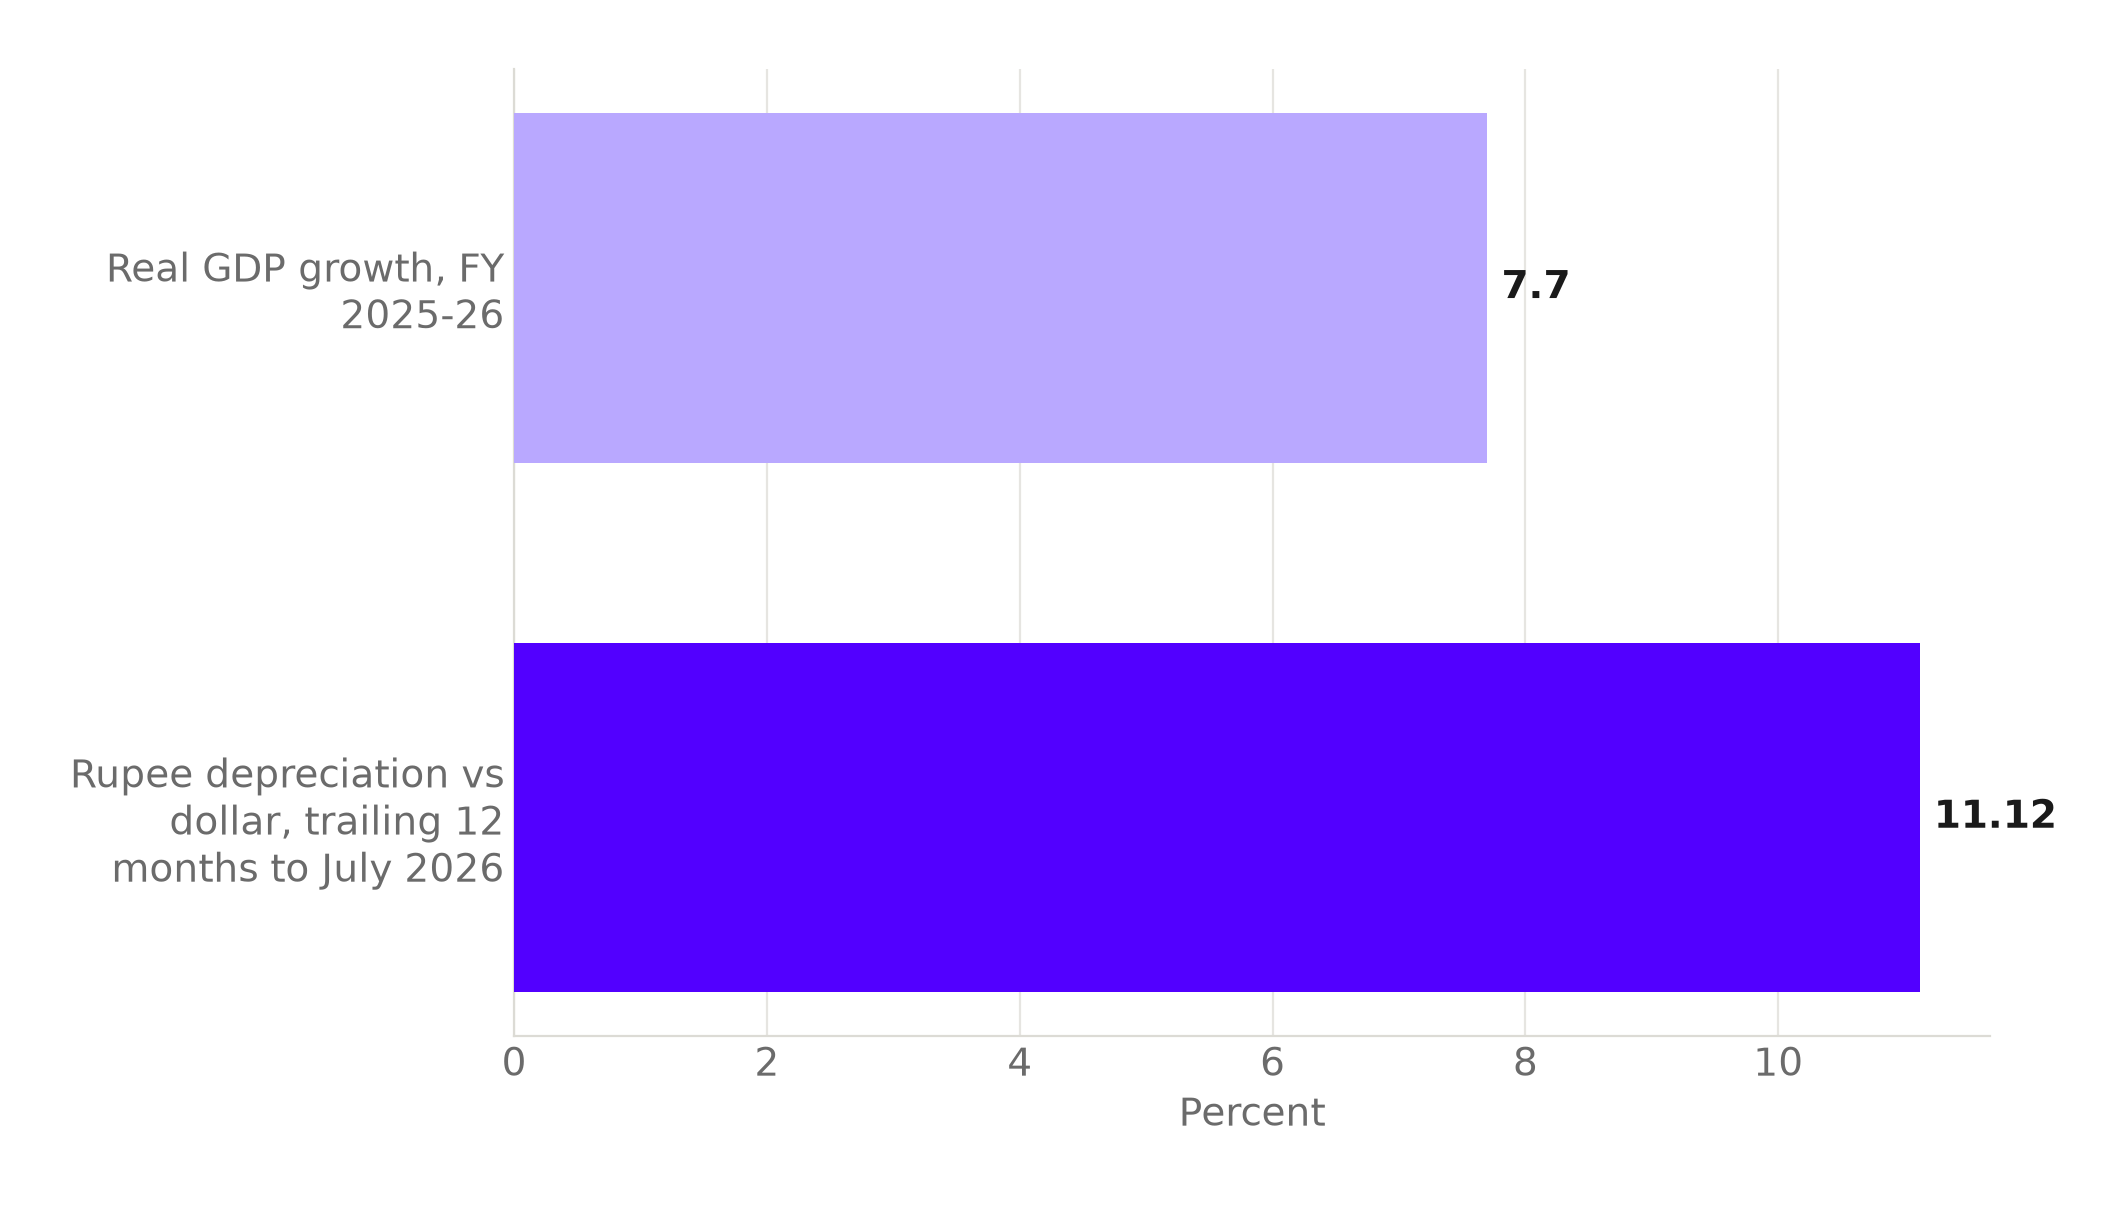
Source: MoSPI; Trading Economics. Chart: The Signal.
It is not a broad emerging-market move
The easy explanation for an emerging-market currency losing more than a tenth of its value in a year is a broadly strong dollar dragging every EM currency down together. Checking that against three other large emerging markets does not support it. The Indonesian rupiah depreciated 10.99 percent against the dollar over the same trailing twelve months, a decline close to the rupee's own. But the Brazilian real appreciated 4.42 percent against the dollar over the same period, the South African rand appreciated 7.73 percent, and the Mexican peso appreciated 6.33 percent.
Three of four large emerging-market currencies gained ground against the dollar in the same year the rupee fell 11.12 percent.
That rules out the simplest explanation. Whatever is pulling the rupee down, it is not a broad dollar wave lifting the greenback against emerging markets generally. It is a rupee-specific move, which is exactly why growth, the forecast, and the external accounts are the places to look for an answer.
The forecast is being cut, not raised
If the growth print were genuinely reassuring policymakers about India's trajectory, the next move would be to raise forward guidance. It went the other way. At its June 2026 review, the RBI's Monetary Policy Committee cut its FY 2026-27 real GDP growth forecast to 6.6 percent from 6.9 percent, even though the FY26 actual print had just come in at 7.7 percent. The central bank that sets rates on the rupee is telling markets that the strongest year is behind, not ahead.
That forecast is not an outlier. The World Bank's April 2026 update projects India's growth at 6.6 percent for FY27, while noting India remains among the world's fastest-growing major economies even as the pace slows. Two independent forecasters, one domestic and one multilateral, land on the identical 6.6 percent figure for the year ahead, a full 1.1 percentage points below the growth print just reported.
Two forecasters agree: next year's growth lands a full point below this year's print.
The RBI and the World Bank were built on different mandates and different data pipelines. Landing on the same 6.6 percent figure is a signal that the deceleration is read the same way from inside the system and from outside it.
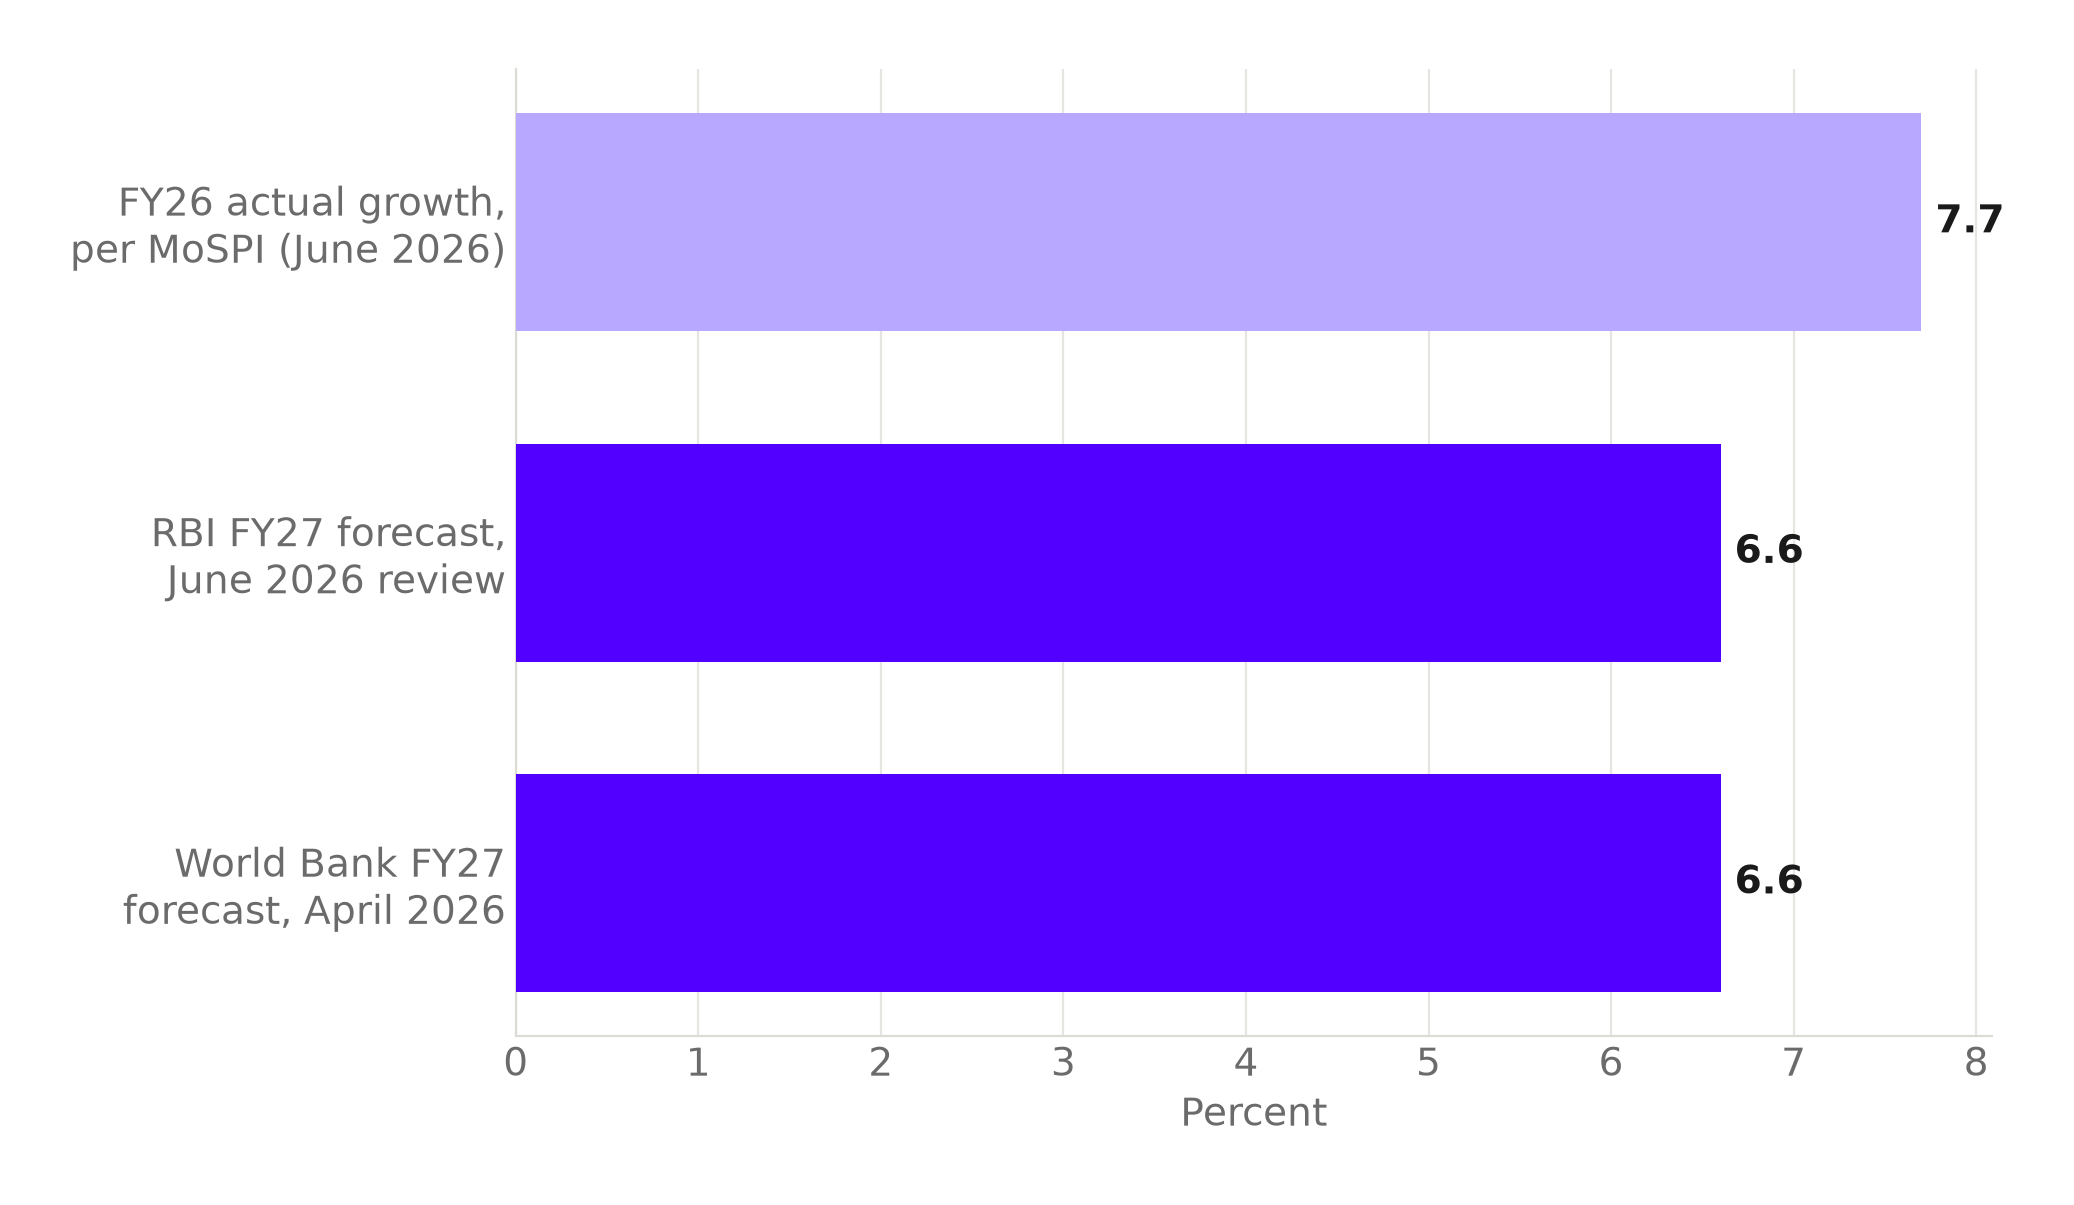
Source: Akashvani, DD News; The World Bank. Chart: The Signal.
A currency prices the path ahead, not the quarter just closed. If the outlook itself already undercuts the number everyone is celebrating, a trader has no obvious reason to bid the rupee up on that number alone.
The external accounts turned, then didn't hold
Growth alone was never going to carry the rupee. What carries a currency day to day is the balance of dollars flowing in against dollars flowing out, and that balance has been uneven. Trading Economics data show India's current account swung to a $7.1 billion surplus, 0.7 percent of GDP, in the fourth quarter of FY26, a genuine quarterly improvement. But the deficit for the full 2026 fiscal year still widened to $25.2 billion, 0.6 percent of GDP: one strong quarter sitting inside a year that, on net, still ran short of dollars.
Reserves moved the same direction in real time. India's foreign exchange reserves fell to $666.93 billion in the week ended June 26, 2026, down from $672.59 billion a week earlier, a decline of $5.66 billion in a single week.
Reserves fell $5.66 billion in the week before the rupee's July 3 close.
| Metric | Figure | Period |
|---|---|---|
| Real GDP growth | 7.7% | FY 2025-26 |
| Rupee vs. dollar | 95.2470, down 11.12% | Trailing 12 months to July 3, 2026 |
| Current account | $7.1bn surplus (0.7% of GDP) | Q4 FY26 |
| Current account, full year | $25.2bn deficit (0.6% of GDP) | FY 2025-26 |
| Foreign exchange reserves | $666.93bn, down $5.66bn | Week ended June 26, 2026 |
Source: MoSPI; Trading Economics.
A one-week reserves move is noise on its own. It matters here because it lines up with the forecast downgrade and the currency slide, not against them.
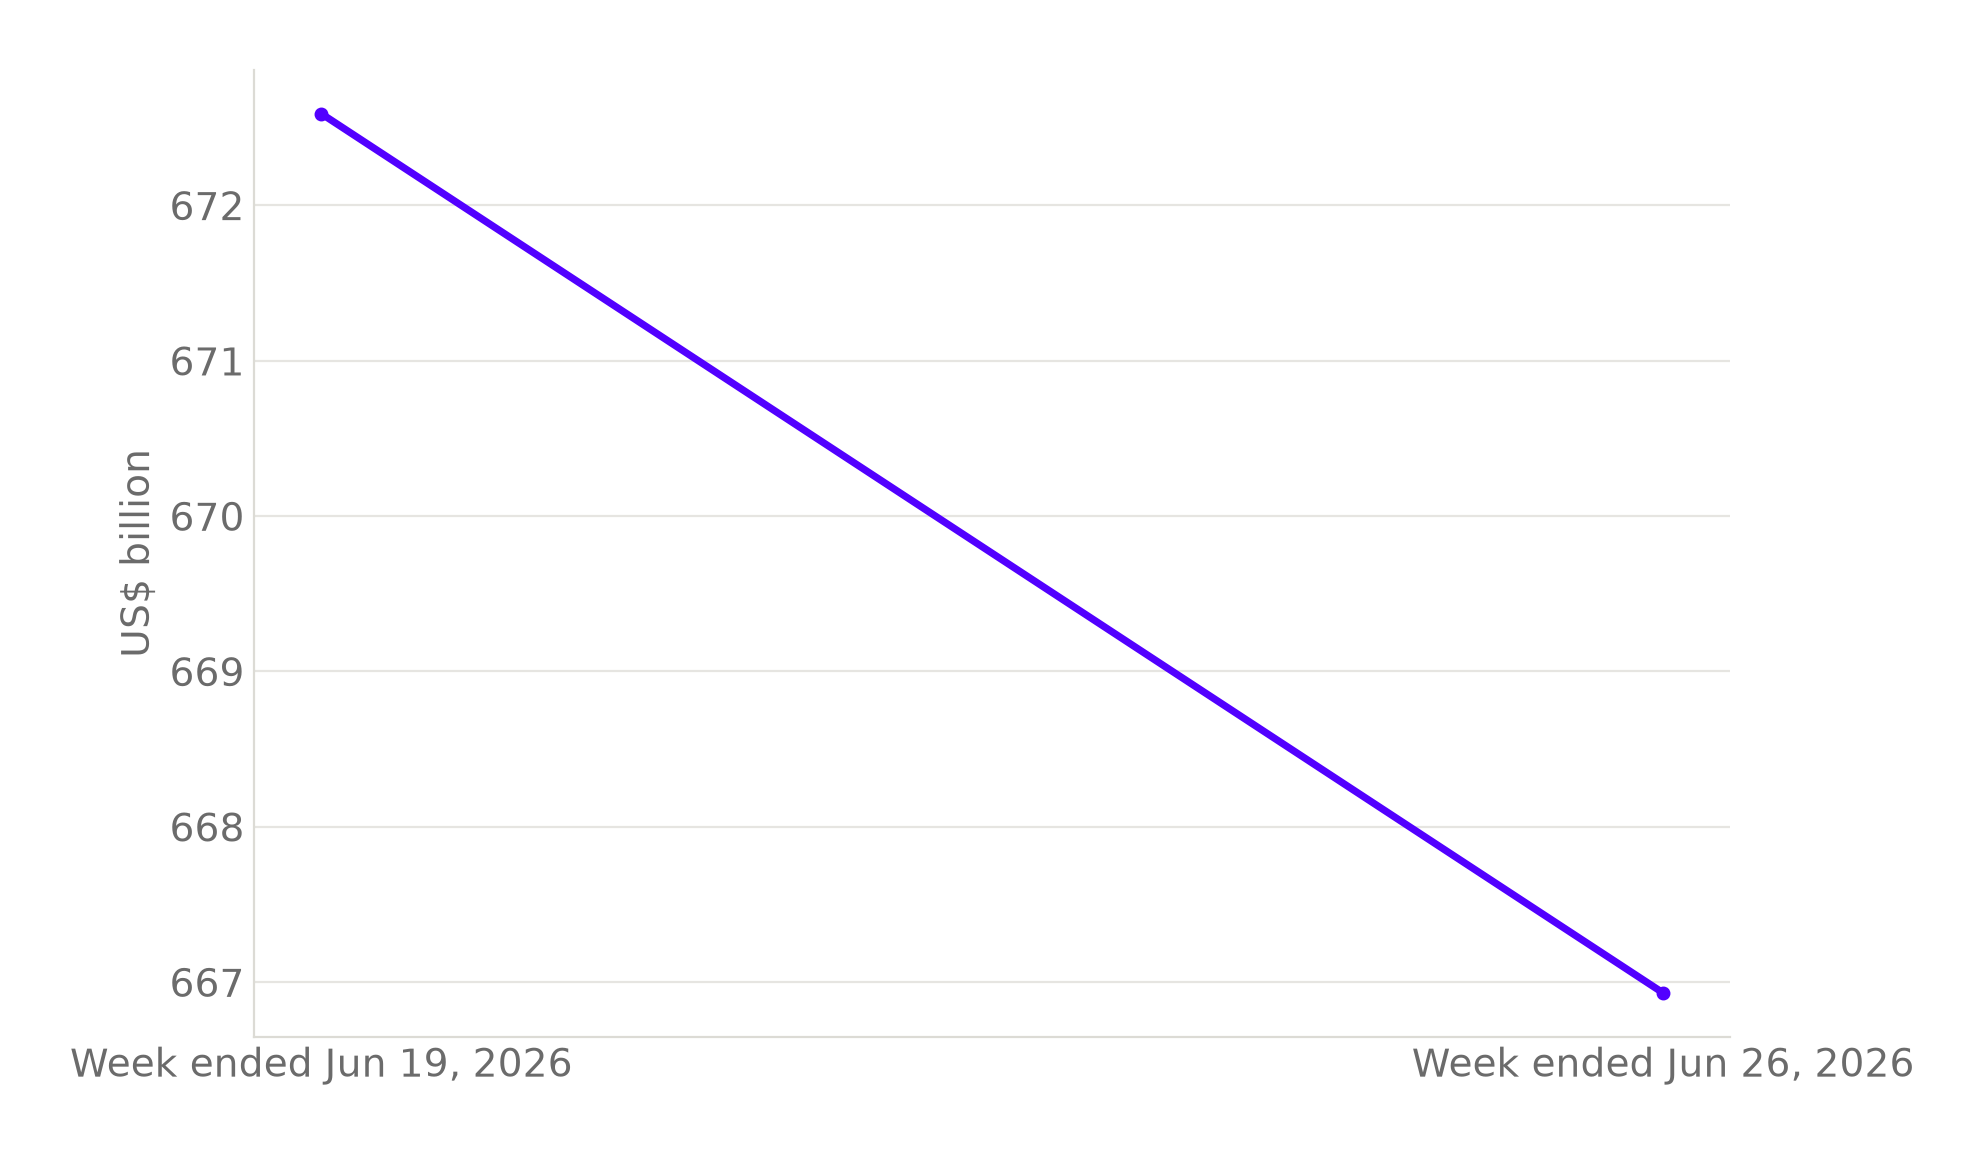
Source: Trading Economics. Chart: The Signal.
The RBI is already paying for dollars
The clearest evidence that the central bank sees this as more than noise is what it built before the numbers above were even published. A Reserve Bank of India circular shows the RBI opened a US Dollar-Rupee swap facility on June 8, 2026, under which banks can sell dollars in multiples of $1 million to the RBI from fresh three-to-five-year FCNR(B) deposits, and simultaneously agree to buy back the same dollars at the end of the swap period.
Strip the mechanics down and the intent is plain: the RBI is offering banks a guaranteed channel to bring in fresh foreign-currency deposits and hand the dollars to the central bank now, in exchange for getting them back later. That is a tool for pulling dollar inflows forward, not a routine liquidity operation. A central bank does not build a dedicated swap window to attract deposits into a currency it considers safely priced.
The honest objection
The strongest case against reading this as a warning sign is that India is not remotely in a currency crisis. Reserves of $666.93 billion, even after the latest weekly dip, remain enormous by any historical India standard, and the World Bank itself says India remains among the fastest-growing major economies in the world even with the slowdown. The current account's swing to a $7.1 billion quarterly surplus in Q4 FY26 is also a real data point in the other direction, not a cherry-picked one: on a quarterly basis, the external position was improving even as the rupee kept sliding.
That case sets a floor. It falls short as an explanation. It answers "is India in trouble" with a fair no. What it leaves unanswered is why the same 7.7 percent growth print, a positive quarterly current account swing, and $666.93 billion of reserves together were not enough to stop an 11.12 percent slide in the currency over the same year, and why the RBI would still build a dedicated dollar-swap channel if the ordinary flow of growth-driven capital were doing the job. A currency does not need a country to be in crisis to fall; it needs the marginal dollar buyer to be less convinced than the growth number implies.
The Signal
The story here is not that India's economy is weak. Every figure in the growth print says otherwise. The story is that growth and currency strength have become two separate variables, and the RBI's own actions, the forecast cut and the swap window, are the clearest evidence that the central bank agrees. Watch what happens next to the swap facility's usage and to the FY27 growth prints against that 6.6 percent bar the RBI has now set. If growth comes in above that bar again and the rupee still cannot hold ground, the gap stops looking like a one-year anomaly and starts looking like the new baseline relationship between India's economy and its currency.
Reporting basis: India's FY 2025-26 GDP growth figure is from MoSPI's provisional estimates, published via the ministry's own release. The RBI's FY 2026-27 growth forecast and repo decision are as reported by Akashvani (DD News), Prasar Bharati, from the Monetary Policy Committee's June 2026 statement. The World Bank's FY27 growth forecast and its assessment of India's relative growth position are from the World Bank's own April 2026 press release. The current account, reserves, rupee exchange-rate, and peer emerging-market currency figures (Indonesian rupiah, Brazilian real, South African rand, Mexican peso) are Trading Economics data, a single secondary aggregator for those series. The dollar-rupee swap facility's terms are from the Reserve Bank of India's own notification. The one-week change in reserves and the gap between the growth and depreciation figures are The Signal's calculations from those figures.