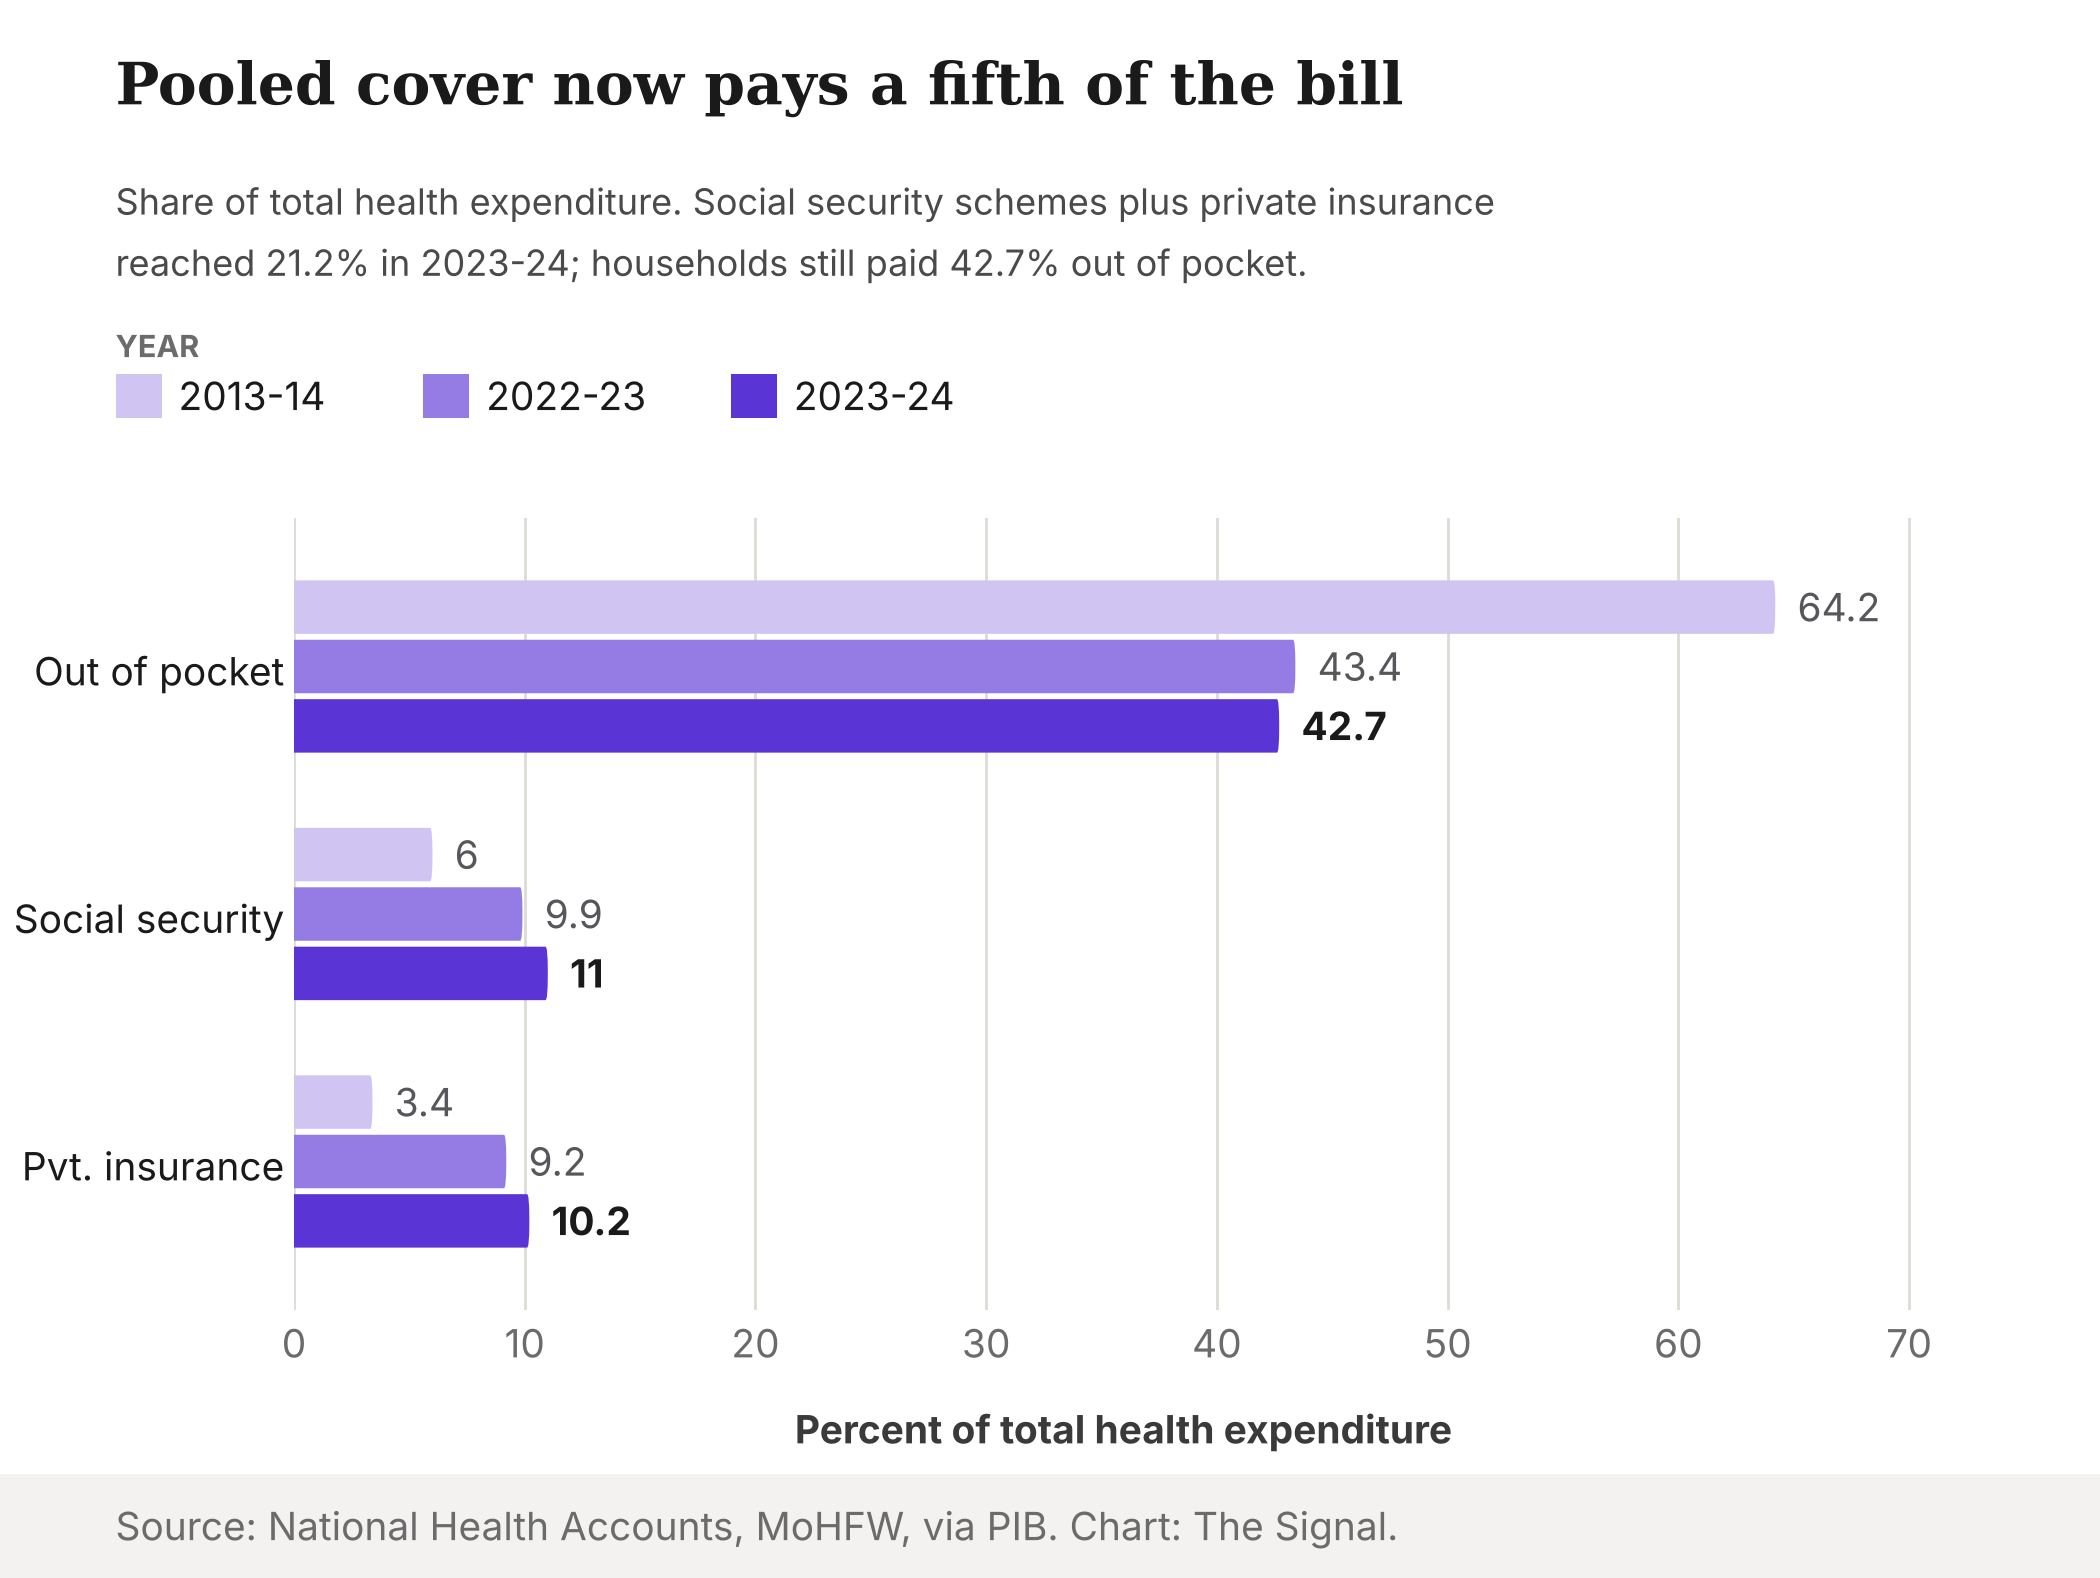
On 15 November 2026 the Union Health Ministry released India's National Health Accounts for 2023-24, and the headline wrote itself. The ministry's release states that households' out-of-pocket spending fell to 42.7% of total health expenditure in 2023-24, from 43.4% in 2022-23 and 64.2% in 2013-14. Over the same decade, government health expenditure rose from about Rs 1.30 lakh crore to Rs 4.14 lakh crore. Read the top line and the system is steadily lifting the bill off families.
The insurance numbers in the same release look even better. Social security expenditure on health, which covers schemes such as AB PM-JAY, state insurance schemes and medical reimbursement for government employees, reached 11% of total health expenditure in 2023-24. Private health insurance reached 10.2%. Together that is 21.2%: a fifth of India's health bill now flows through some form of pooled cover, against 9.4% in 2013-14 (6% plus 3.4%).
It is worth slowing down on that. A pool is only as useful as what it pays for, and the two halves of India's health bill are buying different things.
The pool grew faster than the household share fell
Start with the latest one-year change, from 2022-23 to 2023-24. The NHA 2022-23 release put social security at 9.9% and private insurance at 9.2% of total health expenditure, a combined 19.1%. In 2023-24 the combined figure was 21.2%. Pooled cover gained 2.1 percentage points in a year; the household share fell 0.7 points. Total health expenditure has other parts, so the two moves need not match point for point. But the gap is worth noticing.
All of this describes the year that ended in March 2024. Released on 15 November 2026, it is the newest national picture available, not a reading of today.
What households actually pay for
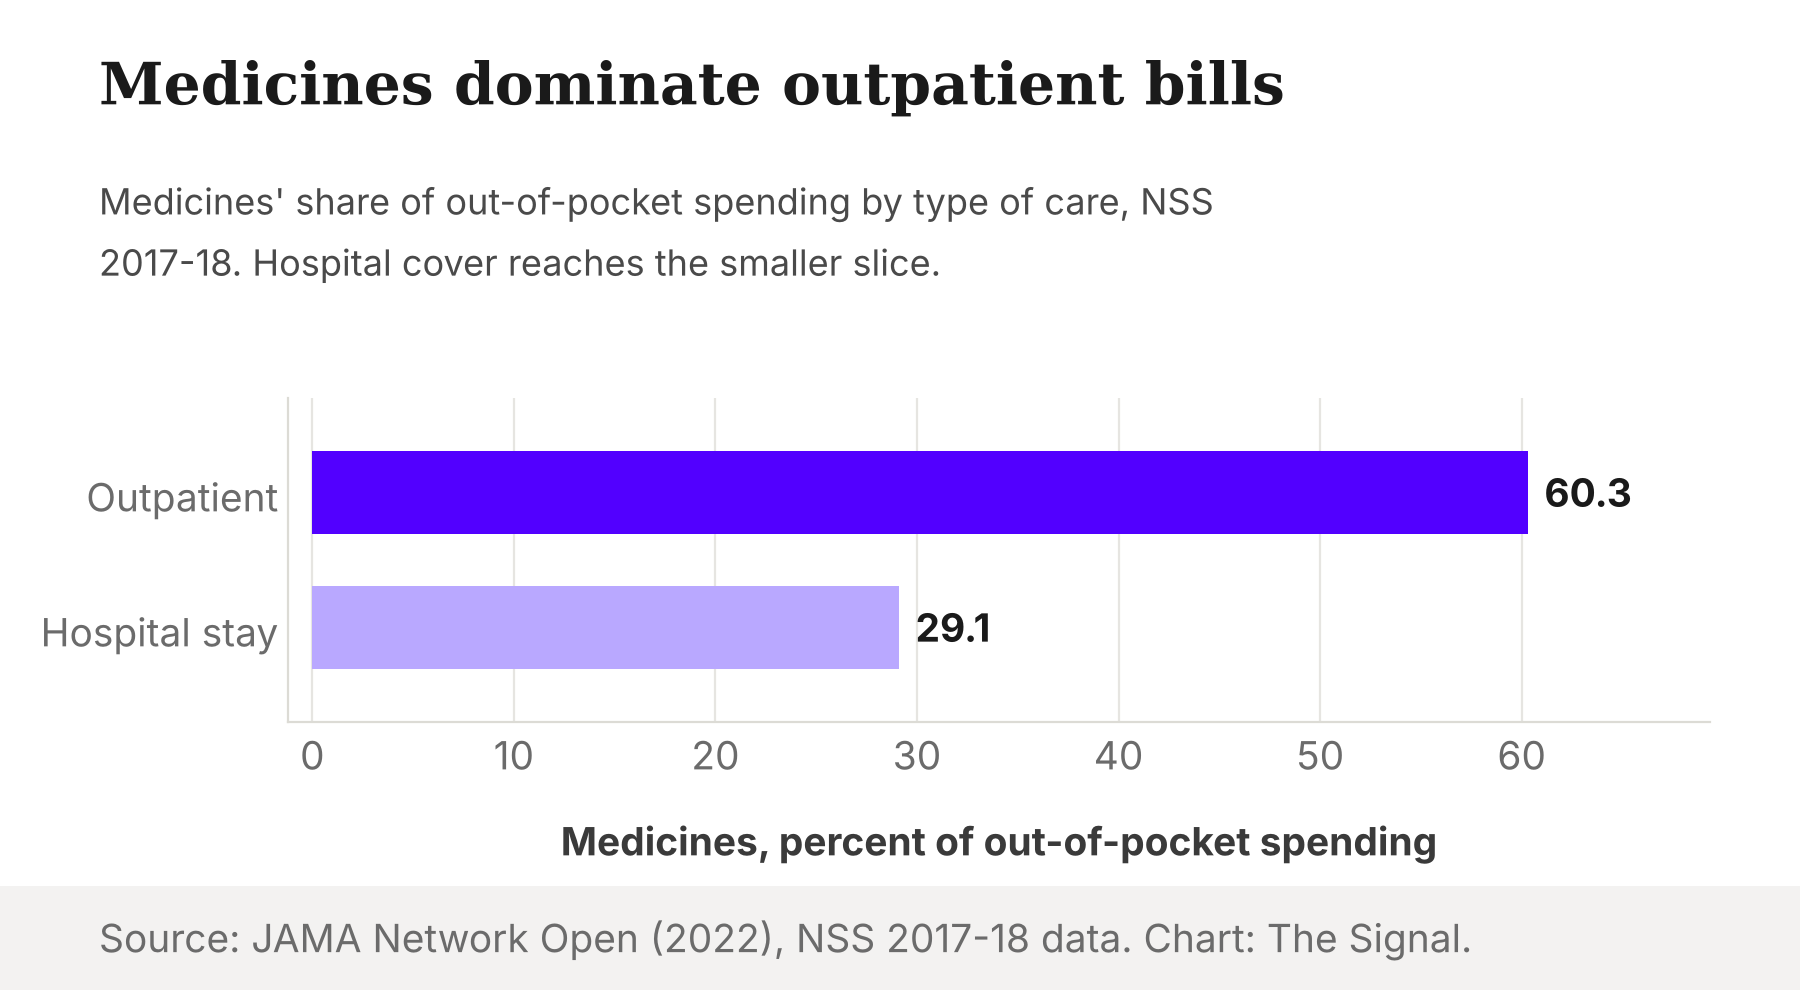
The number that carries this story is not in the new release. A 2022 peer-reviewed study in JAMA Network Open, analysing NSS 2017-18 data, finds that medicines accounted for 60.3% of outpatient out-of-pocket spending and 29.1% of inpatient out-of-pocket spending. For a visit to a clinic, three of every five rupees a family paid went on medicines.
The broader picture points the same way. A 2026 peer-reviewed study in BMJ Open on Jan Aushadhi pharmacies notes that medicines account for over 60% of household health expenditure in India, despite the country being home to one of the world's largest generic drug industries.
Counting by where the money goes points the same way. A 2025 systematic review in Frontiers in Public Health tabulates household out-of-pocket spending by provider: pharmacies took Rs 1,52,842 crore of Rs 3,56,254 crore in 2021-22, or 42.9%, almost unchanged from 43.1% in 2014-15. Private hospitals took 33.85% and government hospitals 4.01%. More of the household rupee went to the chemist than to any hospital. All these figures predate 2023-24, and the shares may have moved since.
What the pool is built to pay for
India's flagship scheme is explicit about its design. A PIB backgrounder on PM-JAY's eighth anniversary states that the scheme had funded treatment worth up to Rs 2.03 lakh crore across about 13.25 crore hospital admissions, through over 38,000 empanelled hospitals, as of 31 August 2026. The same backgrounder calls PM-JAY an "inpatient care model" that works alongside Ayushman Arogya Mandirs for primary care. Rs 2.03 lakh crore over 13.25 crore admissions works out to at most about Rs 15,300 per admission.
That design choice is the hinge. India's flagship pooled scheme is, by its own description, built around the hospital bed. That is not only PM-JAY. A 2023 peer-reviewed study in BMC Public Health notes that government schemes focus on reducing household spending on inpatient care alone, and that outpatient cases often have limited insurance coverage. The biggest item in what families pay for outpatient care is the medicine strip.
Pooled money and household money are aimed at different parts of the bill.
| What the data measure | Figure | Period |
|---|---|---|
| Social security plus private insurance, share of total health expenditure | 21.2% | 2023-24 |
| Out-of-pocket spending, share of total health expenditure | 42.7% | 2023-24 |
| PM-JAY hospital admissions funded | about 13.25 crore | to 31 August 2026 |
| Medicines, share of outpatient out-of-pocket spending | 60.3% | 2017-18 |
| Medicines, share of inpatient out-of-pocket spending | 29.1% | 2017-18 |
| Pharmacies, share of household out-of-pocket spending | 42.9% | 2021-22 |
Sources: NHA 2023-24, via PIB; PIB backgrounder on PM-JAY; JAMA Network Open (2022); Frontiers in Public Health (2025). The combined 21.2% is The Signal's sum of the two NHA shares.
Cover tripled, the bills did not vanish
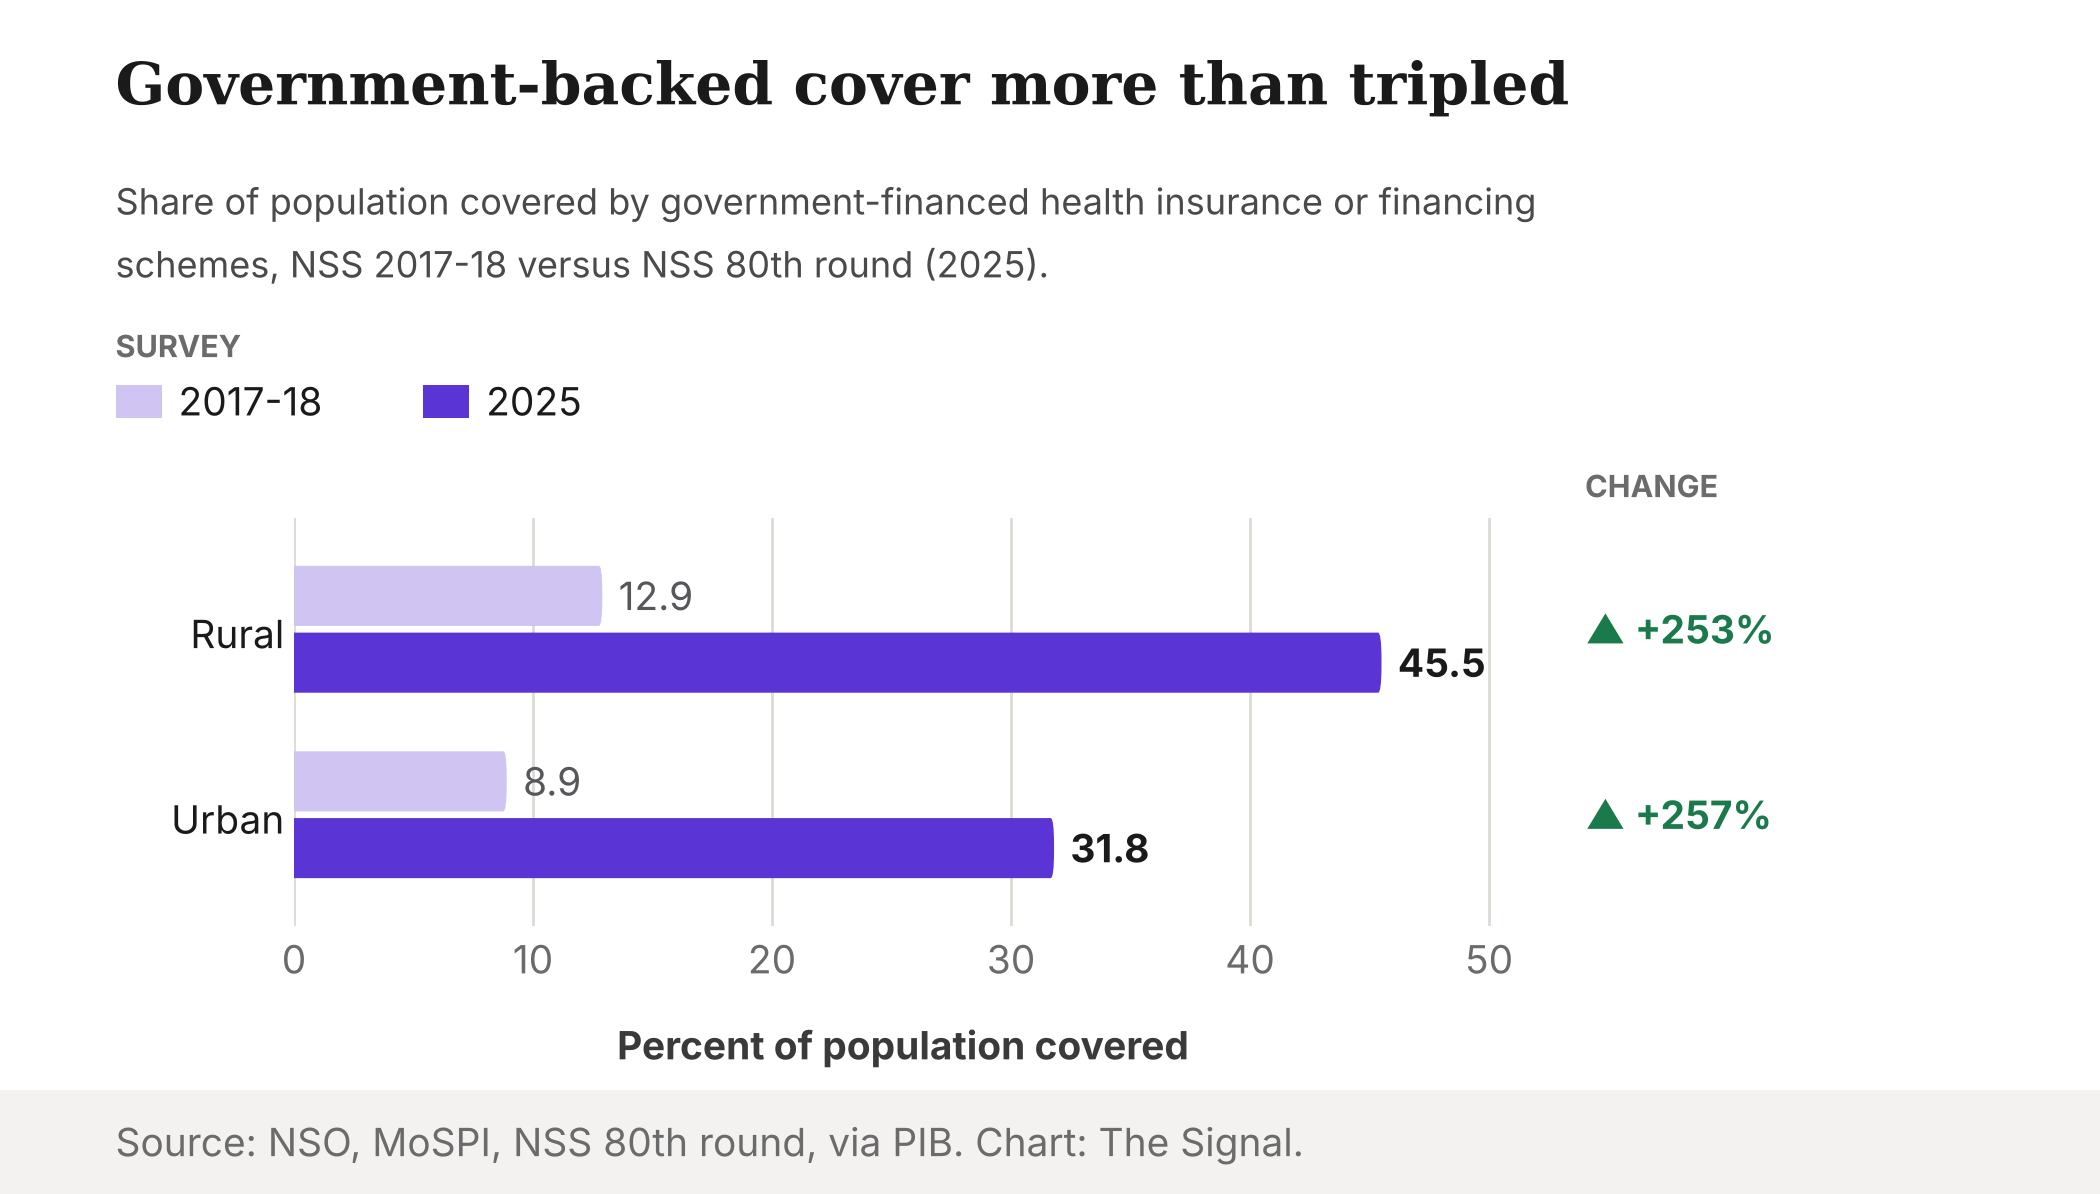
Coverage itself is no longer the bottleneck. MoSPI's NSO, in its release on the NSS 80th-round health survey, reports that the share of people covered by government-financed health insurance or financing schemes rose from 12.9% to 45.5% in rural areas and from 8.9% to 31.8% in urban areas since 2017-18, more than a threefold expansion.
Yet the same survey found families still paying real money. The NSO press note on the 80th round reports that by 2025 insurance coverage reached 47.4% of people in rural areas and 44.3% in urban areas. In the same survey, the average out-of-pocket cost per hospitalisation case, excluding childbirth, was about Rs 34,064 over the previous 365 days, and about Rs 861 per outpatient spell over the previous 15 days. Insurance has spread to nearly half the population. It has not made the cash payment disappear, at the hospital or at the clinic.
The medicine lever already exists
If medicines are the stubborn part of the household bill, the price of medicines is the obvious lever. The BMJ Open study notes that branded generics hold about 70% of India's market and are priced 20% to 60% above unbranded alternatives, because of brand promotion, uneven price information and prescribing incentives.
The government's own generic channel shows the scale of the gap. The Ministry of Chemicals and Fertilizers states that by June 2025, Jan Aushadhi medicines worth Rs 7,700 crore at MRP had been sold, with estimated savings of about Rs 38,000 crore against branded equivalents. That is close to Rs 5 saved for every rupee spent, by the ministry's own estimate.
The honest objection
The strongest case against this reading is that it leans on shares, and shares move for reasons that have nothing to do with insurance. The NHA 2022-23 release notes that the out-of-pocket share fell to 39.4% in the COVID period because of one-time government spending, against 43.4% in 2022-23. A PIB backgrounder on NHA 2021-22 states that government health expenditure rose from 1.13% of GDP in 2014-15 to 1.84% in 2021-22. When the denominator swings like that, a falling household share can mean more public money, not smaller family bills. The provider table in the 2025 review shows exactly that: households paid Rs 3,56,254 crore out of pocket in 2021-22, up from Rs 3,02,425 crore in 2014-15, in rupees that are not adjusted for inflation, even as their share of the bill fell. The same logic cuts the other way: a modest 0.7-point drop in 2023-24 does not prove insurance is failing households.
There is also a real case for hospital-first cover. The NSS 80th round figures put the average hospitalisation at Rs 34,064 out of pocket against Rs 861 for an outpatient spell, so one hospital case costs about as much as 40 clinic visits. Protecting families from that one large bill is a defensible first priority. But clinic visits are far more common. MoSPI's press note on the survey reports that about 13.1% of people reported an ailment in a single 15-day window in 2025, while the hospitalisation rate was about 2.9% over a whole year. Small bills, repeated often, add up.
Both points are fair, and neither rescues the easy read. The denominator problem means the NHA share figures cannot show that insurance cut household spending; they only show that insurance grew. And the case for hospital-first cover is an argument about which risk to pool first, not evidence that the remaining household bill is being pooled at all. On the evidence here, that remainder is medicine-heavy.
The Signal
The 2023-24 accounts confirm that India has built a sizeable insurance pool: 21.2% of total health expenditure through social security schemes and private insurance, with households still paying 42.7%. The flagship scheme in that pool is, by its own description, an inpatient care model, while medicines make up 60.3% of what families pay for outpatient care. The next fall in the household share is therefore more likely to come from cheaper or covered medicines than from more hospital cover alone. Watch the 2024-25 accounts for two numbers together: whether the out-of-pocket share falls by as much as the pooled share rises, and whether medicine prices, through Jan Aushadhi or price control, start to show up in the household bill. India has learned to insure the hospital stay. The pharmacy counter is still paid in cash.
Reporting basis: the 2023-24 shares of out-of-pocket, social security and private insurance spending, and government health expenditure, are from the National Health Accounts compiled by the NHA Technical Secretariat at NHSRC, Ministry of Health and Family Welfare, via PIB; the 2022-23 shares are from the previous NHA round, via PIB, and the government-spending share of GDP from a PIB backgrounder on NHA 2021-22; these three are one origin. PM-JAY admissions and value are from the National Health Authority, via PIB. Coverage and per-case out-of-pocket costs are from MoSPI's National Statistics Office, NSS 80th round, via PIB and its press note, and the morbidity and hospitalisation rates from the NSO press note via PIB; these three NSS 80th-round releases are one origin. Out-of-pocket spending by provider for 2014-15 and 2021-22 is from a 2025 Frontiers in Public Health systematic review; the inpatient focus of government schemes is from a 2023 BMC Public Health study. Medicine shares of out-of-pocket spending are from a 2022 JAMA Network Open study of NSS 2017-18 microdata, and the load-bearing 60.3% outpatient medicine share rests on that single study; the household medicine share and branded-generic pricing are from a 2026 BMJ Open study citing prior literature; Jan Aushadhi sales and savings are from the Department of Pharmaceuticals, via PIB. The combined pooled shares, the year-on-year point changes, the per-admission PM-JAY value, the savings-per-rupee ratio and the hospital-to-outpatient cost ratio are The Signal's calculations from those figures.