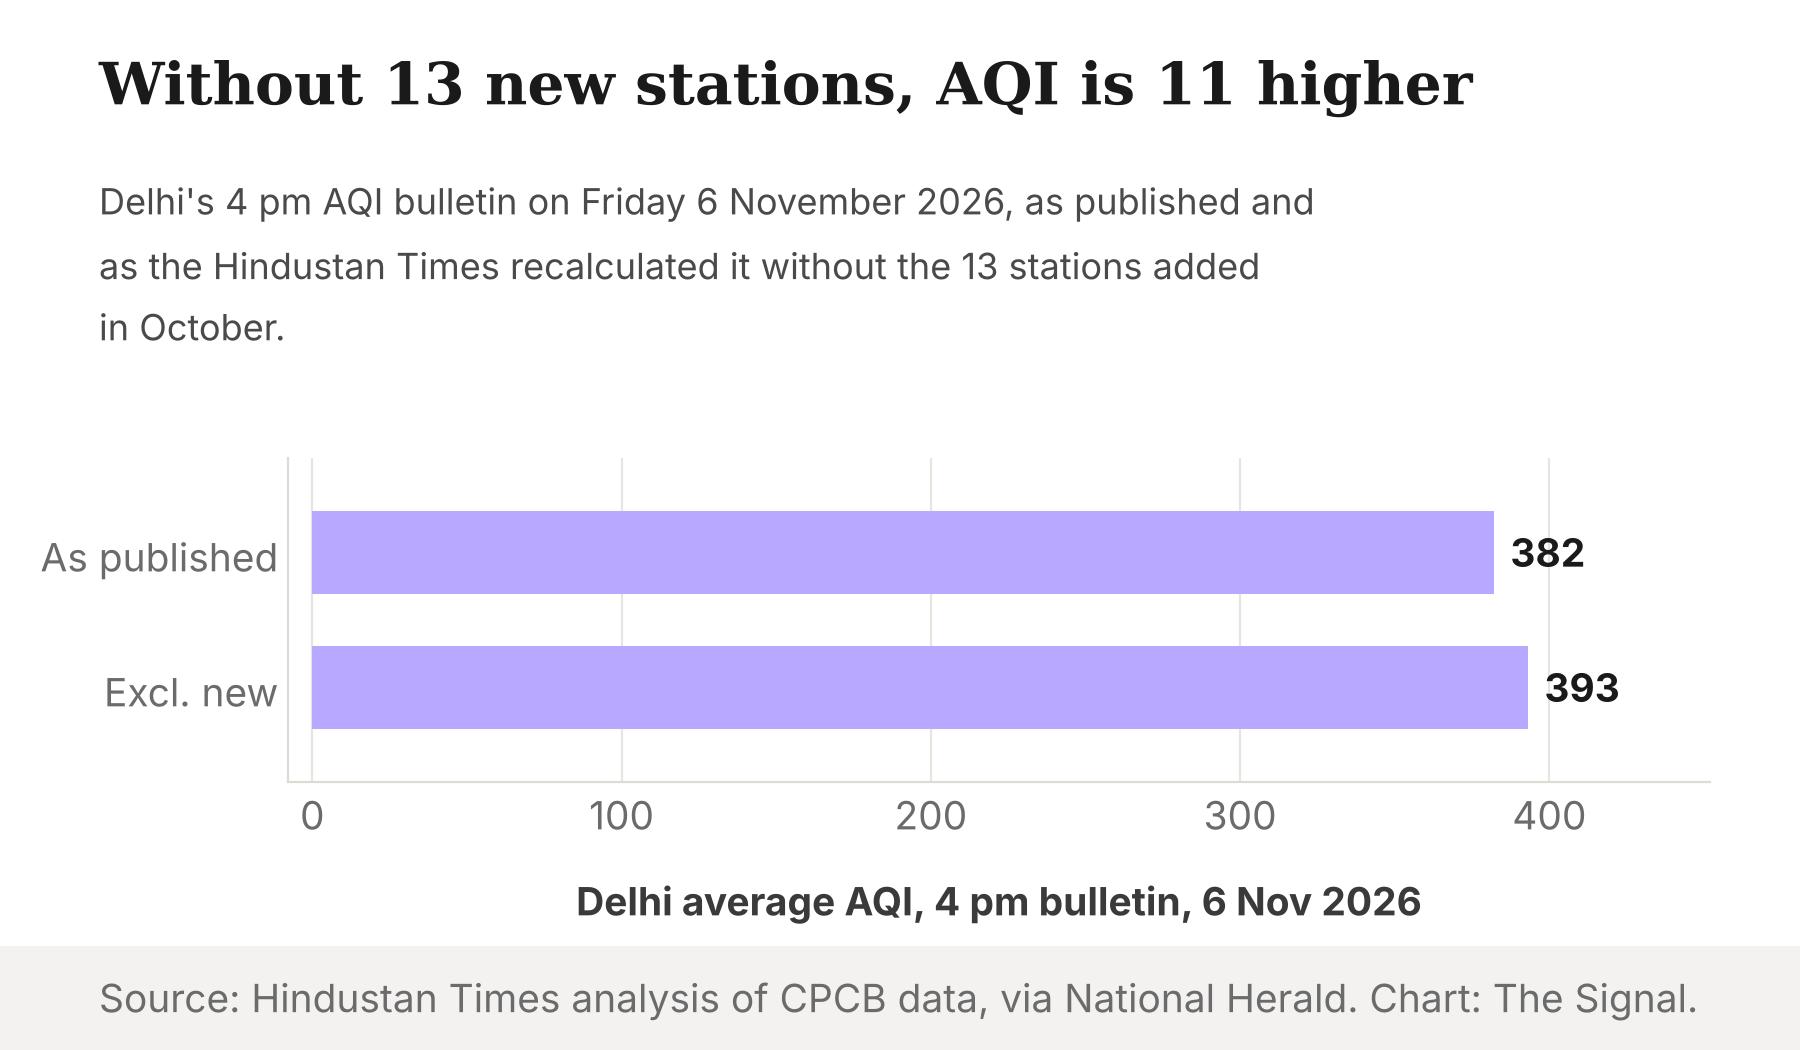
On Friday 6 November 2026, Delhi's 4 pm air quality bulletin put the city's average AQI at 382. That is the figure residents saw, schools weighed and officials cited. A Hindustan Times analysis of CPCB data, as reported by National Herald, found that the addition of 13 new monitoring stations to Delhi's network in October may have pulled down the city's average AQI. Without them, the same bulletin would have read 393.
The easy read is political. Delhi's opposition AAP has sought an independent investigation, and the government says the new stations close gaps. Both framings skip the more useful question. A city's AQI is a number built from a set of stations, and when the set changes, the number can change without the air changing at all.
Eleven points is small. The mechanism is not.
Eleven points on a reading near 390 is under 3 percent. On its own it would not change what anyone does on a given afternoon. The same analysis found that the new stations recorded PM2.5 levels about 35 per cent below neighbouring older stations. That is the number worth slowing down on.
A 35 percent gap between neighbours, as the HT analysis reports, is large. It means the new monitors are reading air that differs from what the older ones nearby measure, which is what you would expect if they sit in cleaner pockets, at the outer edge, or in places where the older network had no coverage at all. It is also what you would expect if the new sensors read differently for reasons unrelated to the air. The published analysis cannot separate those, and neither can we.
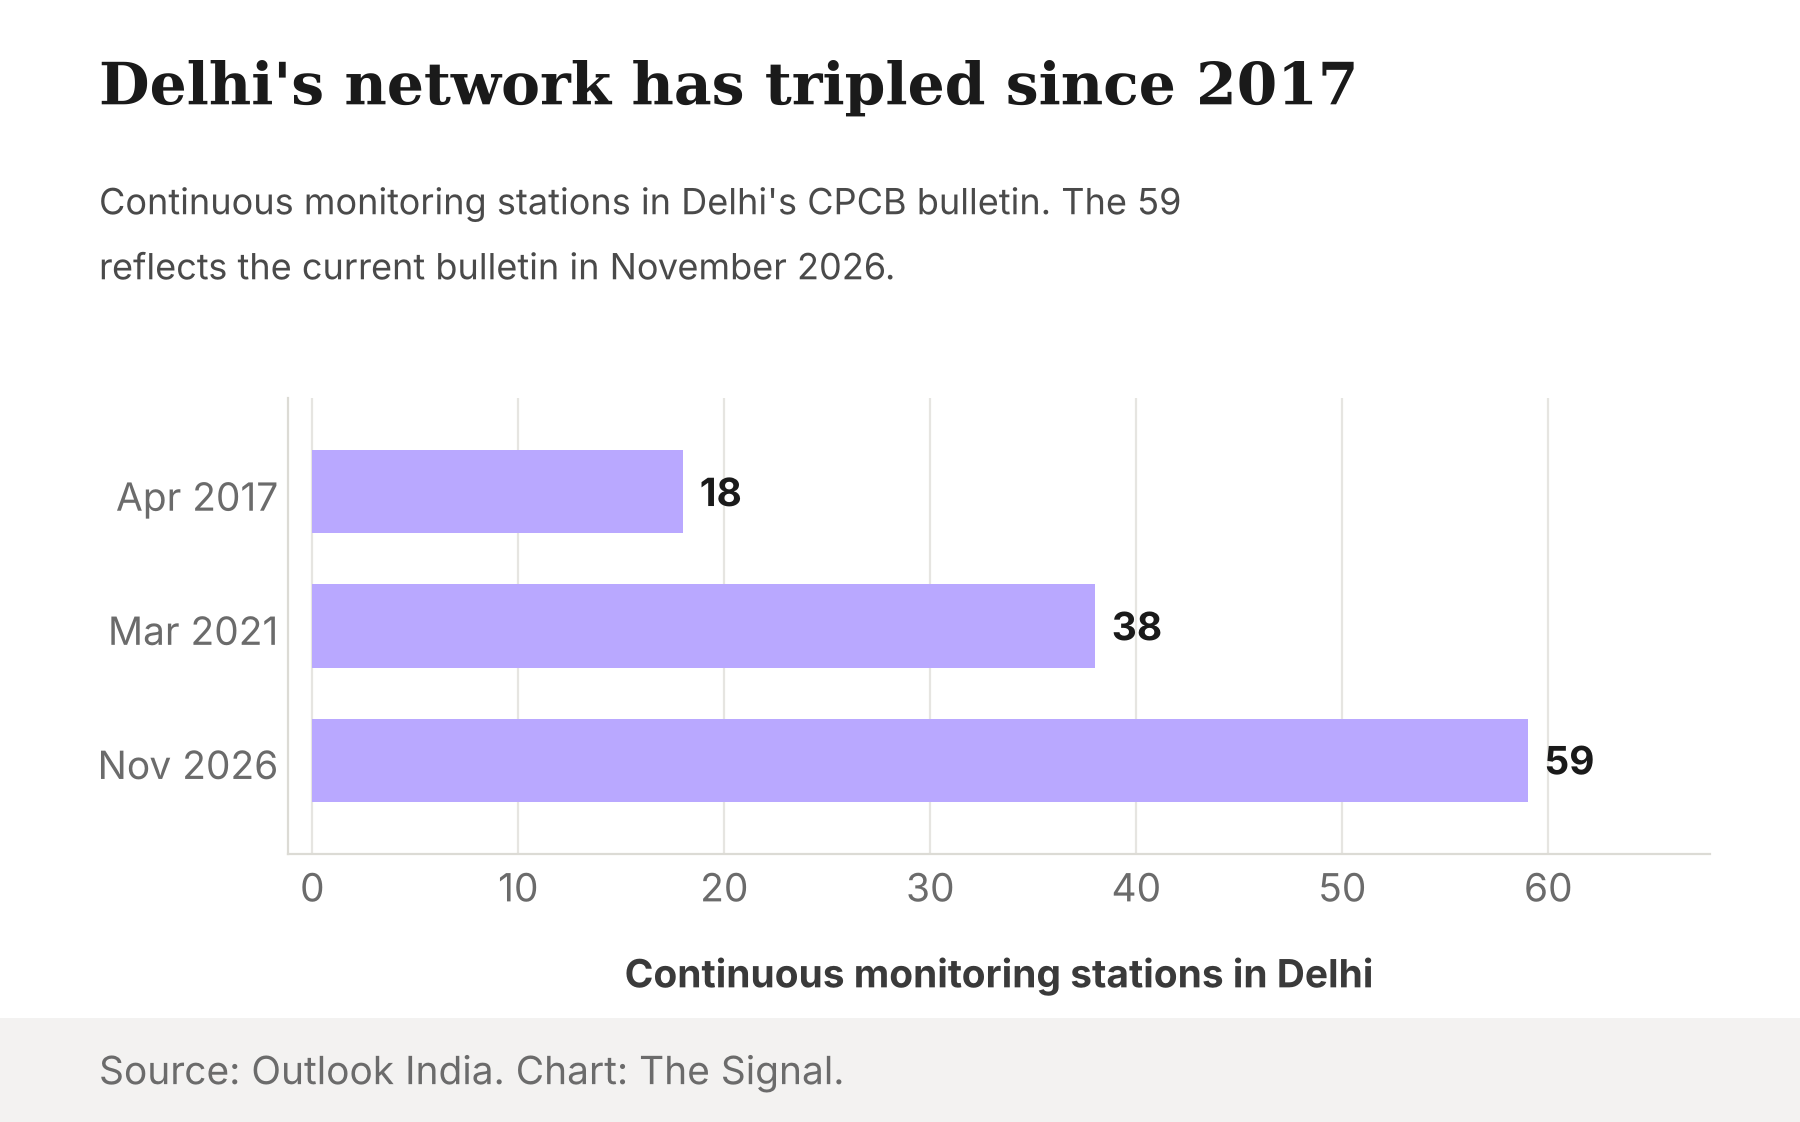
Here is the part that is plain arithmetic. Delhi's continuous network grew from 18 stations in April 2017 to 38 in March 2021 and 59 in the current bulletin, per Outlook India. Thirteen of 59 is 22 percent of today's network. A fifth of the stations moved the headline by about 3 percent. The average is a summary of whoever is in the room, and the room just got bigger.
The expansion was ordered, and it is not finished
None of this was improvised. The Commission for Air Quality Management has set a new spacing target. As a PIB release on its 28th meeting puts it, under the revised norms, one monitoring station is envisaged per 25 sq. km. for Delhi and contiguous cities. The same release says 46 additional CAAQMS are proposed across Delhi-NCR, 14 of them in Delhi, taking the total to 157.
That is an area rule, not a pollution rule. A grid does not ask where the air is worst. It asks where there is no instrument. In February 2026, a PIB release from the Environment Ministry said six new CAAQMS had been installed in Delhi, and that at full build-out Delhi would hold 60 of the 157 stations in the region. The counts in the official releases and in the HT and Outlook reporting come from different dates and different definitions, so they do not line up neatly. The direction is the same in all of them: more stations, spread wider.
Fill in a grid and the average will move toward the area's typical air, which for a dense city with a hot core and a lighter fringe means down. That is not a flaw in the expansion. It is what happens when a number that used to describe where the instruments were starts to describe where the people are.
The honest objection
The strongest case against the worry is the one the Delhi government makes. It says the new stations were placed in previously uncovered outer areas to close gaps in monitoring, and that dropping stations simply because they record lower pollution levels would distort the overall assessment.
That argument is right on the merits. People live in those outer areas. Their air counts. A network that only measured the dirtiest districts would overstate what the typical resident breathes, just as one that ignored the edges understates the reach of the city. Nobody should want the new stations switched off.
There is also a claim the evidence does not support. Delhi's opposition party has alleged that water was sprayed near monitoring stations to lower readings. The report we relied on states plainly that these remain allegations and have not been independently established. We found no independent confirmation of that, and the 35 percent gap does not require it.
What the older network already knew about itself
The older network is not a clean baseline either. An audit by the Comptroller and Auditor General inspected 13 of Delhi's stations in September 2020. As reported by Newslaundry, all 13 were near trees on more than one side, and the CAG concluded that the siting pointed to possible inaccuracies in the data, rendering the AQI values unreliable.
So the debate is not between a trustworthy old network and a suspect new one. It is between two sets of instruments, neither independently audited in public for this purpose, whose averages are being compared as if one were the truth.
The bulletin itself is also a moving target. On 3 November 2026, UNI reported that the average AQI touched 350 and that 57 monitoring stations were reporting valid data, with 10 recording severe air and 35 very poor. The 57 is not the 59 in Outlook's count. A citywide number built from a different number of stations each day is a number whose composition changes under it.
The Signal
The 11 points are not the story. The story is that Delhi has no stable definition of "the city's AQI," and a rule that sets action levels against a single average inherits every change to the network behind it.
Three things are worth watching, and none needs a new number. First, whether CPCB or CAQM publishes the station-by-station readings alongside the average, so that anyone can recompute it. Second, whether the 14 further Delhi stations proposed under the area rule widen the gap again. Third, whether any official body publishes the old-network and new-network averages side by side, instead of leaving it to a newspaper to do the subtraction.
If the 11-point gap on 6 November is the whole effect, this is a footnote. If it grows with every station added at the edge, then the average is turning into a measure of the grid. A number that cannot say whose air it describes cannot say when to act.
Reporting basis: the 382 and 393 figures, the 35 percent PM2.5 gap, the Delhi government's response and the AAP allegation are from a Hindustan Times analysis of CPCB data, as relayed by National Herald; we did not independently reach the HT article or the CPCB bulletin. Station-network counts for Delhi are per Outlook India. The spacing norm, the 46 proposed stations and the 157 total are from a PIB release on a CAQM meeting, and the installed and planned Delhi counts are from a February 2026 PIB release from the Environment Ministry, both resting on one government origin. The 2020 siting inspection is the CAG's, as reported by Newslaundry. The 3 November reading and station counts are per UNI. The 11-point difference, the under-3-percent share and the 22 percent share of stations are The Signal's calculations from those figures.