On 7 August 2026, a parliamentary committee gave the private hospital sector a clear villain. The Standing Committee's 176th report recommended that private hospital room charges in metropolitan cities should not exceed the average tariff of a nearby three-star hotel, and it cited medical inflation of 10 to 13 percent and average out-of-pocket spending of ₹34,064 per hospitalisation. It also urged a national statutory body to set and enforce caps on essential procedures and diagnostics.
The target is foreign capital. Bloomberg reported that global investors have spent about US$10 billion buying stakes in Indian hospital chains over the past five years, and the committee warned of an "unchecked influx of foreign capital". The surface read is simple: Wall Street bought the hospitals, so bills are rising. Cap the bills and curb the buyers.
It is worth slowing down on that. The easy story assumes the chains are pushing prices up faster than the economy. The chains' own latest results say something more awkward.
The inflation number and the bills do not match
Start with what two large listed chains reported for the April to June quarter of 2026, the first quarter of their financial year 2026-27. Max Healthcare reported that its average revenue per occupied bed rose 5 percent year on year to ₹81,900. Apollo Hospitals reported that average revenue per inpatient grew 8 percent to ₹186,630, driven by favorable case mix and specialty growth.
Set those beside the committee's range. Growth of 5 and 8 percent sits below the 10 to 13 percent medical inflation that the Hans India says the report cited. Max's figure is half the low end of the range.
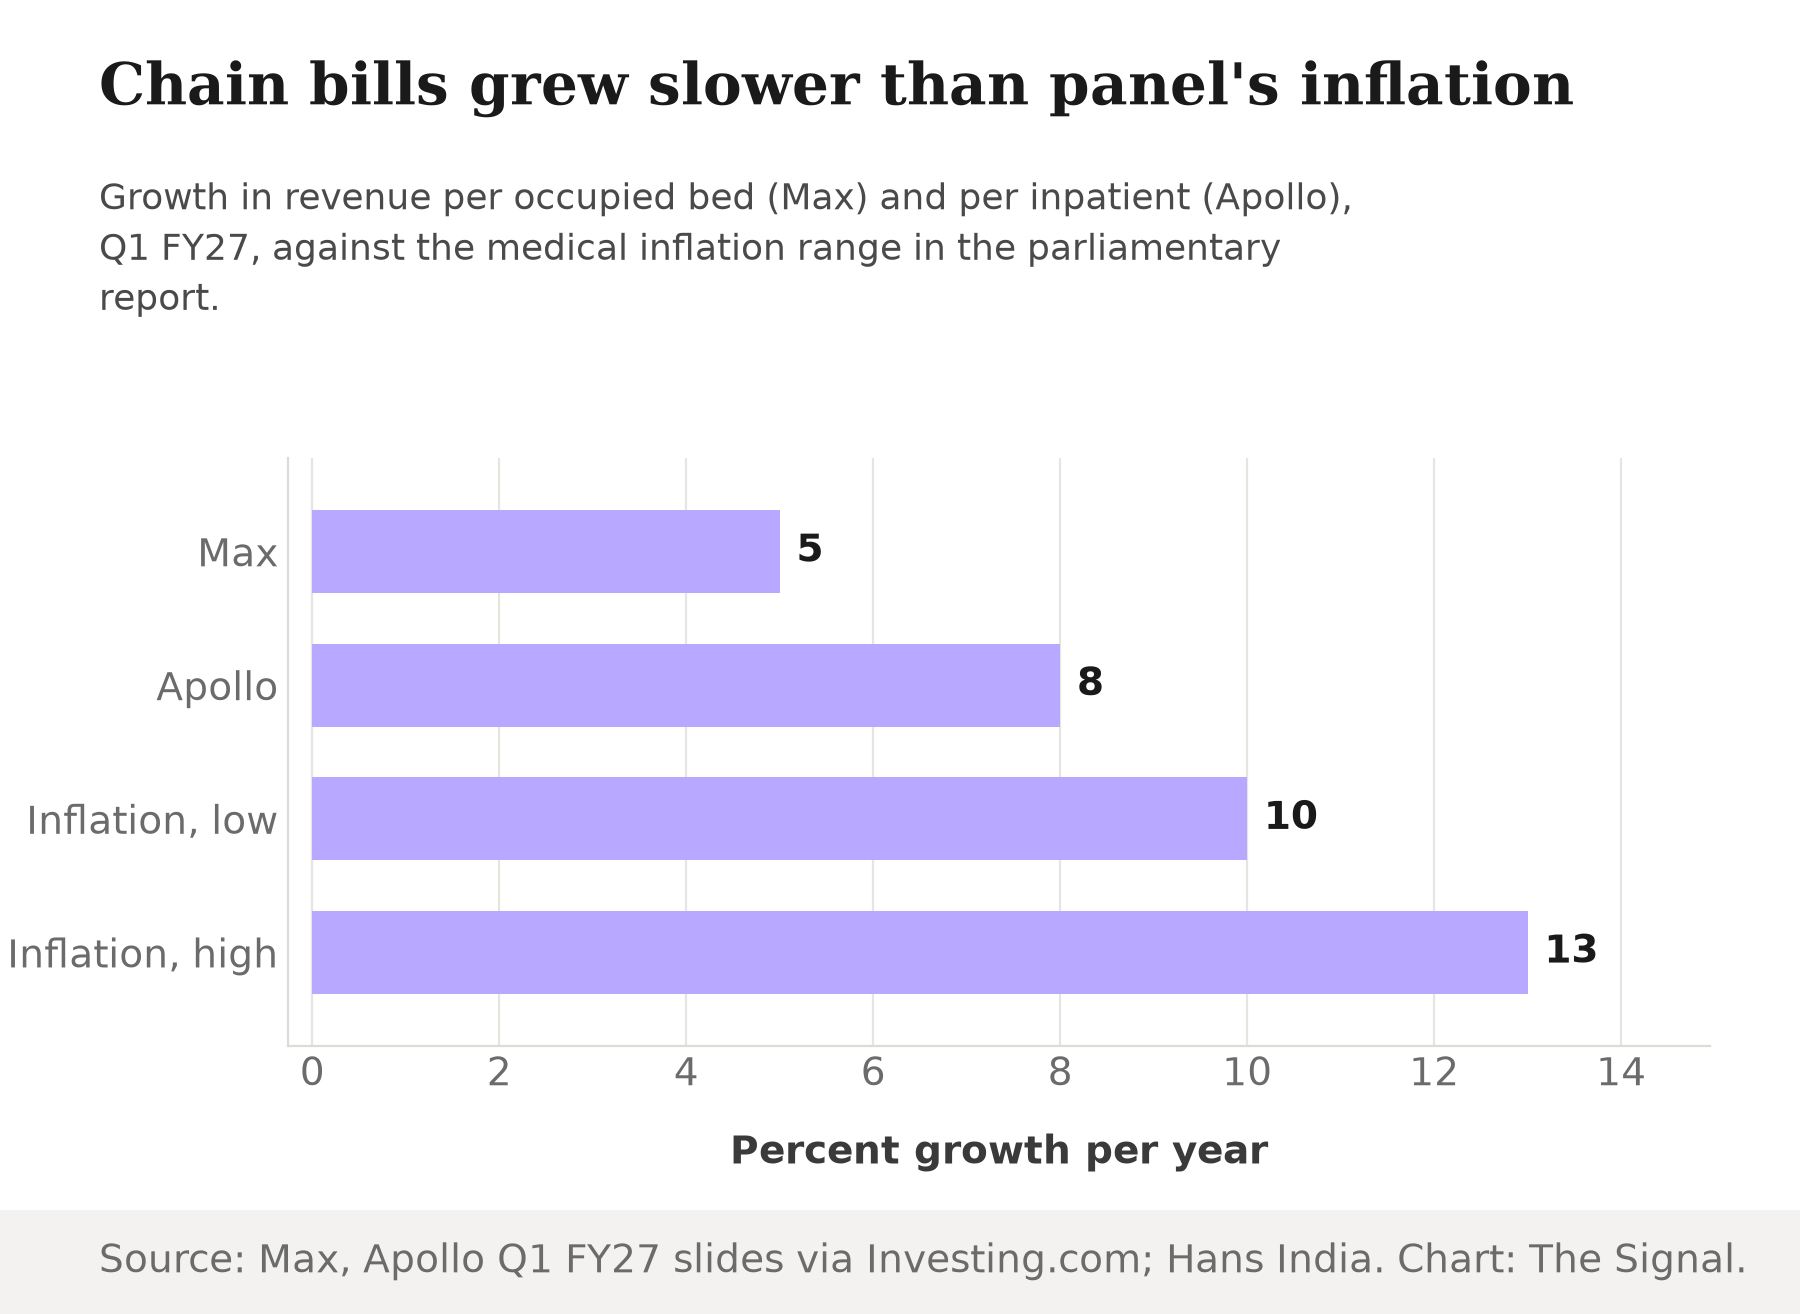
These are not like-for-like. Revenue per bed or per patient blends price, treatment intensity and the mix of cases. It is not a price index. But that is the point. Apollo itself attributes its 8 percent to favorable case mix and specialty growth, not to a tariff increase. If a family's bill is rising, the chains' own disclosures suggest the more expensive thing is being done, not the same thing repriced.
The money is concentrated, not widespread
The second number that complicates the story is share. Bloomberg says PE-backed operators account for less than 5 percent of the country's hospital beds, while being present in high-margin specialities such as cardiac surgery and cancer care. That is why the policy target matters: a small bed share can still set the tone in the specialities where bills are largest.
It also shows how thin the link is between the $10 billion headline and the average patient's bill. The same report says treatment at private hospitals costs, on average, five to 10 times as much as in the public system. That gap long predates the recent wave of buyouts. Foreign money is a visible new owner. It is not obviously the cause of an old price gap.
The investor side is not shy about returns. Temasek has generated roughly a 10-fold return on its 2017 investment in Manipal Health Enterprises, per the Bloomberg report. Profitable exits are exactly why the committee is worried, but profit and price inflation are different claims.
Margins say the business is healthy
Margins at the two chains are healthy. Max Healthcare reported an operating EBITDA margin of 24.8 percent and occupancy above 75 percent across 5,379 operational beds. Apollo's Healthcare Services division reported a 24.2 percent EBITDA margin.
A margin near a quarter of revenue is the real reason caps are politically attractive. It is also the reason a cap is blunt. A ceiling set on a room tariff does not touch the case-mix lever, which is where Apollo says its growth comes from.
Who is paying more of the bill
The public side of the ledger has moved. The Health Ministry's National Health Accounts for 2022-23 show government health expenditure rising from 28.6 percent to 43.7 percent of total health expenditure between 2013-14 and 2022-23. The same release shows it rising from 1.15 percent to 1.43 percent of GDP, and from ₹1.30 lakh crore to ₹3.85 lakh crore. Per capita government spending rose from ₹1,042 to ₹2,786 over the same period, according to All India Radio's report on the release.
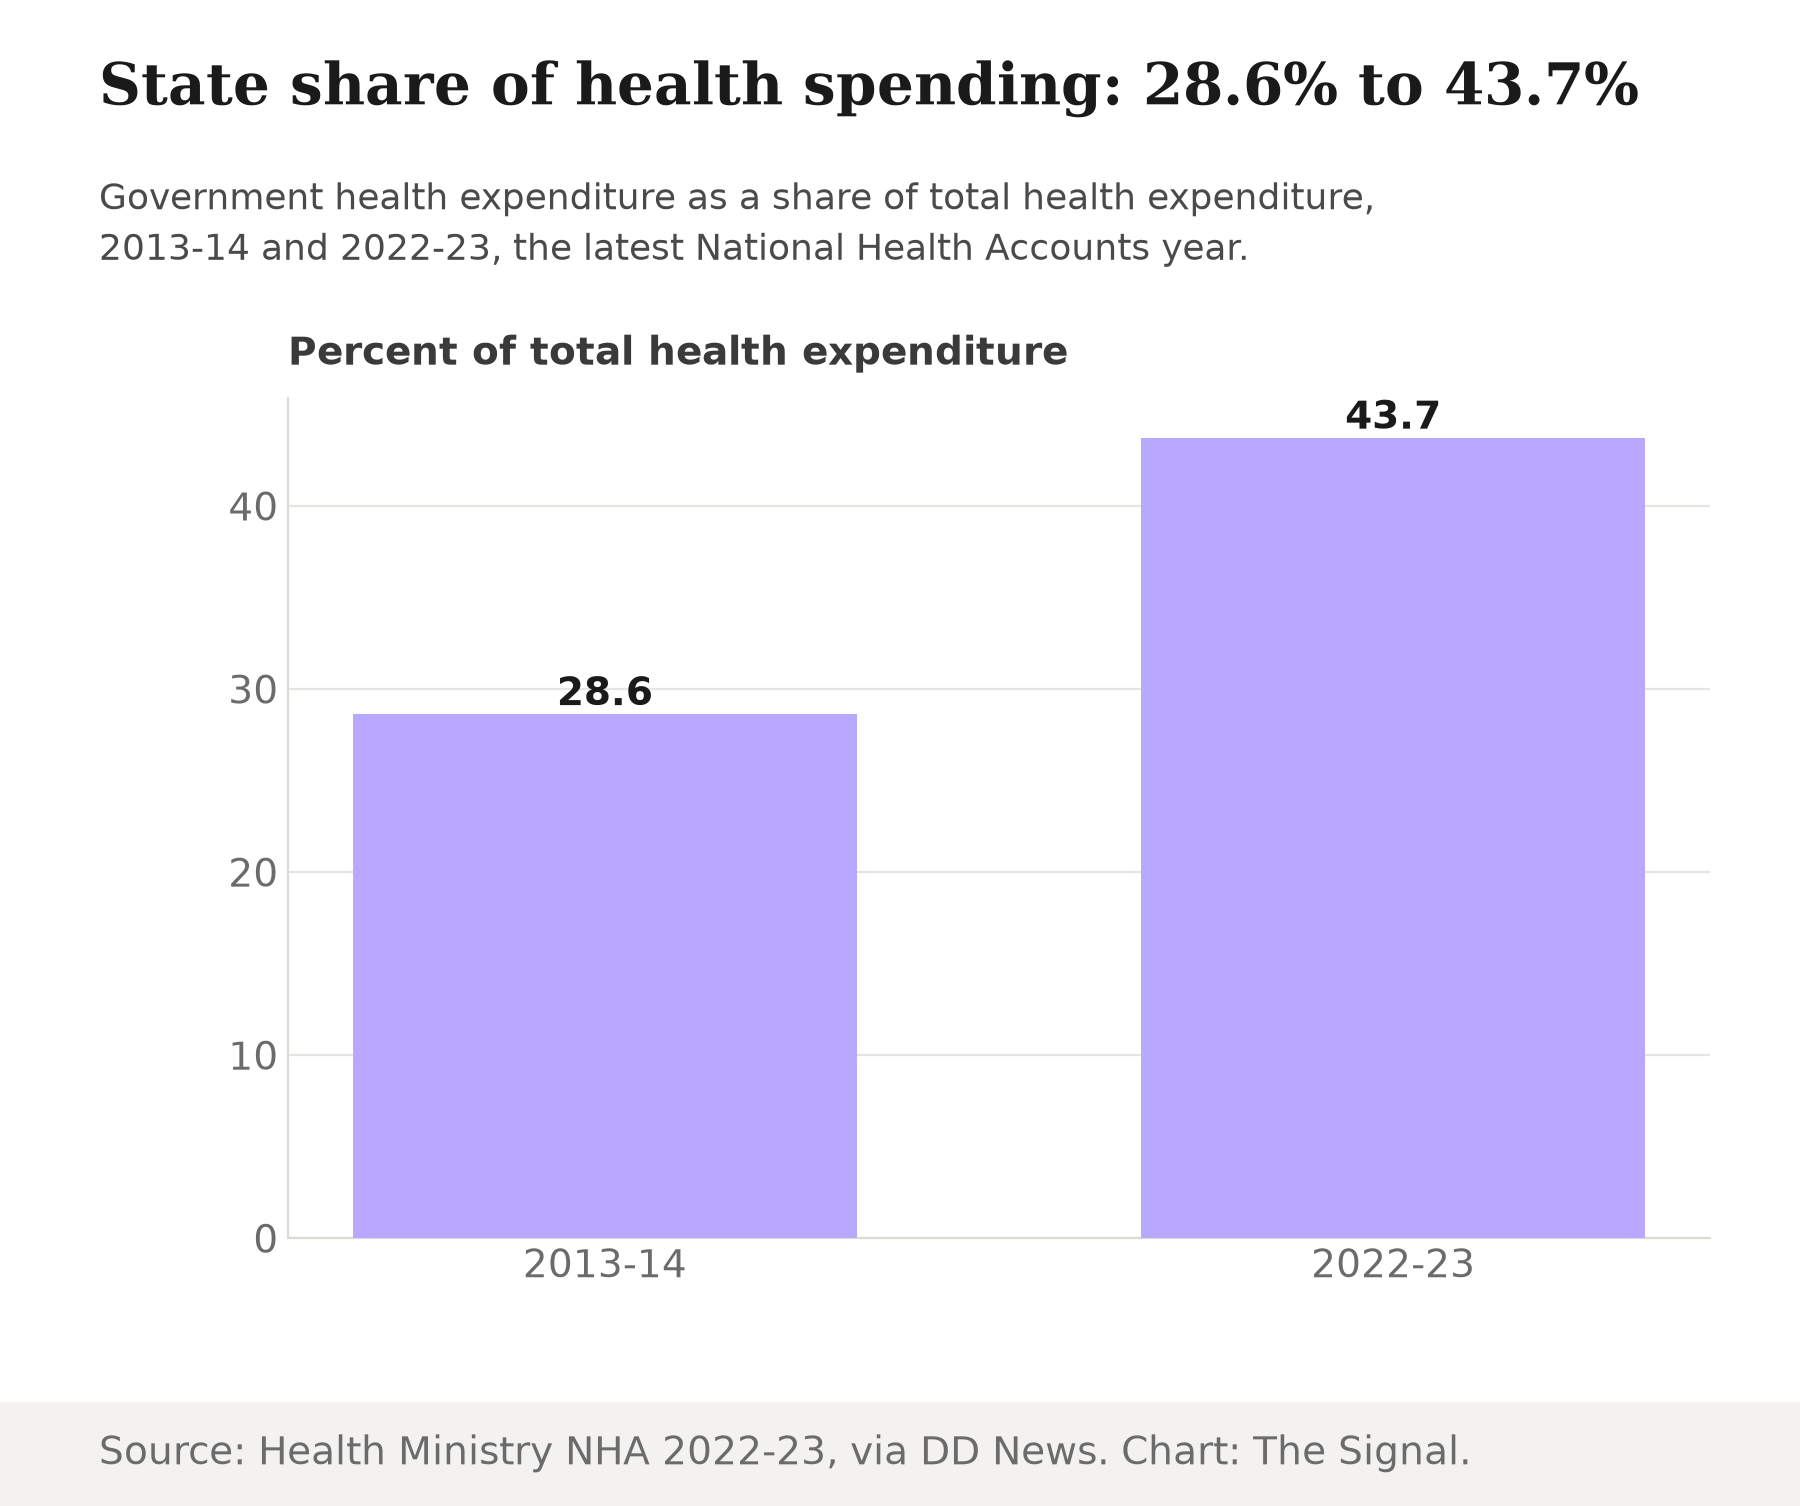
This series is lagged by design: it describes a period well before the latest results. Still, it shows the state is a bigger payer than it used to be, which makes the private hospital price question a question about public money as well as household money.
The honest objection
The strongest case for the committee is that averages hide the problem. Two listed chains are not the whole market. A 5 percent rise in revenue per bed can coexist with a 15 percent rise in the price of a specific procedure at a specific hospital, because mix and price move in opposite directions. The committee also found a "stark disparity" between public and private costs and called out-of-pocket spending "unsustainably high" for lower and middle income households. And Bloomberg notes that insurers say providers inflate bills, while operators say delayed insurer payments and inadequate reimbursement rates squeeze their margins. Neither side has published the like-for-like procedure price series that would settle it.
That case is real. But it argues for measuring prices before capping them. A cap built on an inflation figure that the major chains' own numbers do not reproduce risks aiming at the wrong lever.
The Signal
The fight is being framed as foreign capital against patients. The numbers point somewhere narrower. Foreign-backed operators hold under 5 percent of beds, two large listed chains report bill growth below the inflation rate Parliament quotes, and Apollo says its growth comes from case mix and specialty growth. What is missing is a procedure-level price index that separates a higher tariff from a higher-acuity case.
Watch whether the Health Ministry builds that price series before it legislates the cap. If it does, the cap will land where bills actually rise. If it does not, the rule will be written for the average bill, and patients are billed one procedure at a time.
Reporting basis: Government health expenditure figures are from the Union Health Ministry's National Health Accounts, as carried by DD News and All India Radio; we did not check the underlying release. The committee's recommendations, the medical inflation range and the out-of-pocket figure are per the Hans India and ThePrint, covering the committee's findings, and rest on those two secondary accounts. The foreign investment total, the bed share, the Temasek return and the insurer and operator claims all come from one Bloomberg story, carried by The Edge Malaysia, so they count as a single origin. Max Healthcare and Apollo Hospitals results are from each company's latest investor slides, as summarised by Investing.com. The comparison of the chains' growth with the committee's inflation range, and the observation that Max's figure is half the low end, are The Signal's calculations from those figures; the measures are not like-for-like.