An Indian born in the early 1970s could expect to live 49.7 years. One born in the five years before the pandemic could expect 69.7, a 20-year gain packed into four decades, according to the Registrar General of India's life tables, reported by the Health Ministry to Parliament. The country has also added people to go with the years: 149 million Indians were 60 or older in 2022, about 10.5% of the population, per the India Ageing Report 2023 from UNFPA and the International Institute for Population Sciences. Read only those two numbers and the story writes itself: India is living longer, and there are more older people around to prove it.
It is worth slowing down on that. A year of life is not automatically a year of health, and India's own numbers show the two have stopped moving together.
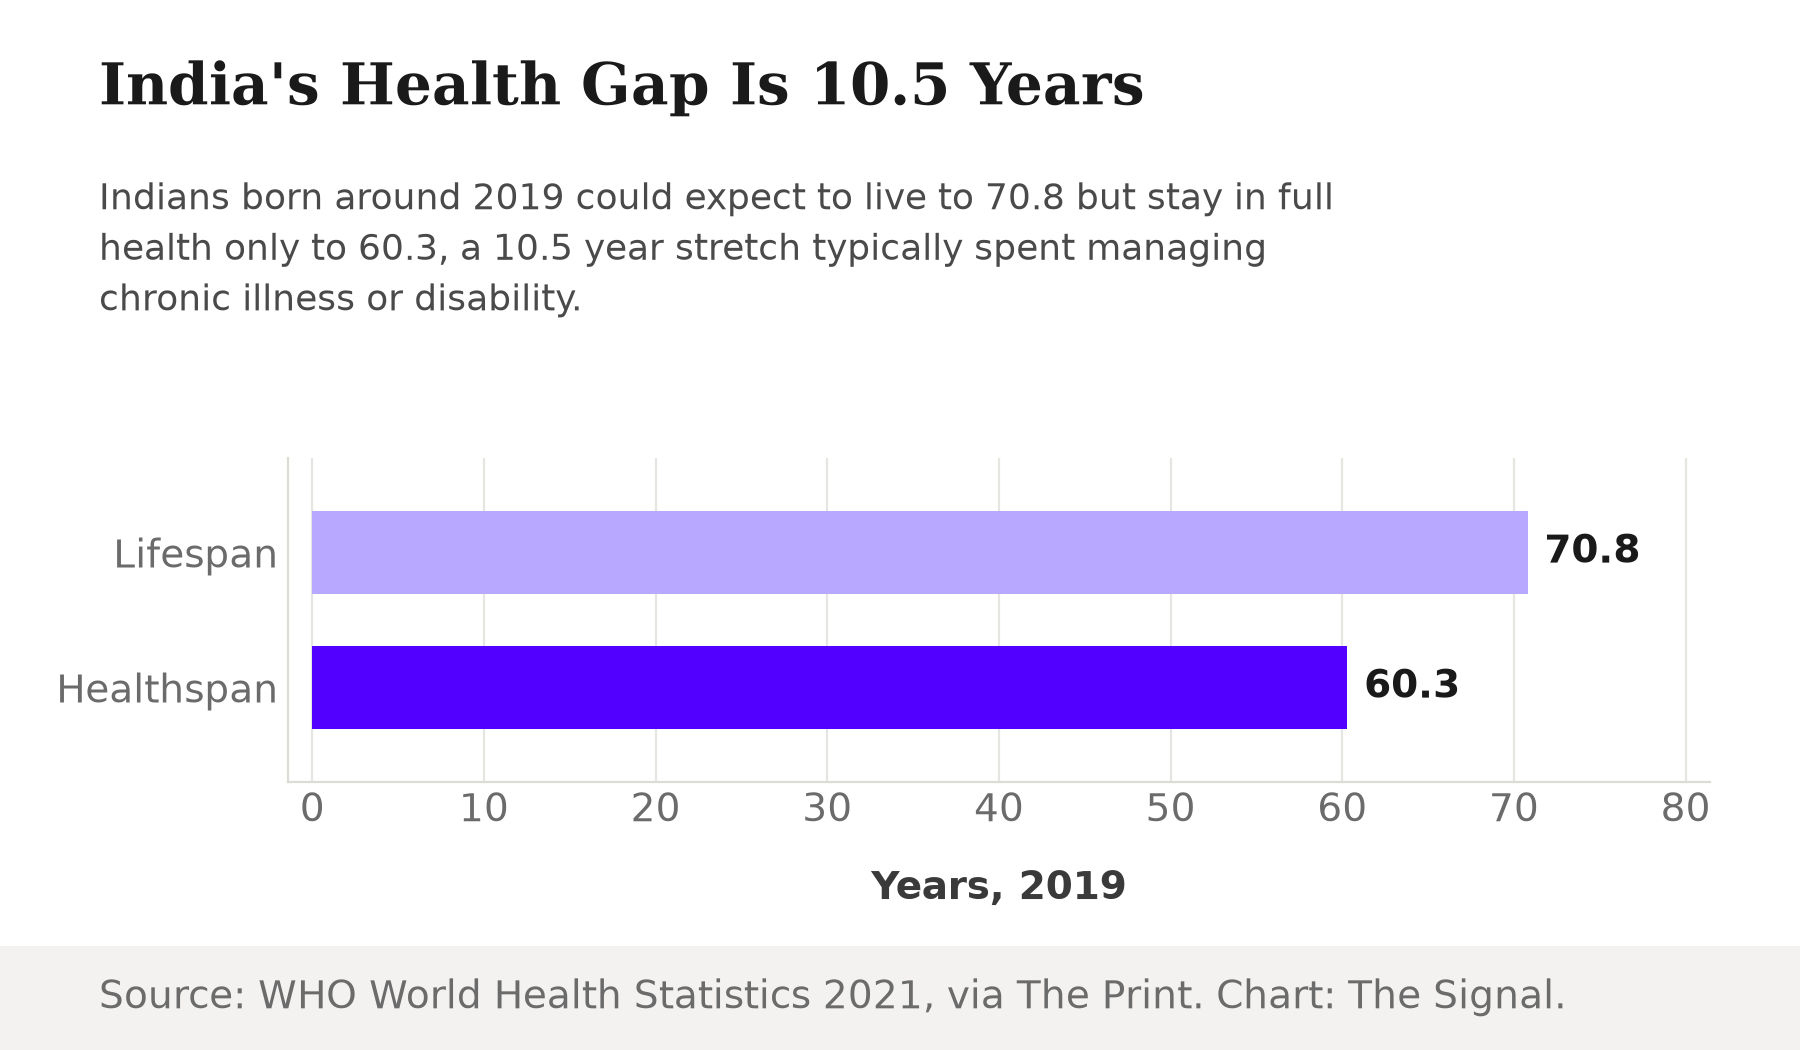
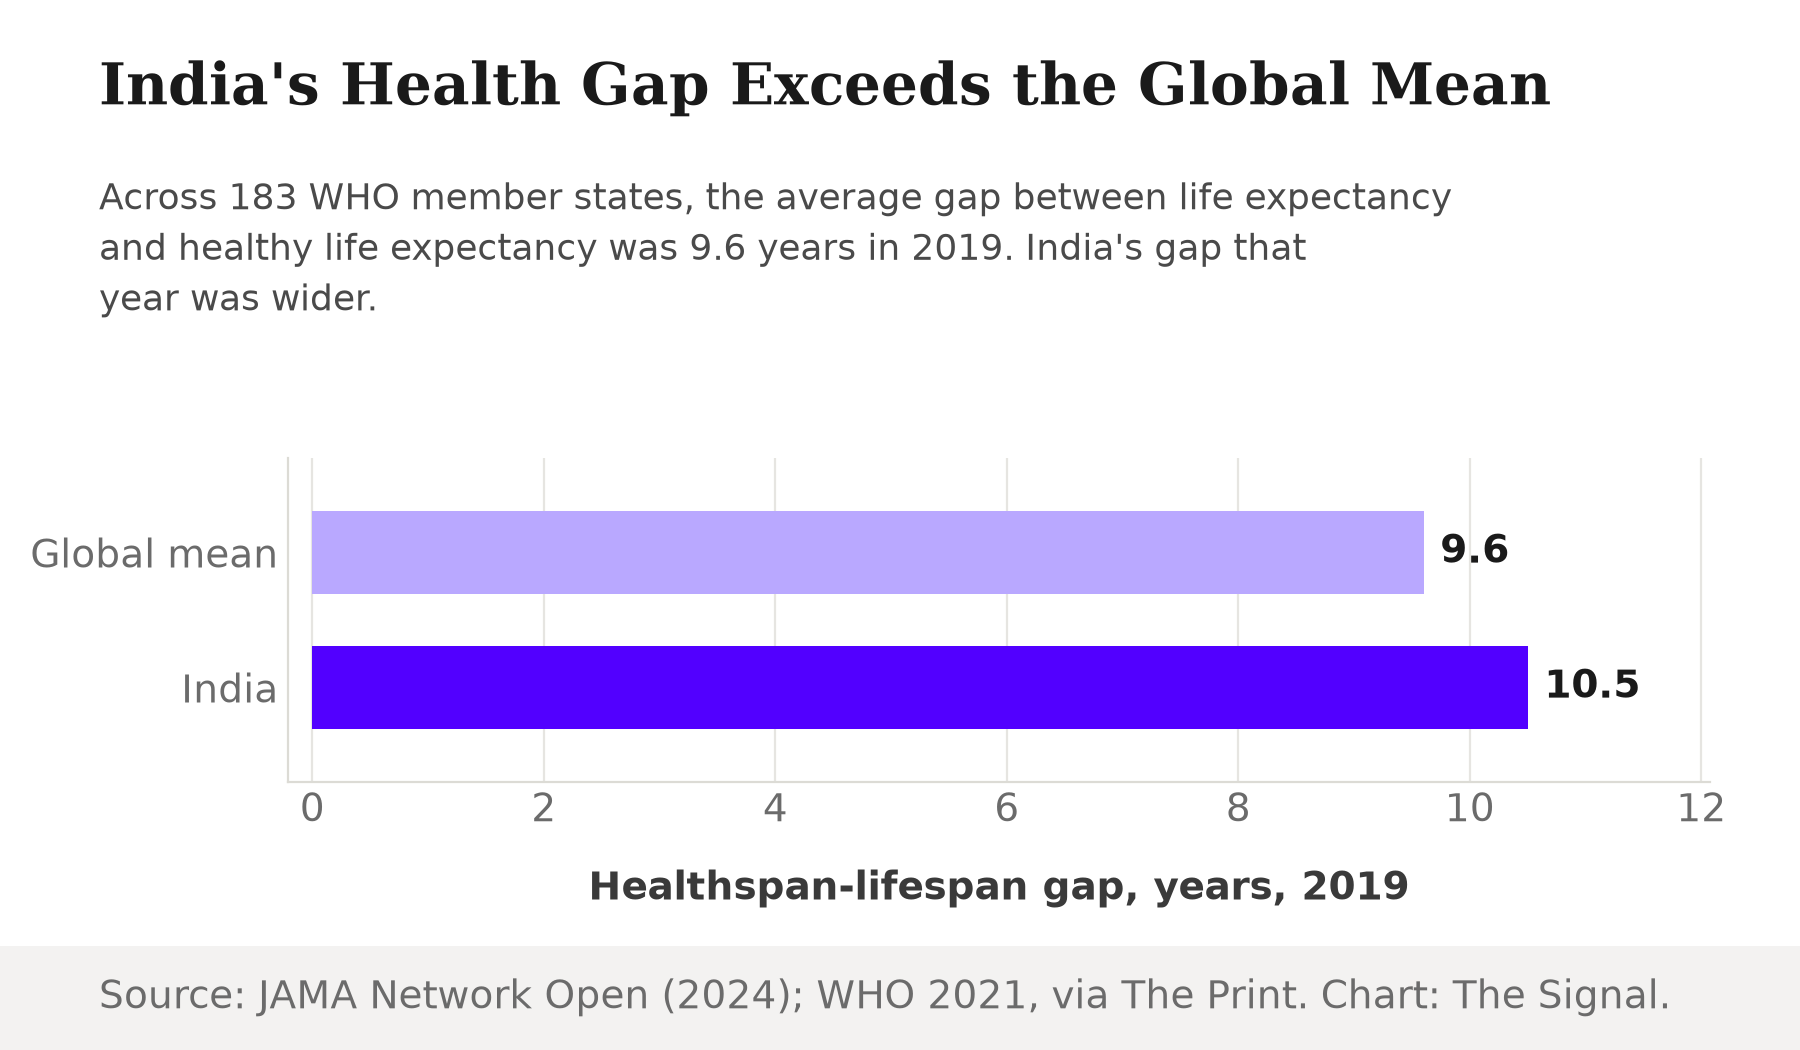
Start with 10.5. As of 2019, India's overall life expectancy stood at 70.8 years against a healthy life expectancy, the number of years a person can expect to live free of major disease or disability, of just 60.3, a 10.5-year gap, The Print reports, citing the WHO's World Health Statistics 2021. That is not a small shortfall. Across 183 WHO member states, the mean gap between life expectancy and healthy life expectancy was 9.6 years in 2019, a JAMA Network Open study analyzing all 183 WHO member states finds. India's 2019 gap ran wider than the world average, not narrower, and the world's own gap has not closed since: WHO's Global Health Estimates report found that global life expectancy fell to 71.4 years and healthy life expectancy fell to 61.9 years in 2021, both back to 2012 levels, 71.4 against 61.9, a gap of 9.5 years.
Where the Missing Years Go
The missing years are not a mystery, and they are not standing still. India's own healthy life years lost, the gap between life expectancy and healthy life expectancy, rose from 7.30 years in 2000 to 8.79 years in 2019, an increasing trend confirmed across every statistical method tested, a peer-reviewed study in Aging Medicine finds. Non-communicable diseases (heart disease, diabetes, chronic respiratory illness, cancer) caused 61.8% of all deaths in India in 2016, versus 27.5% from communicable, maternal, neonatal and nutritional diseases and 10.7% from injuries, the India State-Level Disease Burden Initiative reports in The Lancet. A more recent WHO estimate puts the NCD share higher still: 66% of all deaths in 2019, some 6.05 million deaths. The same estimate finds a 22% probability that an Indian would die prematurely, between the ages of 30 and 70, from one of the four main NCDs, WHO's Noncommunicable Diseases Progress Monitor 2022 reports. NCDs rarely end a life quickly. They extend it under management for years: a daily blood-pressure pill, an insulin regimen, a stent. Worldwide, noncommunicable diseases killed at least 43 million people in 2021, equivalent to 75% of all non-pandemic deaths that year, a WHO fact sheet reports. India's disease burden runs on the same NCD-heavy track as the rest of the world's, just with a healthspan gap that was already wider before the country's older population began to swell.
A Condition Nearly One in Four Men Carry
Hypertension is a useful, unglamorous example of what fills the gap. 24.0% of Indian men and 21.3% of women aged 15 and above have elevated blood pressure or are already on medication to control it, the National Family Health Survey-5 India Fact Sheet reports.
Nearly one in four Indian men has high blood pressure.
| Group | Adults with hypertension |
|---|---|
| Men | 24.0% |
| Women | 21.3% |
Adults aged 15 and above with elevated blood pressure or already on blood-pressure medication, 2019-21. Source: National Family Health Survey-5 India Fact Sheet.
Hypertension rarely kills quickly on its own. It sits for years, contributing to the stroke or heart attack that eventually ends a life, precisely the kind of chronic, managed year that separates life expectancy from healthy life expectancy.
The gender data sharpens the point. Indian women live 2.7 years longer than men on average, but the male-female difference in healthy life expectancy is just 0.1 years, meaning women in India do not necessarily lead healthier lives, The Print reports, citing the WHO's World Health Statistics 2021. The same pattern shows up globally: across the 183 countries in the JAMA Network Open study, women's healthspan-lifespan gap was 2.4 years larger than men's, the study reports. Almost all of the extra years women gain over men, in India and elsewhere, arrive as extra years of managed illness, not extra years of health.
The Population Meeting the Gap
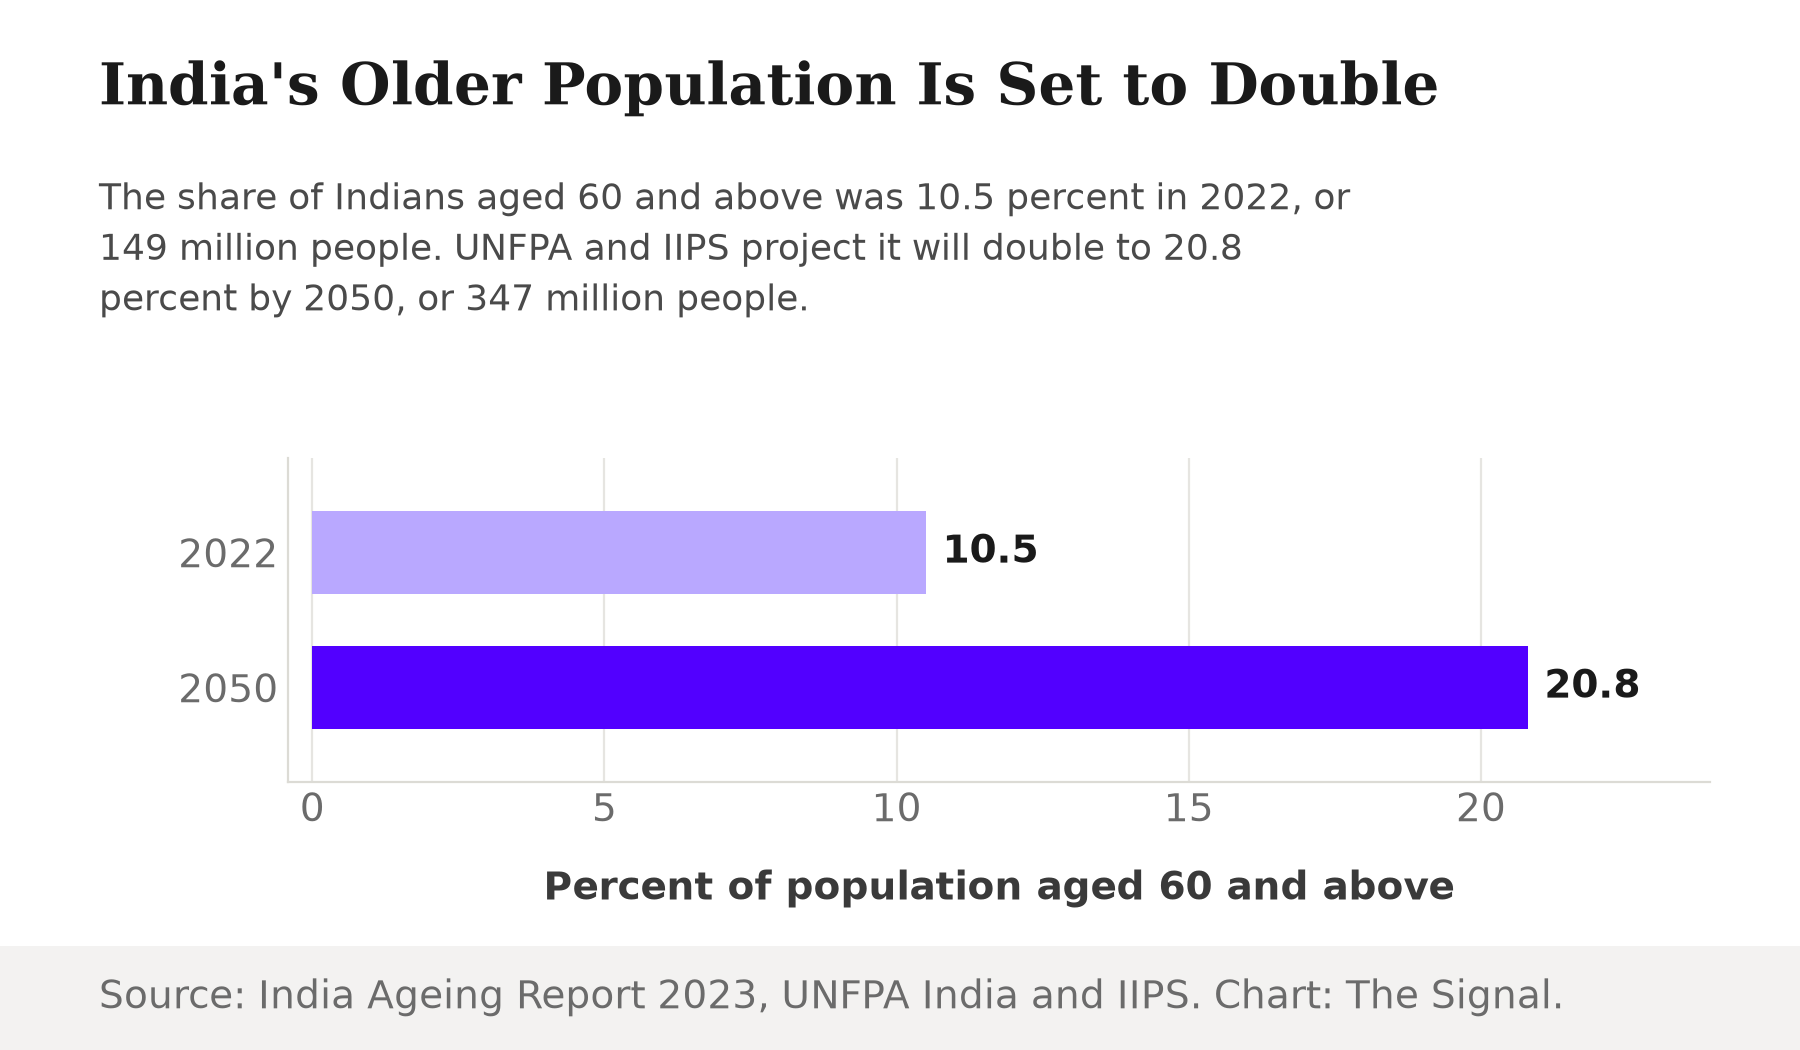
That gap is about to collide with demographics. India's 60-and-above population is projected to double as a share of the total, from 10.5% (149 million people) in 2022 to 20.8% (347 million people) by 2050, the India Ageing Report 2023 states. A larger elderly population does not simply mean more retirees. On India's own numbers it means a much larger population living through the specific 10.5-year stretch of managed illness the gap describes, at the same time, for the first time at this scale.
The Case That the Money Is Catching Up
The strongest case against reading this as a looming crisis is that India's public health financing is already moving to absorb it. Out-of-pocket spending, the share of health costs a household pays directly from its own pocket, fell from 64.2% of total health expenditure in 2013-14 to 43.4% in 2022-23, the Union Ministry of Health and Family Welfare's National Health Accounts estimates report, as government health spending rose to 1.9% of GDP in the FY2023-24 Budget Estimates, up from 1.4% in 2017-18, the Economic Survey 2023-24, as reported by the Finance Ministry, states.
India's government is absorbing more of the country's health bill.
| Metric | Earlier period | Latest period |
|---|---|---|
| Out-of-pocket share of health spending | 64.2% (2013-14) | 43.4% (2022-23) |
| Government health spending (% of GDP) | 1.4% (2017-18) | 1.9% (2023-24, Budget Estimates) |
Source: National Health Accounts estimates, Ministry of Health and Family Welfare; Economic Survey 2023-24, Ministry of Finance.
That is real progress worth taking at face value: a household today is less exposed to catastrophic spending on a chronic illness than a household a decade earlier was. Yet for NCD care specifically, the household bill has not shrunk the same way: households that used only private providers for NCD treatment paid an average of INR 2,761 out of pocket per treatment episode in 2017-18, twice what a public-only household paid and up from INR 2,550 in 2014, a BMC Public Health study using national survey data finds. The aggregate shift changes the payer nationally; it does not yet show up as a smaller bill for the chronic-disease patient buying private care, and it does not change how many healthy years a person gets. A shrinking out-of-pocket share can coexist with, and can even help fund, more years spent managing disease rather than free of it. It makes the burden more affordable, not shorter. The financing gap is closing faster than the health gap is.
The Signal
India's growth story counts years added; it rarely asks what those years are made of. A stretch of every life now runs on management rather than health, wider than the world's own average stretch, and the population living through it is set to more than double by 2050. The bill for that stretch is increasingly a public one, which is genuine progress, but a subsidised illness is still an illness. Watch what the newly public health rupee goes toward next: screening and prevention that catch hypertension before the heart attack would start compressing the gap itself; more spending that only treats the same gap for more people buys a bigger version of the same problem. Twenty years of added life is not the same achievement as twenty years of added health, and India now has the numbers to tell the two apart.
Reporting basis: India's life expectancy series is from the Registrar General of India's SRS-based life tables, as reported to Parliament and carried by PIB. India's healthy life expectancy figure and its gender comparison are from The Print's reporting of the WHO's World Health Statistics 2021, a single secondary source for those specific figures. India's own multi-year healthy-life-years-lost trend is from a peer-reviewed 2023 study in Aging Medicine modeling WHO data from 2000 to 2019. The global mean healthspan-lifespan gap and its gender-gap comparison are from a JAMA Network Open study analyzing all 183 WHO member states; the most recent global life expectancy and healthy life expectancy figures are from WHO's own Global Health Estimates report. The non-communicable disease death shares are from the India State-Level Disease Burden Initiative (ICMR, PHFI and IHME), published in The Lancet, for 2016, and from WHO's Noncommunicable Diseases Progress Monitor 2022 for the more recent 2019 estimate; the global NCD death toll is from a separate WHO fact sheet. The hypertension prevalence is from the National Family Health Survey-5 India Fact Sheet. The ageing population figures and projections are from the India Ageing Report 2023, UNFPA India and the International Institute for Population Sciences. The health-financing figures are from the Ministry of Health and Family Welfare's National Health Accounts estimates and the Economic Survey 2023-24; the NCD-specific out-of-pocket cost figures are from a BMC Public Health study analyzing NSSO survey data. The gap comparisons between India and the global mean are The Signal's calculations from those figures.