A White House Office of Trade and Manufacturing Policy report, published August 13, 2026 and titled "The Great Transshipment Scam," identifies more than 40 countries associated with elevated illegal transshipment risk from China. Inside that list, India sits in Tier 1, the report's "Diversified Scale Leaders" group, alongside Canada, the European Union, Israel, Japan, Mexico, South Korea and Taiwan. Read plainly, that is Washington widening its China tariff fight to the countries reshaping trade routes around it, with India named on the list.
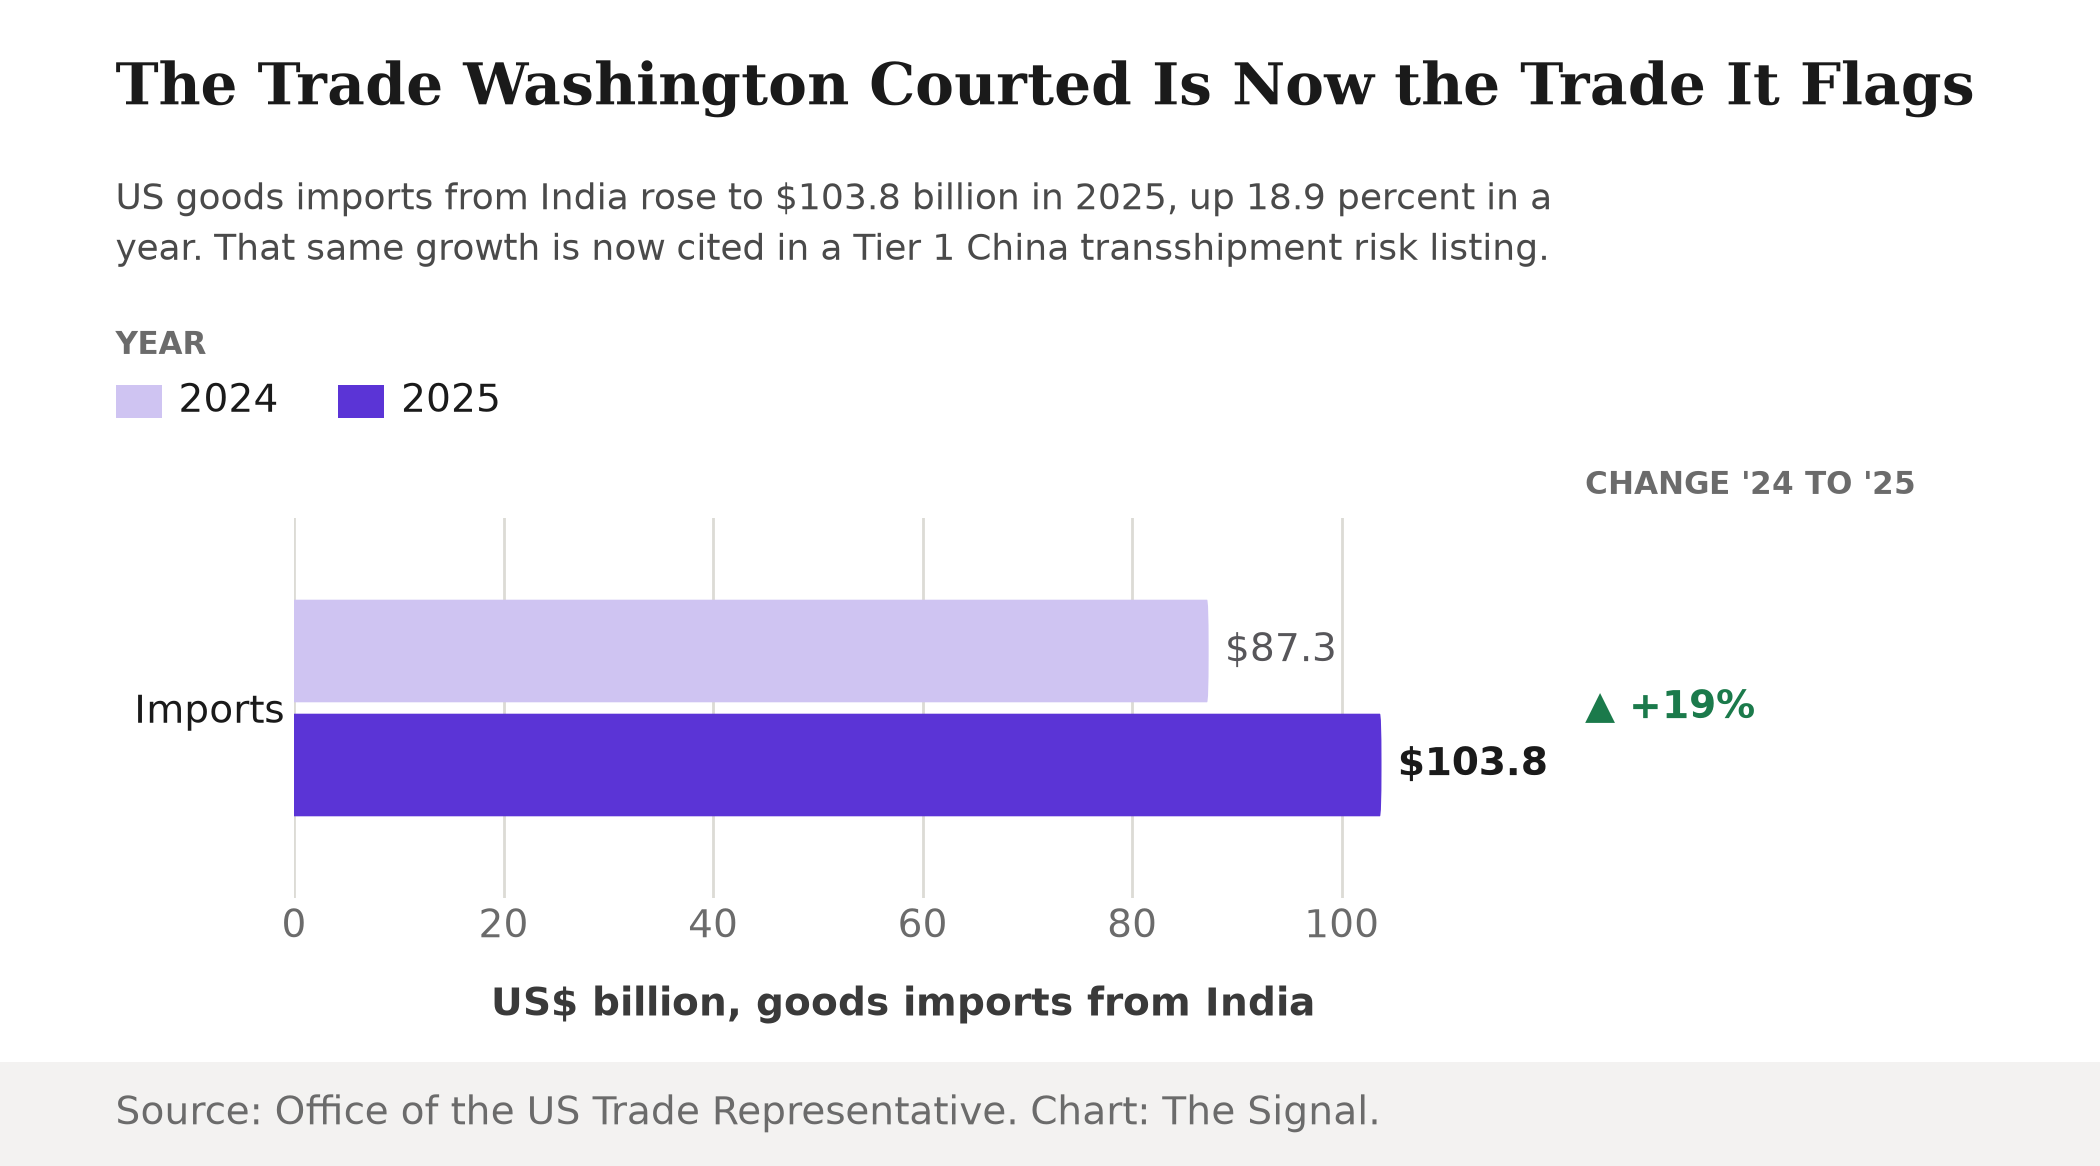
It is worth slowing down on the timing. Six months earlier, on February 6, 2026, the US had cut its reciprocal tariff on Indian goods to 18 percent under a new bilateral trade framework, a discount meant to make India a more attractive alternative to Chinese manufacturing. US goods imports from India climbed to $103.8 billion in 2025, up 18.9 percent, or $16.5 billion, from 2024, widening the US-India goods trade deficit to $58.2 billion. That is not a coincidence the report ignores. It is the same growth curve the White House is now treating as a risk indicator.
US imports from India grew nearly 19 percent in the year before the Tier 1 listing.
What the report actually says about India
The hard, India-specific numbers in the report are thinner than the Tier 1 label suggests. Using strict transaction-level matching, the Commerce Department's Office of Trade and Economic Analysis found about $67 billion in goods transshipped from China through the top three hubs, Mexico, India and Vietnam, in 2025, producing an estimated $28 billion in lost tariff revenue. That figure is split three ways, not assigned to India alone. The report's one concrete India example is a specific supply chain: India's Pune-Gujarat-Chennai industrial belt exports pumps and compressors under HS codes 8413 and 8414. The report pairs that belt with the Cincinnati-Dayton-Columbus corridor in the US, the American manufacturing region facing that pressure. Beyond the shared hub number and that one product pairing, the report does not publish a standalone dollar estimate of transshipment through India.
A problem measured with a sevenfold error bar
The report's own uncertainty is wide enough to notice. Five independent government and private-sector analyses estimate annual China-linked illegal transshipment at between $40 billion and $303 billion, a more than sevenfold spread, with Goldman Sachs at the low end and Altana at the high end.
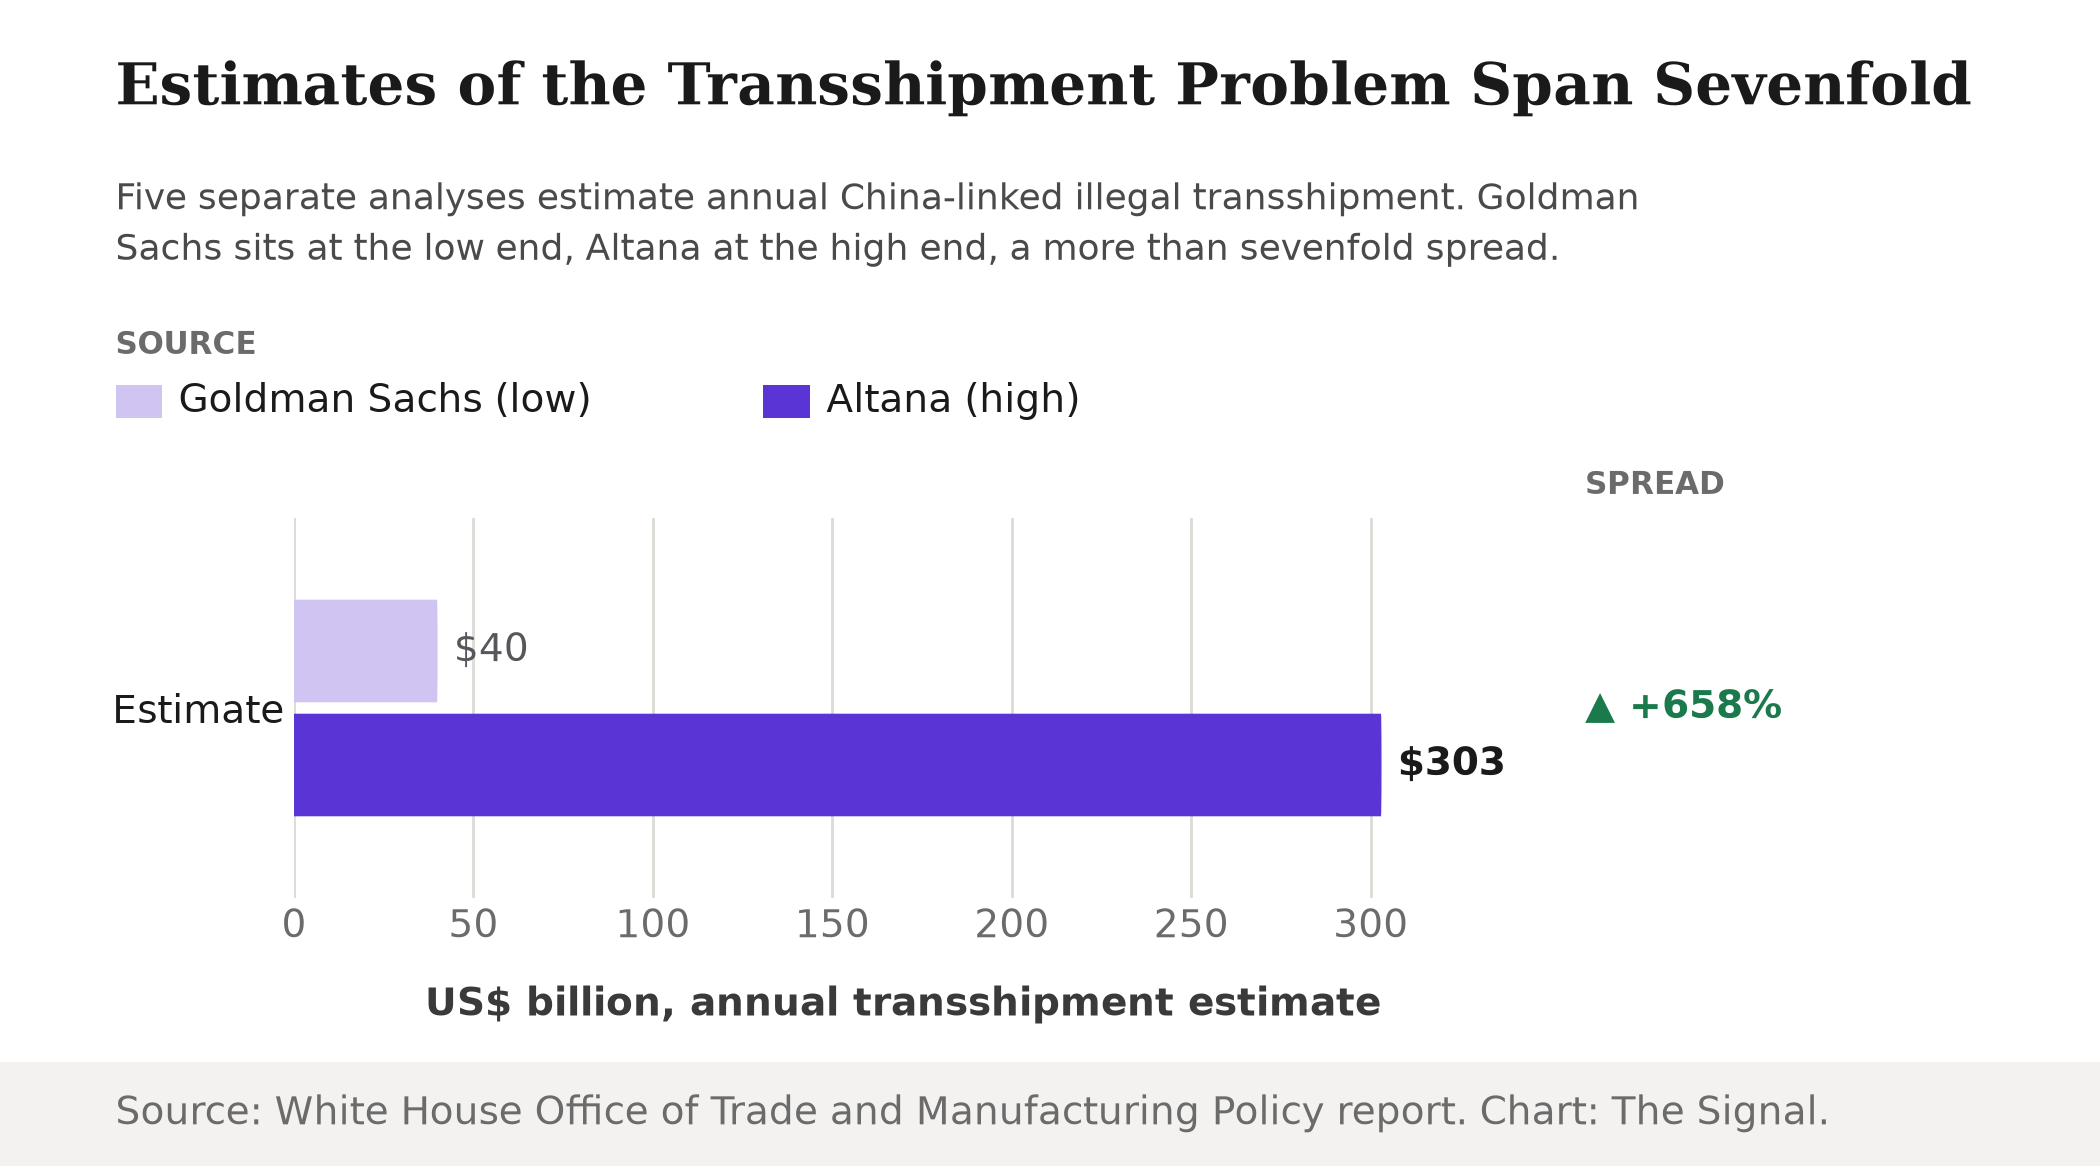
From that range, the report picks a midpoint and builds a national impact case. In its central case of $75 billion in annual illegal transshipment, the report projects roughly 450,000 US jobs displaced, $113 billion to $150 billion in reduced annual GDP, and $19 billion to $26 billion in lost federal revenue, built on Exiger's February 2026 shipment-flow analysis.
The White House's central-case toll, nationwide
| Metric | Central-case estimate |
|---|---|
| Jobs displaced | About 450,000 |
| Annual GDP loss | $113 billion to $150 billion |
| Annual federal revenue loss | $19 billion to $26 billion |
Source: White House Office of Trade and Manufacturing Policy report, citing Exiger's shipment-flow analysis.
None of these three figures, the $75 billion central case, the job count or the revenue loss, is broken out by country. They describe the whole 40-country problem, not India's contribution to it.
The enforcement trend is real, and it is not about India
Separate from the country tiers, the report cites customs data that is easier to verify and harder to dispute. CBP data show shipments flagged for post-release discrepancies rose 245 percent, from 93,744 to 323,677, while associated revenue assessments rose 169 percent, from $9.6 billion to $25.8 billion, comparing the 526-day periods before and after the Trump inauguration.
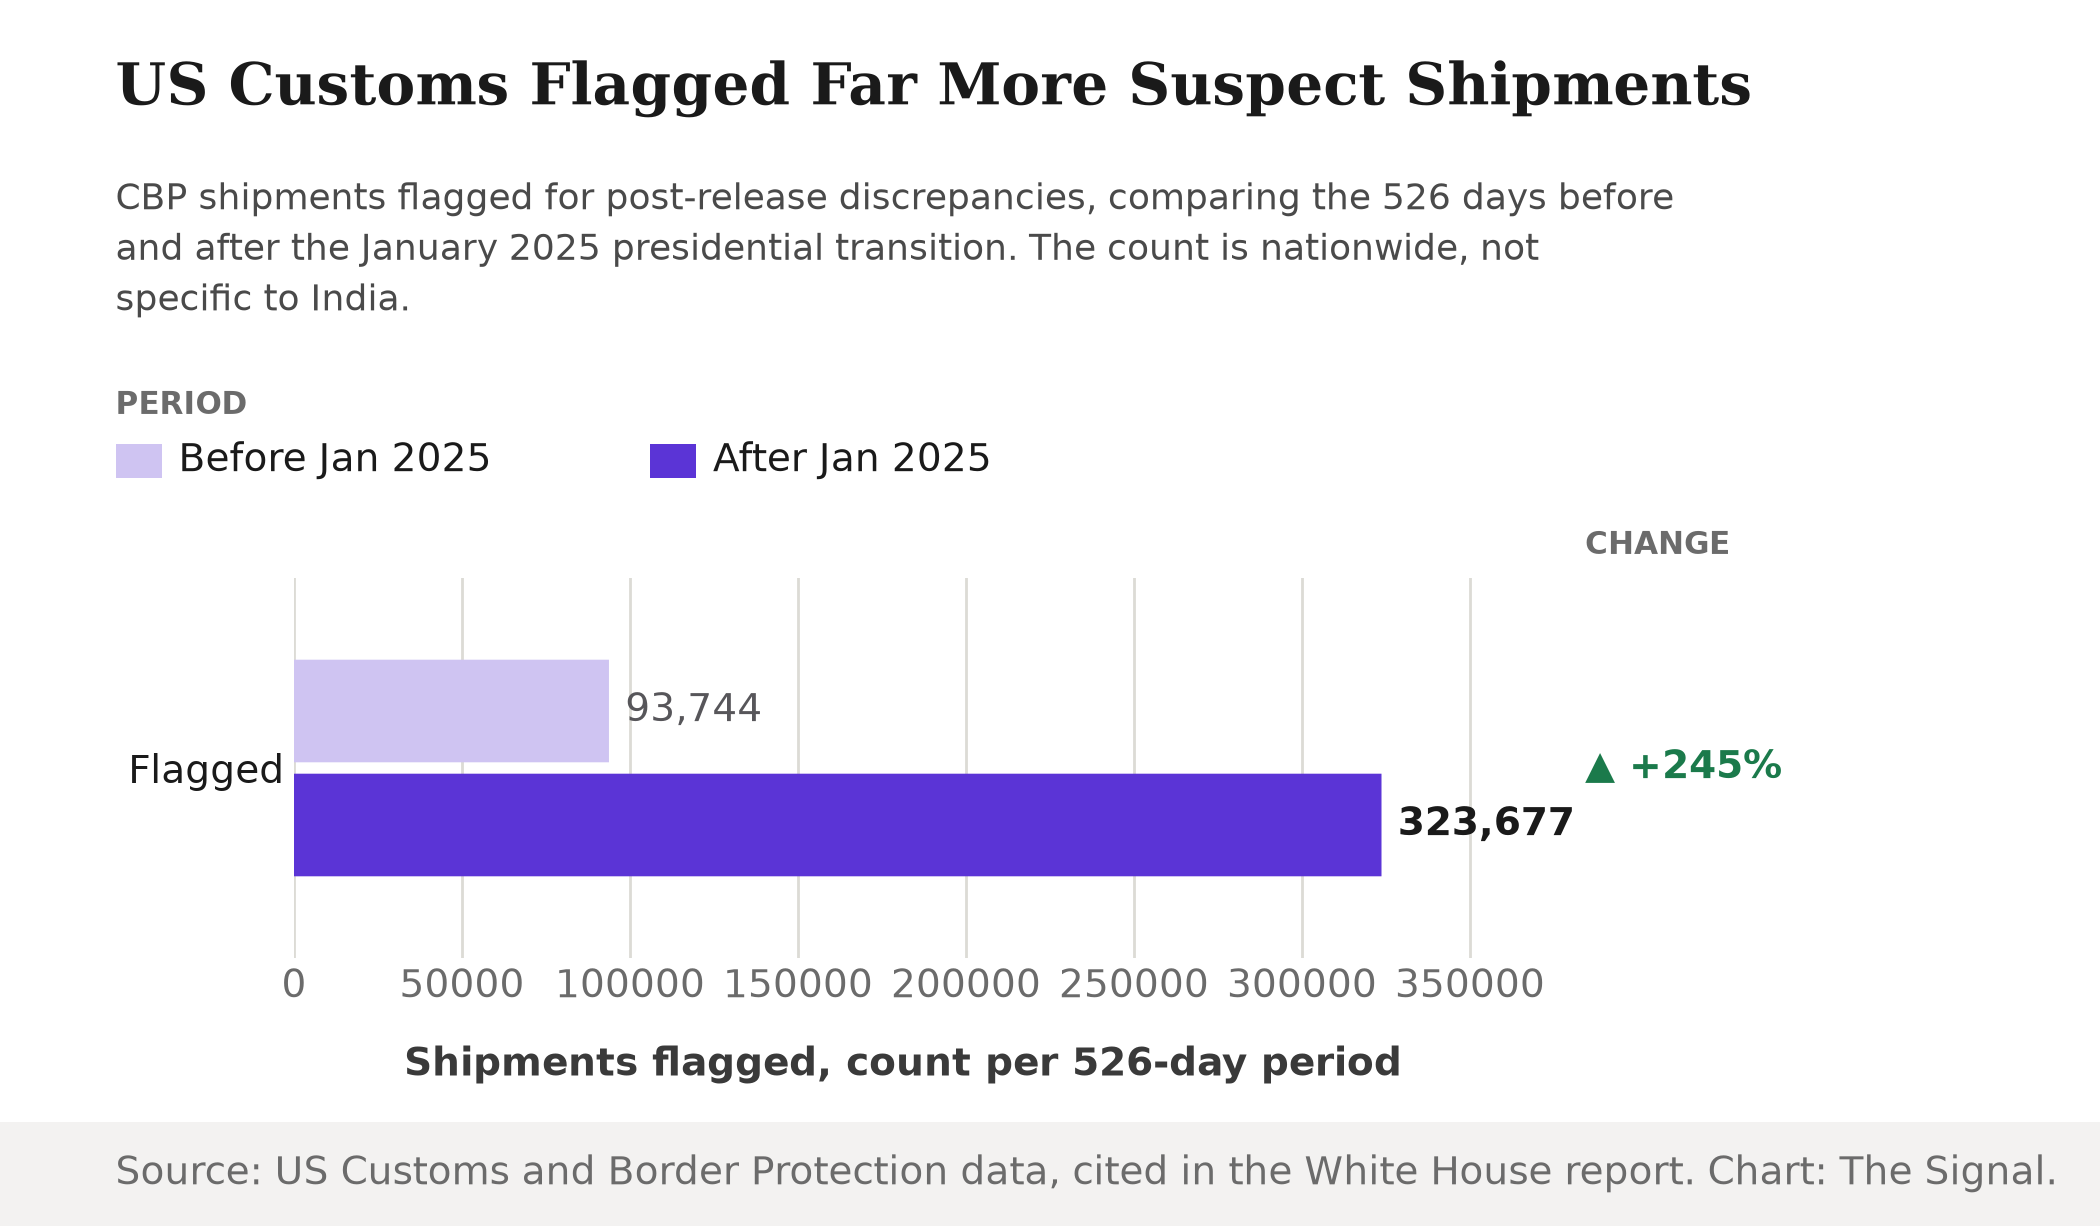
That is a genuine, verifiable enforcement trend: US customs is catching more mismatched shipments and assessing more money against them nationwide. But it is not broken out by origin country either, so it says nothing specific about India's share of it.
The honest objection
The strongest case for taking India's Tier 1 placement seriously is that the rerouting dynamic behind it is real and well documented, not a new theory built for this report. President Trump's July 2018 Section 301 tariffs covered nearly 70 percent of Chinese exports to the US, roughly $370 billion in goods, and triggered the years-long rerouting the White House now calls the Great Reallocation, the same shift that built India's, Vietnam's and Mexico's roles as alternative suppliers in the first place. And the $67 billion hub estimate is not a top-down guess: it comes from Commerce matching shipment records at the transaction level, a more rigorous method than the estimates that produce numbers as far apart as $40 billion and $303 billion. On that reading, the country whose US trade grew fastest is exactly the country that deserves the closest look, because the same routes that carry legitimate manufacturing growth are the routes a reroute would use too.
That case does not, however, tell us how much of India's growth is manufacturing capacity, tariff arbitrage or something else. The hub estimate treats Mexico, India and Vietnam as one number. Without a country-specific breakdown, Tier 1 measures how large and diversified a trading relationship with the US has become, not how much of it is a Chinese good moving through an Indian port.
The Signal
Two things are true of India's Tier 1 placement, and they are not really in tension despite how the label reads. The US spent early 2026 courting the same India trade growth it is now flagging by August, because a booming trade relationship and a transshipment risk look identical from outside the shipment data: more containers, more categories, more dollars, moving faster than before. What would resolve the ambiguity is a country-specific number, not a hub figure split three ways with Mexico and Vietnam. Watch for whether Commerce ever publishes an India-only transshipment number, and whether the Tier 1 label survives contact with India's own trade negotiators, now armed with a concrete reason to ask for one. Until that number exists, a rising trade chart and a risk chart are being drawn from the same line.
Reporting basis: the Tier 1 designation, the 40-country count, the central-case loss projection, the five-analysis range, the Pune-Gujarat-Chennai supply chain pairing and the CBP enforcement figures are all from the White House Office of Trade and Manufacturing Policy's August 13, 2026 note "The Great Transshipment Scam," which in turn names Exiger's shipment-flow work for the central case and Goldman Sachs and Altana for the outer bounds of the five-analysis range. The $67 billion hub figure and its $28 billion revenue-loss estimate come from the Commerce Department's Office of Trade and Economic Analysis, as relayed in that same document. The February 2026 tariff-cut framework is from a White House joint statement. The 2025 trade totals, the year-on-year change and the deficit figure are from the Office of the US Trade Representative. The 2024 import baseline is The Signal's calculation, derived from the 2025 total and its year-on-year change.