The earnings season for July to September 2026 has produced the headline every bull wanted. The Nifty-50's net profit grew 27% year on year in the quarter, its fastest pace in 17 quarters, according to Motilal Oswal Financial Services' tally of results. The brokerage's wider universe of 398 companies did better still, with profit up 32% and sales up 25%. Read the top line and corporate India is in a boom.
It is worth slowing down on that. Every one of those growth rates is nominal, and the quarter they describe was not a normal one for prices. Wholesale price inflation ran at 9.78% in July, 9.92% in August and 11.39% in September 2026, per the Office of the Economic Adviser in the commerce ministry. Then October's reading rose to 12.29%, a third straight monthly increase. Profits measured in rupees rise when the rupee buys less, even if nobody sells an extra tonne.
How much of the 27% is price
The wholesale price index (WPI) tracks what producers charge for goods at the factory gate and the mine mouth. The three monthly readings for July to September 2026 published by the Office of the Economic Adviser average 10.4% for the quarter. Deflate the Nifty-50's 27% profit growth by that average and real growth comes to about 15%. Roughly 12 of the 27 points, or 44% of the headline, is price (our calculation).
Sales show the same pattern more sharply. Nifty-50 sales rose 22% and EBITDA, or operating profit, rose 19%. Against 10.4% wholesale inflation, real sales growth is about 10.5%, so price accounts for about half of the reported 22%.
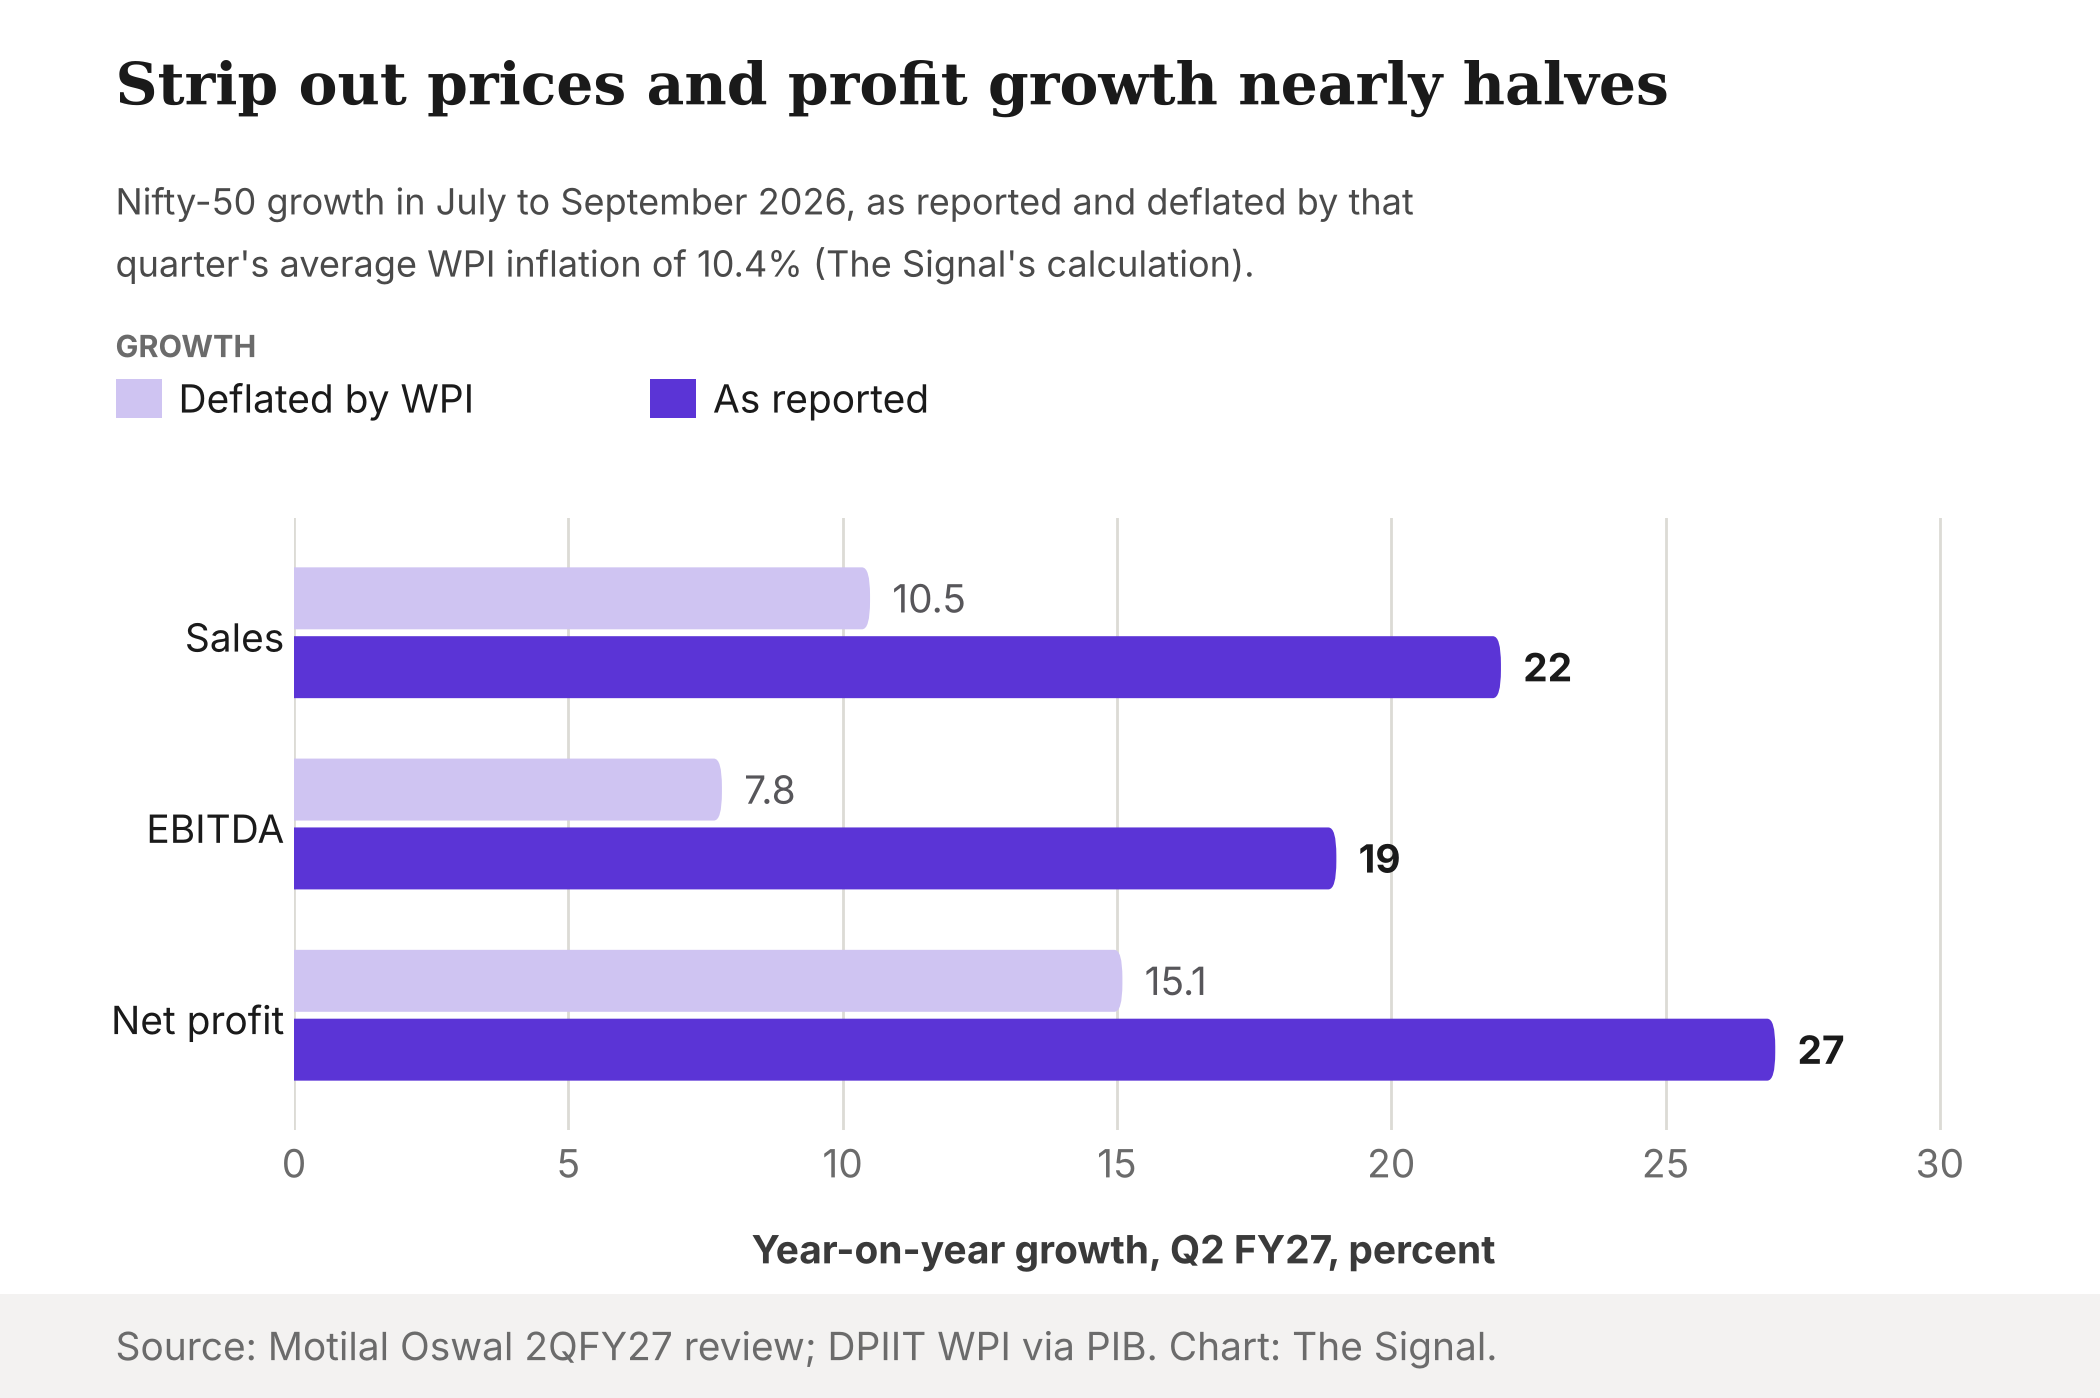
Source: Motilal Oswal, India Strategy Review 2QFY27; Office of the Economic Adviser, via PIB. Deflated figures are The Signal's calculation. Chart: The Signal.
A real 15%, carved out of 27% nominal profit growth, is still a strong quarter. The point is narrower than "the boom is fake": a large slice of it is the price level showing up on income statements.
The inflation has an address
The price surge is not spread evenly, and neither are the profits. In the official October 2026 release, fuel and power inflation jumped to 32.84% from 25.85% in September, while manufactured products eased to 9.54% from 9.76%. The group-wise annex is more striking. Crude petroleum and natural gas prices were up 70.80% year on year, mineral oils 45.57%, chemicals 17.53% and basic metals 17.21%.
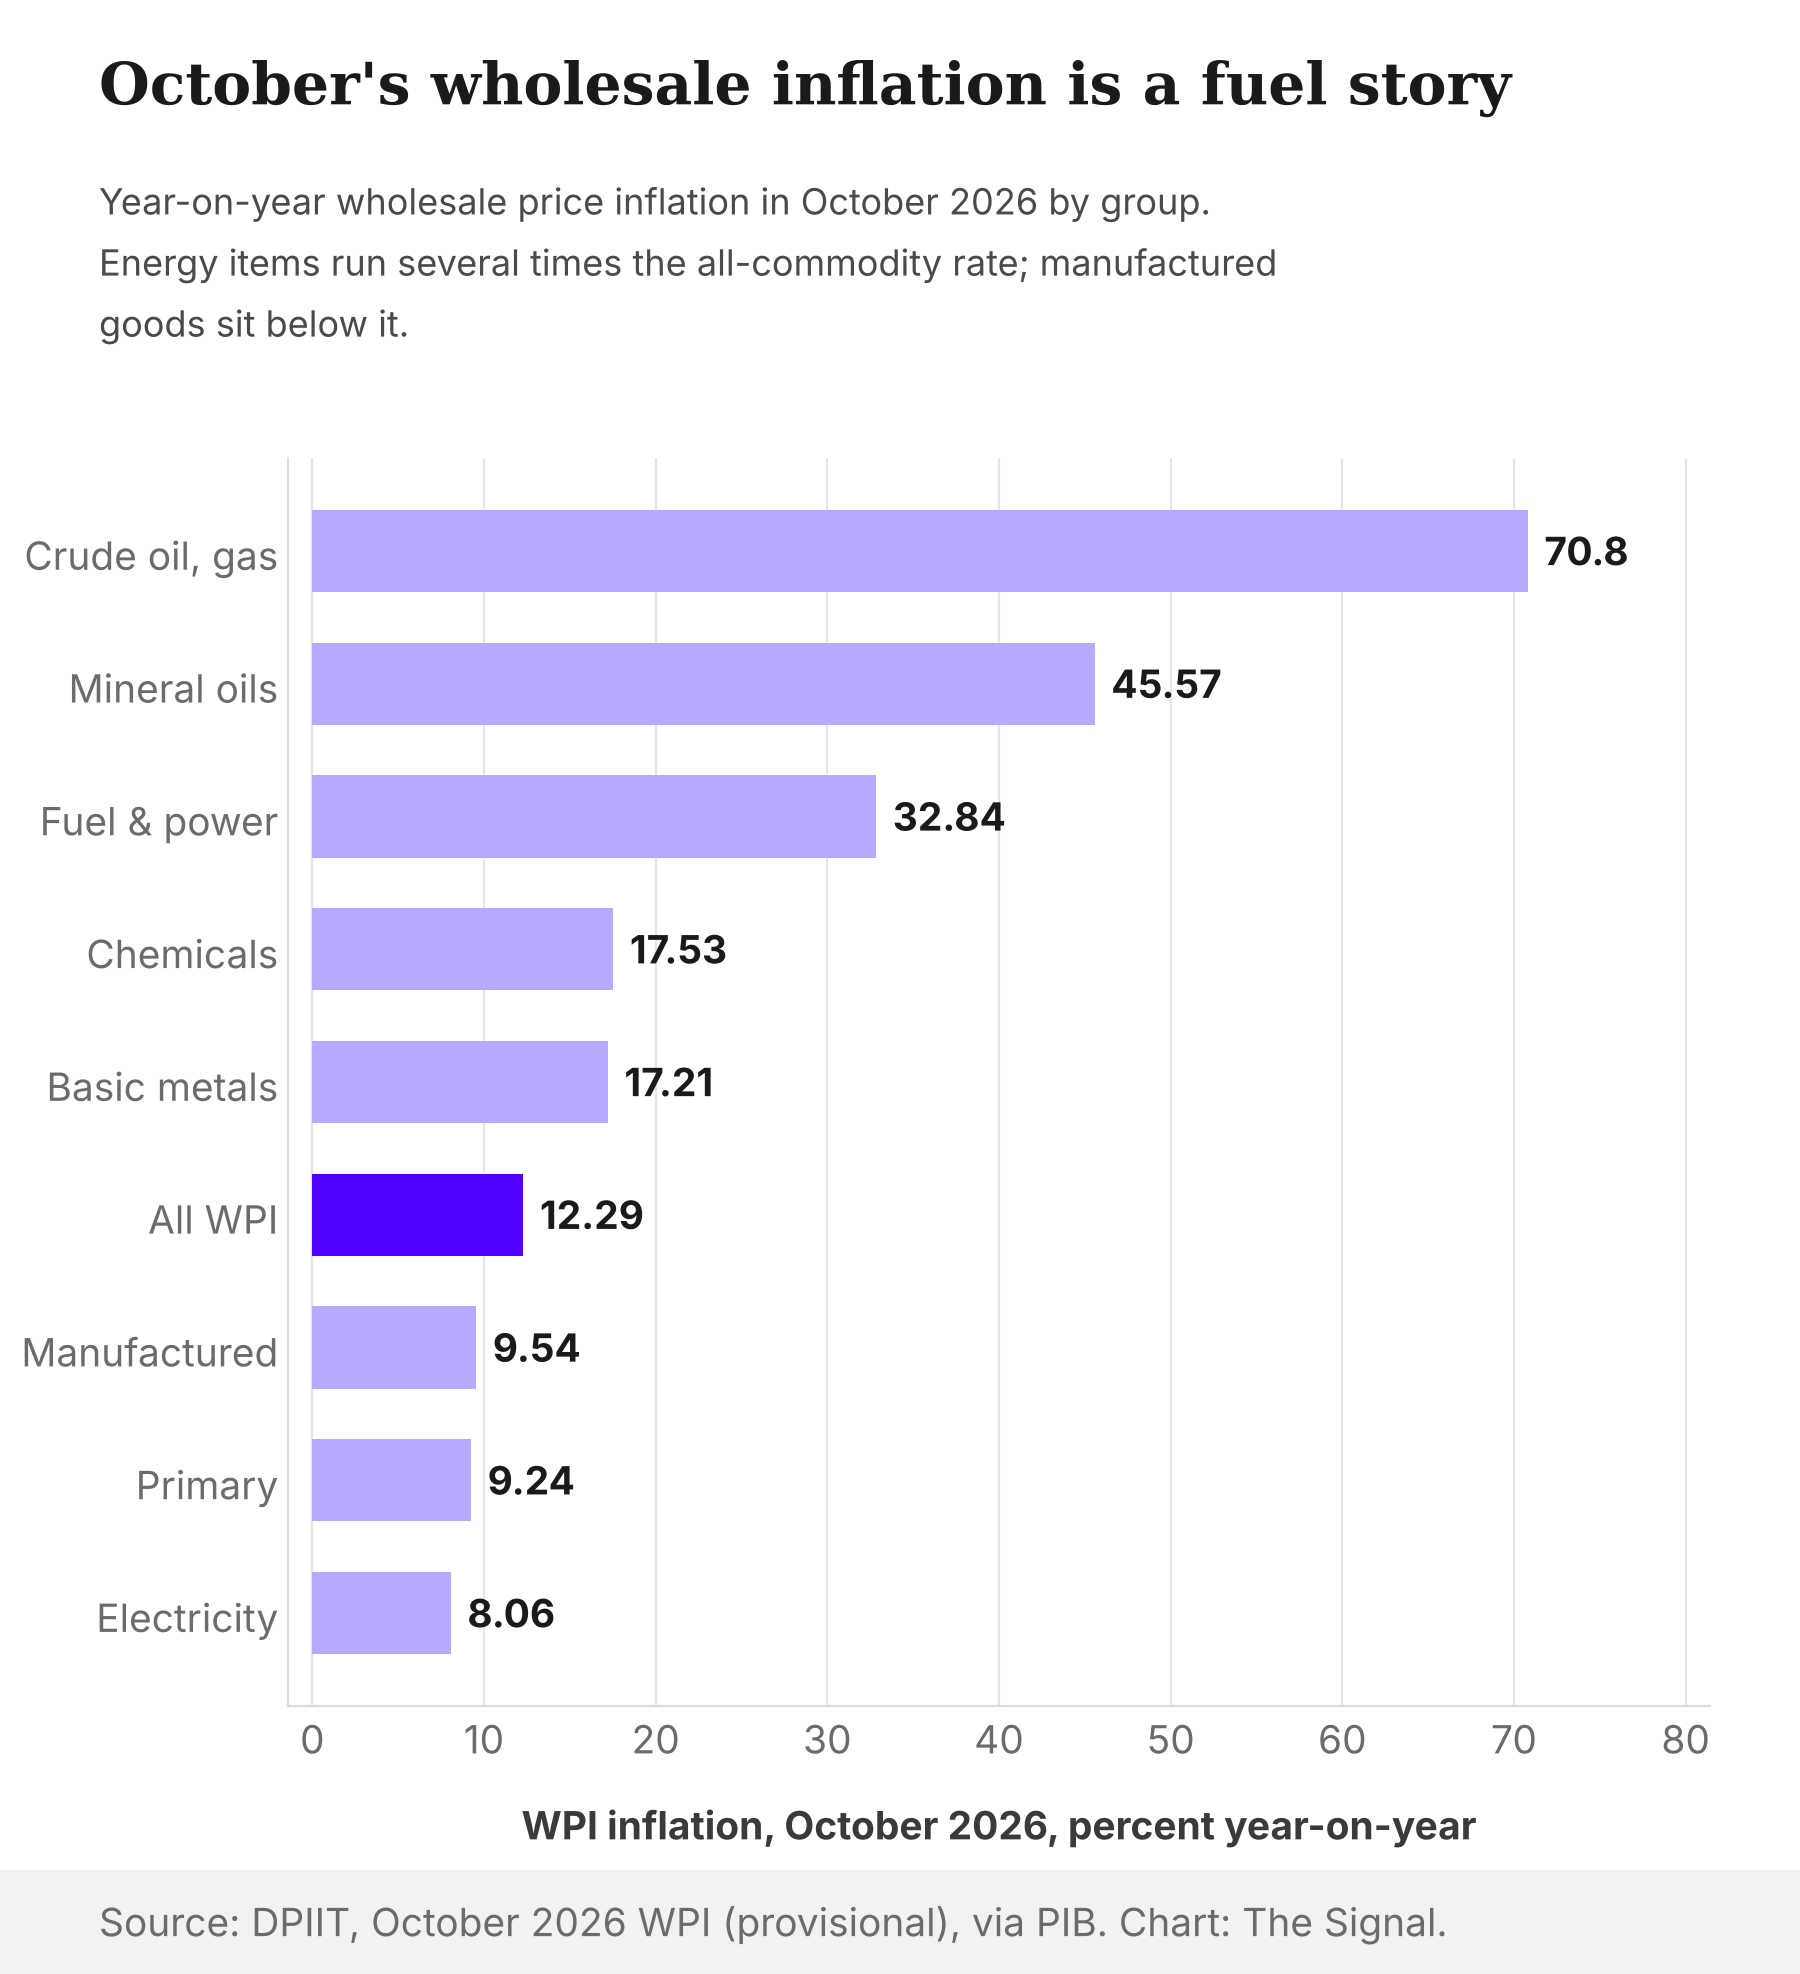
Source: Office of the Economic Adviser, via PIB; group-wise annex. Chart: The Signal.
This is not a one-month spike. Cumulative wholesale inflation for April to October 2026-27 was 10.14%, with fuel and power at 26.37%, The Tribune reports, citing commerce ministry data.
Now line that up against where the profit came from. In Motilal Oswal's sector table for the July to September 2026 quarter, Metals profit rose 78%, Oil & Gas 55% and Utilities 40%. The sectors that sell the inflating goods posted the fastest profit growth by a wide margin.
They also supplied much of the money. Metals added INR 209 billion to year-on-year profit in Motilal Oswal's universe, the most of any sector, followed by oil and gas excluding the state fuel retailers at INR 163 billion, with utilities adding INR 61 billion. Set against that universe's total profit, excluding the fuel retailers, of INR 4,237 billion, up 30%, the three sectors account for more than two-fifths of the quarter's profit gain (our calculation).
Physical output did not grow anything like as fast. In September 2026, steel output rose 4.9% and refinery products 10.3% year on year, Business Today reported, citing provisional commerce ministry data. A 78% profit jump in metals on roughly 5% more steel is a story about price and margin, not tonnes.
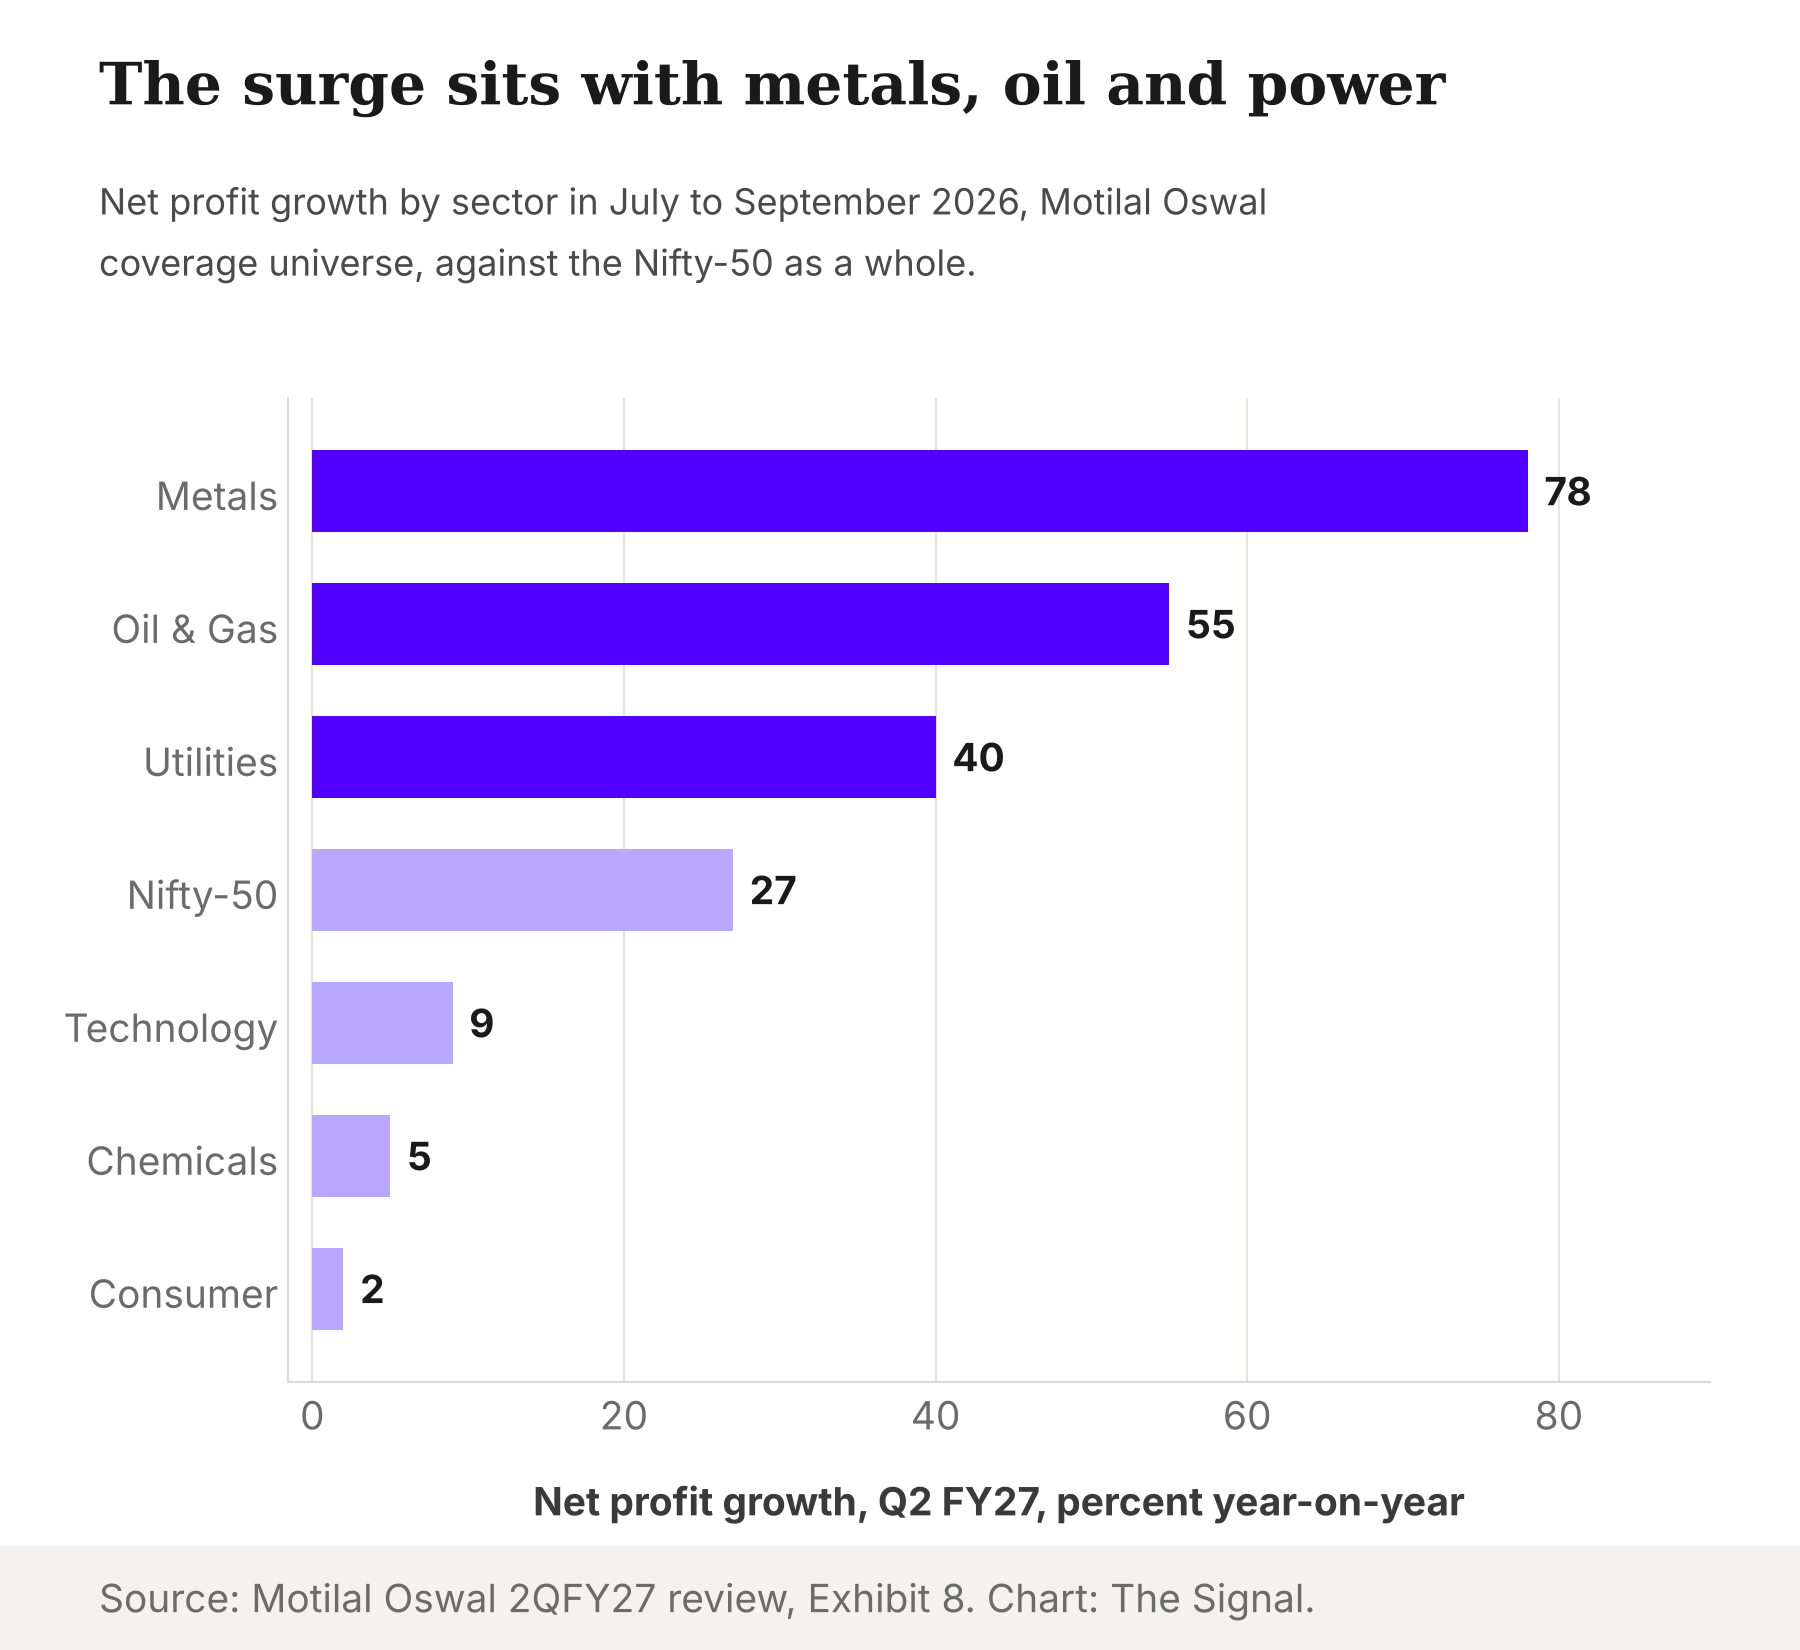
Source: Motilal Oswal, India Strategy Review 2QFY27. Chart: The Signal.
Concentration shows up at the company level too. Reliance Industries, ONGC, Tata Motors PV, JSW Steel and SBI together contributed 46% of the Nifty's year-on-year earnings gain in July to September 2026. Reliance, ONGC and JSW Steel sit squarely in oil, gas and steel.
Downstream, the margins thin
If upstream sellers gained from higher prices, someone paid them. The sector data are consistent with buyers absorbing the cost, though they do not prove it.
In Chemicals and Consumer, sales grew far faster than profit. Motilal Oswal's 2QFY27 sector table shows the gap.
| Sector (Motilal Oswal universe) | Sales growth, % YoY | EBITDA growth, % YoY | Net profit growth, % YoY |
|---|---|---|---|
| Metals | 28 | 47 | 78 |
| Oil & Gas | 34 | 36 | 55 |
| Utilities | 23 | 17 | 40 |
| Chemicals | 25 | 13 | 5 |
| Technology | 13 | 11 | 9 |
| Consumer | 14 | 3 | 2 |
| Nifty-50 | 22 | 19 | 27 |
Q2 FY27 (July to September 2026), year-on-year. Source: Motilal Oswal, India Strategy Review 2QFY27, Exhibit 8.
Consumer companies grew sales 14% but operating profit only 3%. Chemicals is the telling case. Its own wholesale prices rose 17.53% in October 2026, while crude petroleum and natural gas rose 70.80%, yet the sector's profit grew just 5% in July to September, a squeeze consistent with feedstock rising far faster than finished product prices. Across the index, the Nifty's EBITDA margin excluding financials contracted 30 basis points year on year to 19.8% in July to September 2026. A genuine demand boom widens margins. This quarter narrowed them.
The honest objection
The strongest case against this reading is that WPI is the wrong deflator for the Nifty. The index is heavy with banks, software exporters and consumer brands whose revenues are not wholesale goods prices. The economy-wide price measure tells a gentler story: in April to June 2026, real GDP grew 7.8% and nominal GDP 10.3%, a gap of just 2.5 percentage points, per the National Statistics Office. Retail prices point the same way. Consumer price inflation was 4.45% in July, 4.83% in August and 5.54% in September 2026, per the National Statistics Office, an average of about 4.9% for the quarter. Deflated by that, the Nifty's 27% becomes about 21%. Use either gentler measure and the 27% looks largely real.
That case is right for the parts of the Nifty that did not lead the quarter, and wrong for the parts that did. Technology and Consumer profits grew in single digits, so a softer deflator barely changes the total for them. The growth came from metals, oil and power, where WPI is precisely the right yardstick. For those sellers, the relevant price indices ran well above 12.29%, at 17.21% for basic metals and 45.57% for mineral oils in October 2026. Where the beat was concentrated, the price share is larger than the headline average implies. The GDP figure also covers April to June, an earlier quarter, before wholesale inflation climbed past 11%.
The policy squeeze
Price-led profits are exposed to whatever brings prices down, and the Reserve Bank has already moved. At its October 5 to 7, 2026 meeting the RBI's Monetary Policy Committee voted unanimously to raise the repo rate by 25 basis points to 5.50% and changed its stance to "calibrated tightening". The committee projected CPI inflation at 6.0% for October to December 2026. Retail inflation for October 2026 came in at 6.09%, with food prices up 8.94%, per the National Statistics Office, so the first month of that quarter already ran above the RBI's 6.0% projection.
The market's optimism rests on nominal earnings. In April 2026, Morgan Stanley retained a December 2026 Sensex target of 95,000, with a base case that Sensex earnings compound at 17% a year through FY2028, Business Today reported. That April note predates the price surge of July to September 2026. Motilal Oswal's November 15 report lists the Sensex at 81,592, so reaching 95,000 by December would take a gain of about 16% in roughly six weeks. Sensex profit grew 18% in July to September 2026, comfortably on that path in nominal terms. Deflated by the quarter's 10.4% average wholesale inflation, it is about 7%.
The Signal
The 17-quarter high is real, and so is the inflation inside it. About 44% of the Nifty's 27% profit growth is the price level, and the rest leans on the companies that sell fuel, metal and power. That makes the quarter's strength and its fragility the same thing. If fuel and power inflation, at 32.84% in October 2026, stays high, downstream margins keep thinning and the RBI keeps tightening. If it reverses, the upstream profits that carried the quarter reverse with it. Watch the November and December wholesale prints against October to December results: profit that holds up as fuel inflation cools is volume, and profit that falls with it was price. A boom measured in rupees is only as strong as the rupee it is measured in.
Reporting basis: wholesale price inflation for July through October 2026, including the October group-wise annex, is from the Office of the Economic Adviser, DPIIT, via PIB releases; the April to October 2026-27 cumulative figures are per The Tribune, citing commerce ministry data. Retail CPI for July to October 2026 and Q1 2026-27 GDP are from the National Statistics Office, MoSPI, the July to September CPI and GDP figures via PIB. September 2026 steel and refinery output is per Business Today, citing provisional commerce ministry core-industries data. Nifty-50, Sensex and sector earnings, margins, contribution shares and the November 2026 Sensex level come from a single origin, Motilal Oswal Financial Services' India Strategy Review 2QFY27, a brokerage's own tally of company results that no second independent tally here corroborates. The policy rate decision and CPI projection are from the RBI's MPC minutes. The Morgan Stanley Sensex target is per Business Today's April 2026 report of the brokerage's note. The 10.4% quarterly WPI average, the 4.9% quarterly CPI average, the deflated growth rates, the 44% price share, the sector share of the profit gain and the distance to the 95,000 target are The Signal's calculations from those figures.