On November 13, 2026, MoSPI put out a paper that asks a large question: how much of India's economy is made of knowledge? The answer it proposes is not one number. MoSPI's Committee on Knowledge Systems, chaired by Ratan P. Watal, recommends a family of thematic accounts consistent with the 2025 System of National Accounts, covering human capital, R&D, the creative economy, AI systems, data, high-tech products and the digital economy. It says India can start with three of them: R&D, the digital economy and the creative economy.
The easy read is that India is finally getting serious about measuring research, and that the measurement will confirm a familiar complaint. India's R&D, the story goes, is a government affair. As recently as August 2025, a Ministry of Science & Technology reply in Parliament put the private sector at only around 36% of R&D spending, against more than 70% in China, South Korea and the US, using data for 2020-21.
It is worth slowing down on that. The newer data say something else.
The majority flipped in four years
DST's Research & Development Statistics 2025-26, tabled in a Lok Sabha reply on July 29, 2026, show that the private sector performed 51.8% of India's R&D in 2023-24. The government sector's share fell to 48.2%, from 66.2% in 2019-20. In four years, the two sides swapped places.
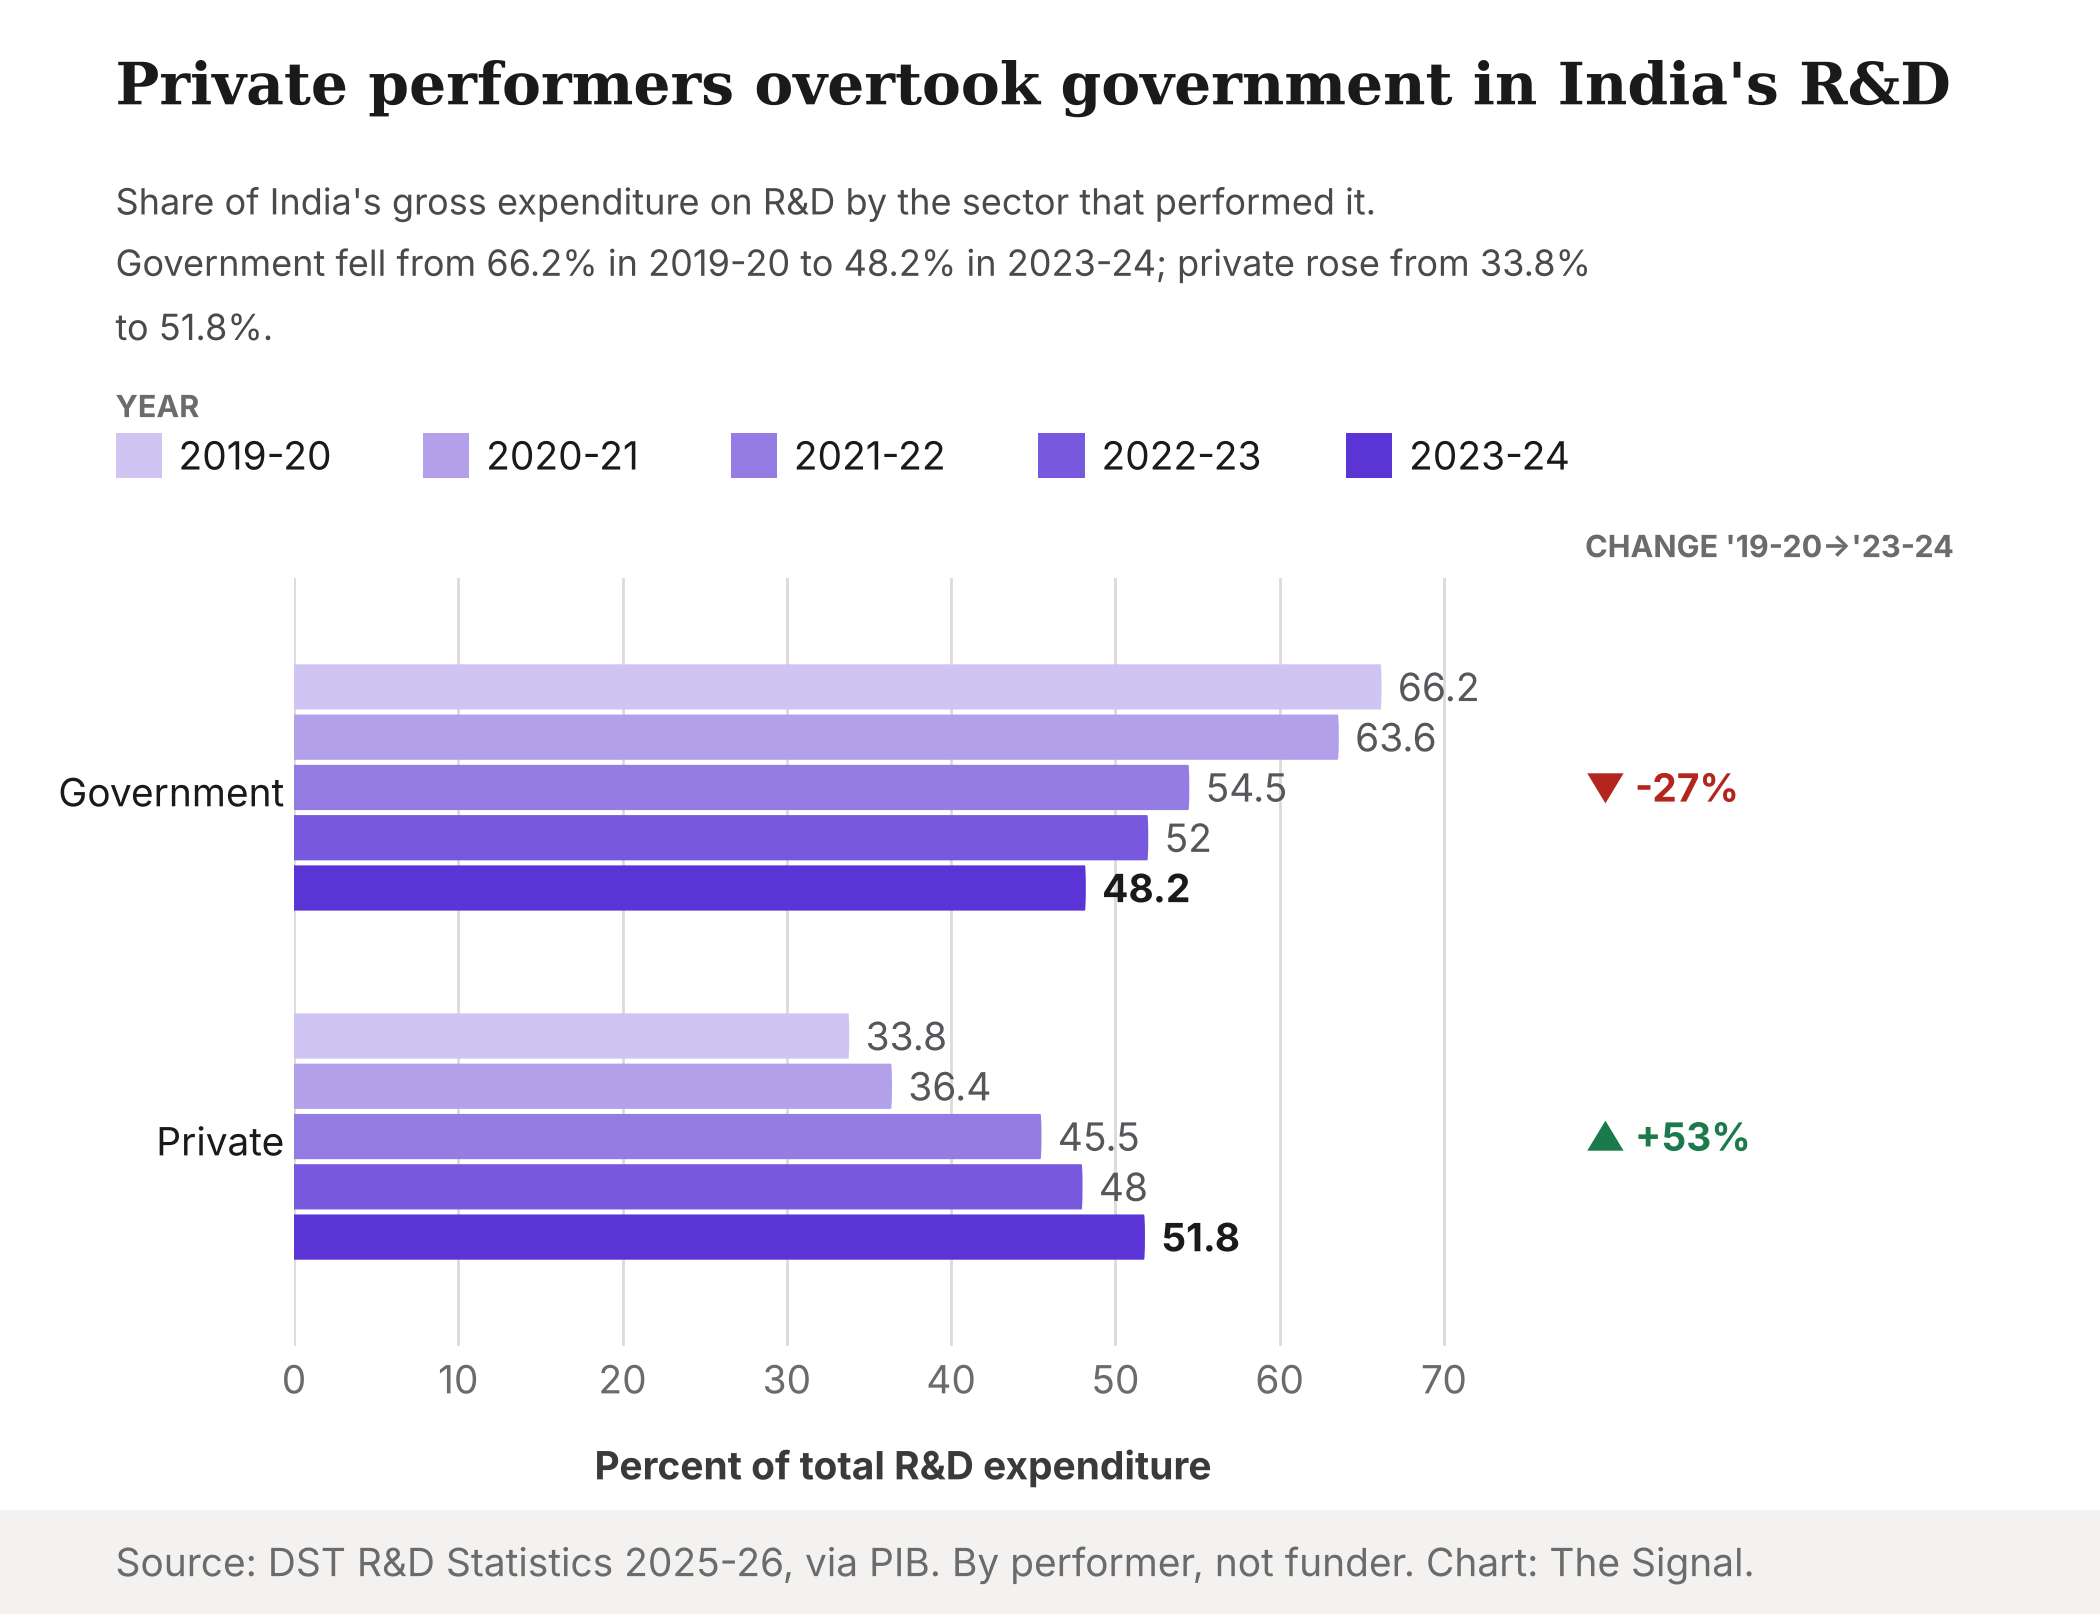
Source: DST R&D Statistics 2025-26, via PIB and a second PIB reply. Shares are by performer, not funder. Chart: The Signal.
The definitions matter here. In DST's table, the government sector covers central ministries' institutions, state S&T institutions and agricultural universities, public sector industry and public higher education. The private sector covers private industry, scientific and industrial research organisations, and private higher education. This is a split by who does the research, not by who pays for it.
The money tells the same story, faster
The rupee lines are sharper than the shares. The private-sector line in DST's table rose from ₹44,753.54 crore in 2019-20 to ₹1,18,351.68 crore in 2023-24, about 2.6 times. Central-sector R&D rose from ₹69,317.09 crore to ₹85,711.50 crore over the same years, a gain of about 24%.
That private line is not the whole private sector. A second DST-based reply in Parliament, on July 30, 2026, put the full private sector, including private higher education, at ₹1,26,906.60 crore in 2023-24, against ₹1,17,861.21 crore for the government sector. That total matches the 51.8% share. The narrower line above sits about ₹8,555 crore below it.
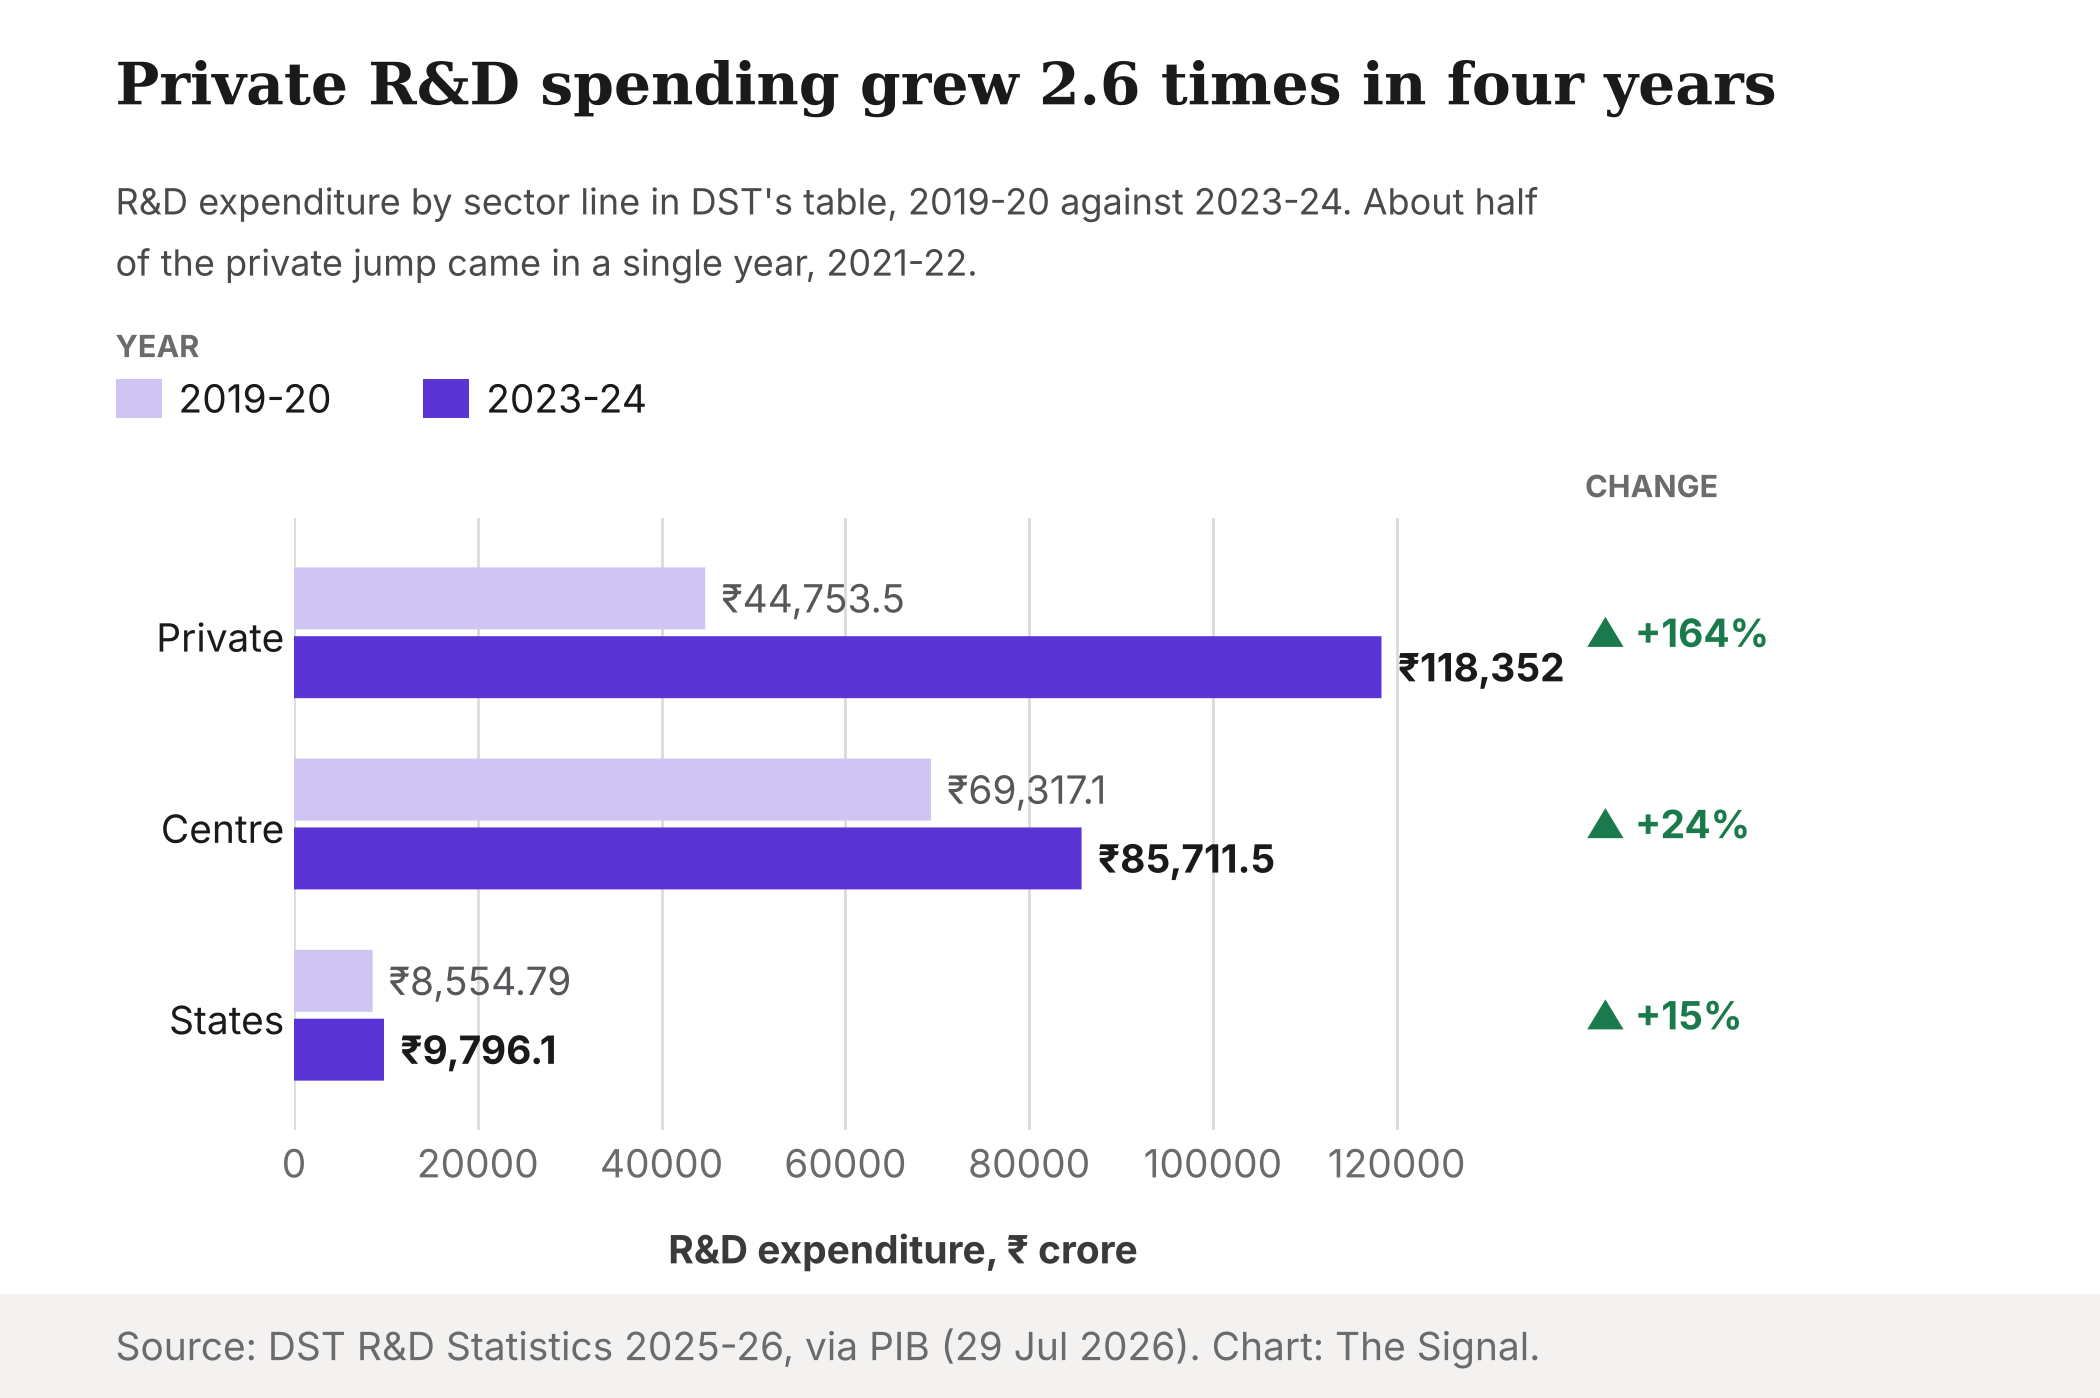
Source: DST R&D Statistics 2025-26, via PIB. Percentage changes are The Signal's calculations. Chart: The Signal.
Total gross expenditure on R&D went from ₹1,32,567.01 crore in 2019-20 to ₹2,44,767.81 crore in 2023-24, and from 0.66% of GDP to 0.84%. That is an increase of about ₹1.12 lakh crore. The private line in the same table gained ₹73,598 crore, about two-thirds of all the growth in Indian R&D between 2019-20 and 2023-24.
Then there is the timing. DST's figures show the private line jumping from ₹46,388.13 crore in 2020-21 to ₹82,974.99 crore in 2021-22, a single-year rise of about ₹36,587 crore. That one year delivered about half of the four-year private increase. On the broader total, the private sector went from ₹46,388.13 crore to ₹88,677.51 crore in the same year, again about half of its four-year gain. R&D as a share of GDP moved in step, from 0.64% in 2020-21 to 0.83% in 2021-22. The shift is real in the data, and it is recent.
What the new account would be measuring
This is why the committee's sequencing matters. By putting R&D in its first group of accounts, the committee has picked the part of the knowledge economy whose private side has been the fastest-moving line in DST's series.
India already has a base to build on. Since the 2011-12 national accounts series, introduced in 2015, MoSPI has capitalised R&D spending by government, public corporations and private corporations, so it already counts as capital formation in GDP. The question is what the existing accounts can and cannot show.
MoSPI's Sources and Methods for the new 2022-23 base-year series, published in September 2026, say that R&D investment by private corporations is derived from the MCA corporate database, while government R&D comes from budget documents. The same document says R&D capital formation is not estimated separately for the unincorporated sector at all.
The headline GDP release reports a broader asset class. MoSPI's February 2026 press note on the new series shows private non-financial corporations investing ₹8,62,219 crore in intellectual property products in 2024-25, 8.6% of all fixed investment, against ₹1,07,990 crore by general government. That is roughly eight to one. R&D is one part of that line, and the press note does not break it out. A dedicated R&D account would separate it.
India already capitalises R&D. What it lacks is the second stage the US built.
| Step | United States | India |
|---|---|---|
| R&D counted as investment in GDP | 2013, after a satellite account; about $300 billion added to 2007 GDP | Since the 2011-12 series, introduced in 2015 |
| Dedicated R&D production statistics | Experimental release in 2024, with value added, jobs and pay | Proposed as a first thematic account, November 2026 |
Sources: MoSPI committee report; BEA; MoSPI 2011-12 methodology; MoSPI Sources and Methods.
The committee itself points to that US model: BEA's R&D satellite account fed into the core accounts in 2013, and its experimental R&D production statistics, first released in 2024, give national and state estimates of R&D value added, employment and compensation. When BEA made R&D an investment, it estimated the change would have added about $300 billion to US GDP in 2007. The rules are moving again: the 2025 SNA records data as a produced asset for the first time, pulling its value inside the production and asset boundaries.
The honest objection
The strongest case against making much of the flip is that India still trails the economies it wants to match. NSF's Science and Engineering Indicators 2025 show business performing 78.95% of US R&D, 77.57% of China's and 79.38% of South Korea's in 2022 or the latest year. India's 51.8% is still about 27 points short, and it includes private universities and research bodies that a business-only measure would leave out.
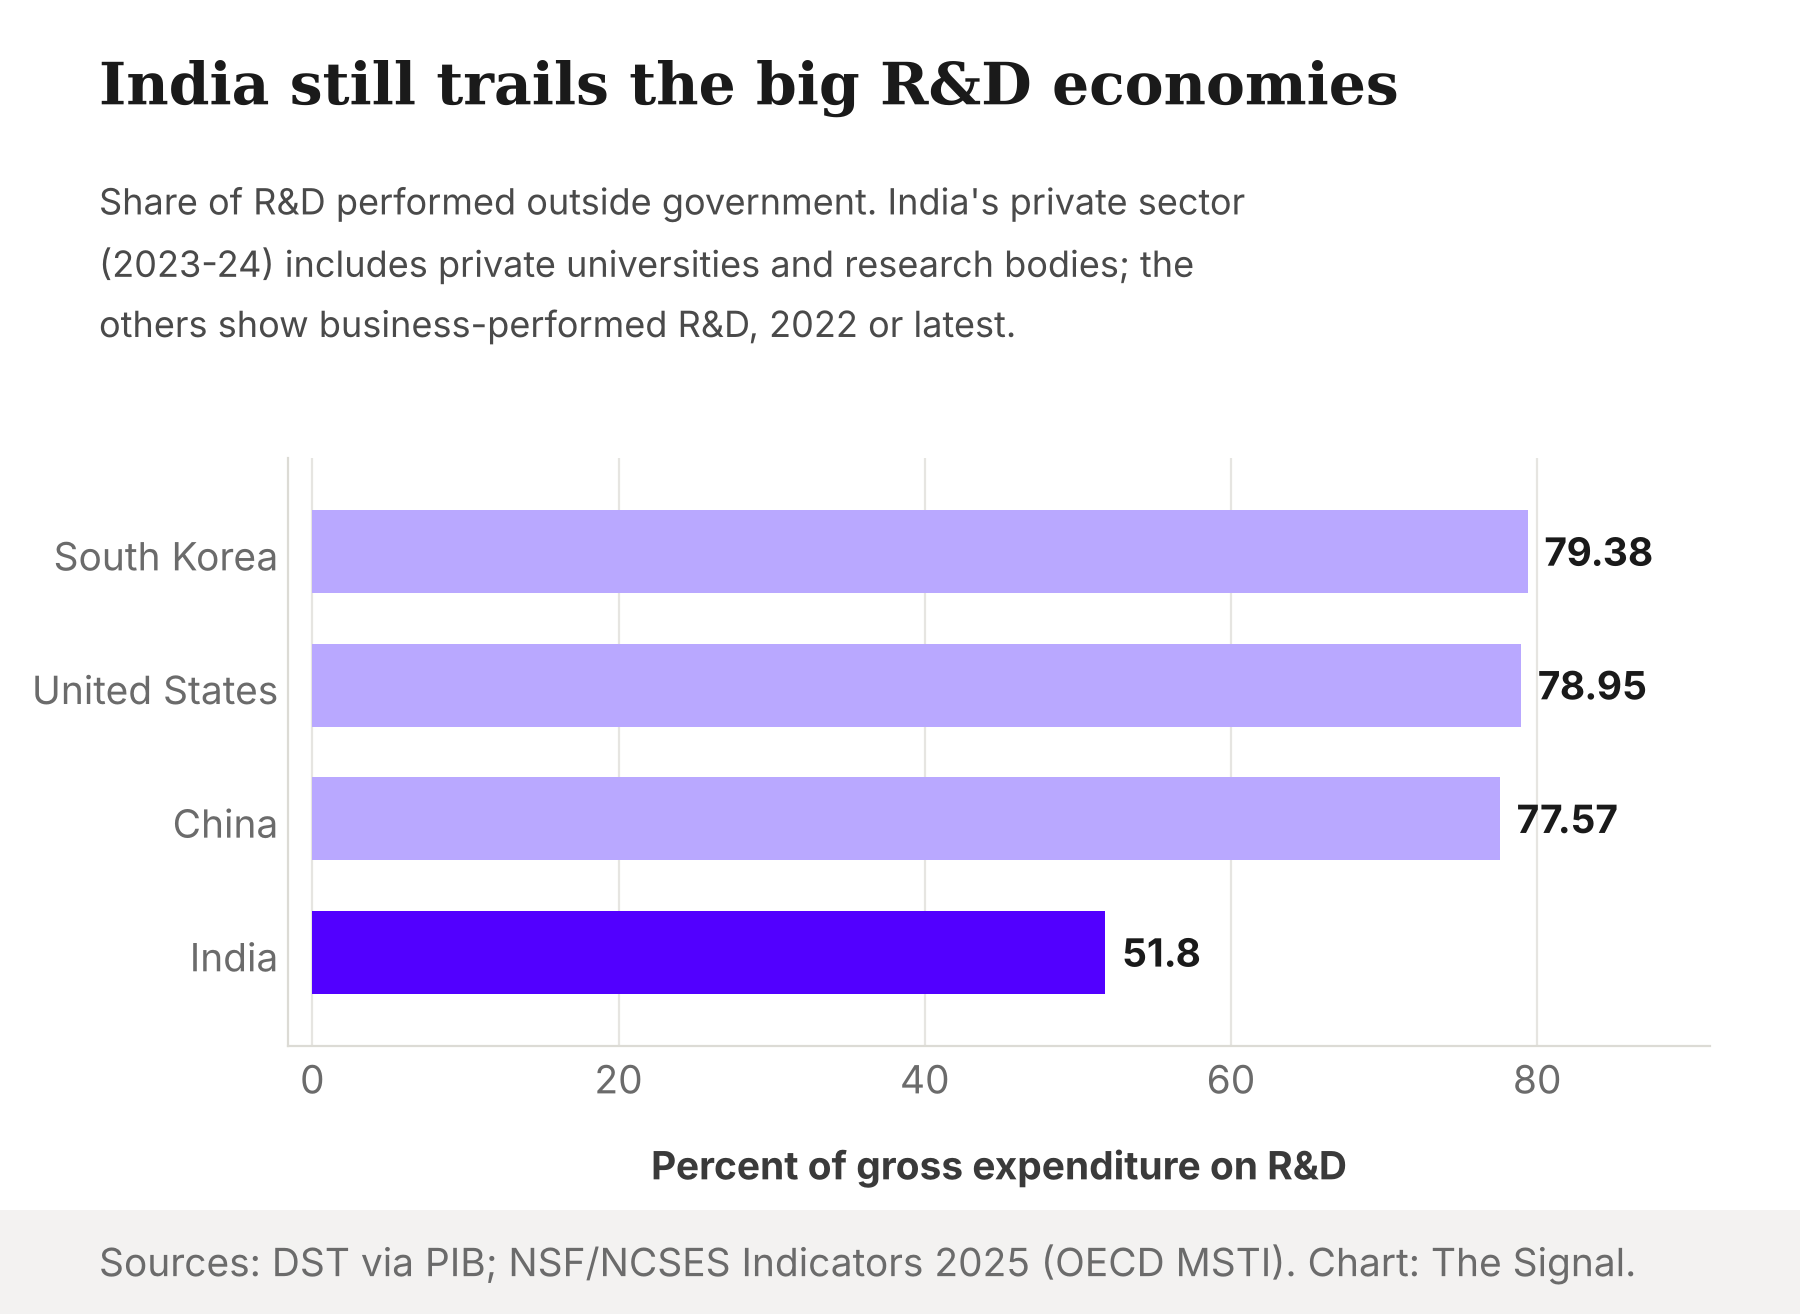
Source: NSF Science and Engineering Indicators 2025 for the US, China and South Korea (business sector, 2022 or latest year); DST R&D Statistics 2025-26, via PIB for India (private sector, 2023-24). Chart: The Signal.
There is a second point. DST's split is by performer. The same NSF table shows that government funds 18.11% of US R&D, 17.77% of China's and 22.64% of South Korea's. India's figures, as tabled, do not say who paid for the private work. A share of it could be publicly funded and still sit on the private side of the ledger.
Both points are fair. Neither restores the old story. On DST's own definitions, the government sector performed 48.2% of India's R&D in 2023-24, and the gap with China, Korea and the US has narrowed from the roughly 36% private share Parliament was given in 2025. The objection is a reason to measure the private surge carefully, which is what an R&D account is for.
The Signal
The committee's paper is open for comment until December 12, 2026, and it proposes starting with R&D on common SNA-based definitions. That choice means India's first knowledge account lands on the part of its research system that changed fastest, in a series where one year, 2021-22, carried about half of the private gain.
Three things to watch. Whether the account reconciles DST's performer data with the MCA filings the GDP series uses. Whether it adds a funder view, so public money spent through private labs is visible. And whether it covers the unincorporated firms the national accounts currently skip. Get those right and India will know what its R&D push is buying. The state-led story rests on 2020-21 numbers; the new account will be measuring 2023-24.
Reporting basis: R&D spending, sector shares and the R&D-to-GDP ratios for 2019-20 to 2023-24 come from the Department of Science and Technology's Research & Development Statistics 2025-26, via a Lok Sabha written reply carried by PIB; the 2020-21 private share is from an earlier Ministry of Science & Technology reply, also via PIB, and draws on the same DST series, as does a second reply giving government and private rupee totals, so all three are one origin. The knowledge-accounts proposal and the description of the US model are from the paper of MoSPI's Committee on Knowledge Systems. The capitalisation of R&D since the 2011-12 series, the compilation methods for the 2022-23 series, and the intellectual property investment figures for 2024-25 are from three separate MoSPI documents, all one statistical origin. The US GDP effect of capitalising R&D in 2007 is from the US Bureau of Economic Analysis. Cross-country performer and funder shares are from NSF's Science and Engineering Indicators 2025, compiled from the Main Science and Technology Indicators. The 2025 SNA treatment of data is from UNSD's SNA News. The 2.6-fold private rise, the two-thirds share of total growth, the single-year share of the private gain, the ₹8,555 crore gap between the two private lines, the eight-to-one ratio and the 27-point gap are The Signal's calculations from those figures.