India's October trade data, released on 13 November 2026, produced two headlines that read as opposites. One said India had just shipped more goods in a month than it ever has. The other said the goods trade deficit had blown out to the widest in a year. Merchandise exports grew 45.06 percent to $49.47 billion in October 2026, from $34.11 billion in October 2025. And the merchandise deficit rose to a one-year high of $39.88 billion, against an economists' forecast of $32.25 billion and $30.21 billion in September. Both are true. Both come from the same table.
It is worth slowing down on the second one. A one-year high means the highest in the last twelve months. The window that produces it runs back to October 2025, and October 2025 was itself the worst goods month India had ever recorded: a merchandise deficit of $41.68 billion, driven by gold imports of $14.72 billion against $4.92 billion a year earlier. Set the window one month wider and the superlative dissolves. October 2026's gap is smaller than the same month last year, not larger.
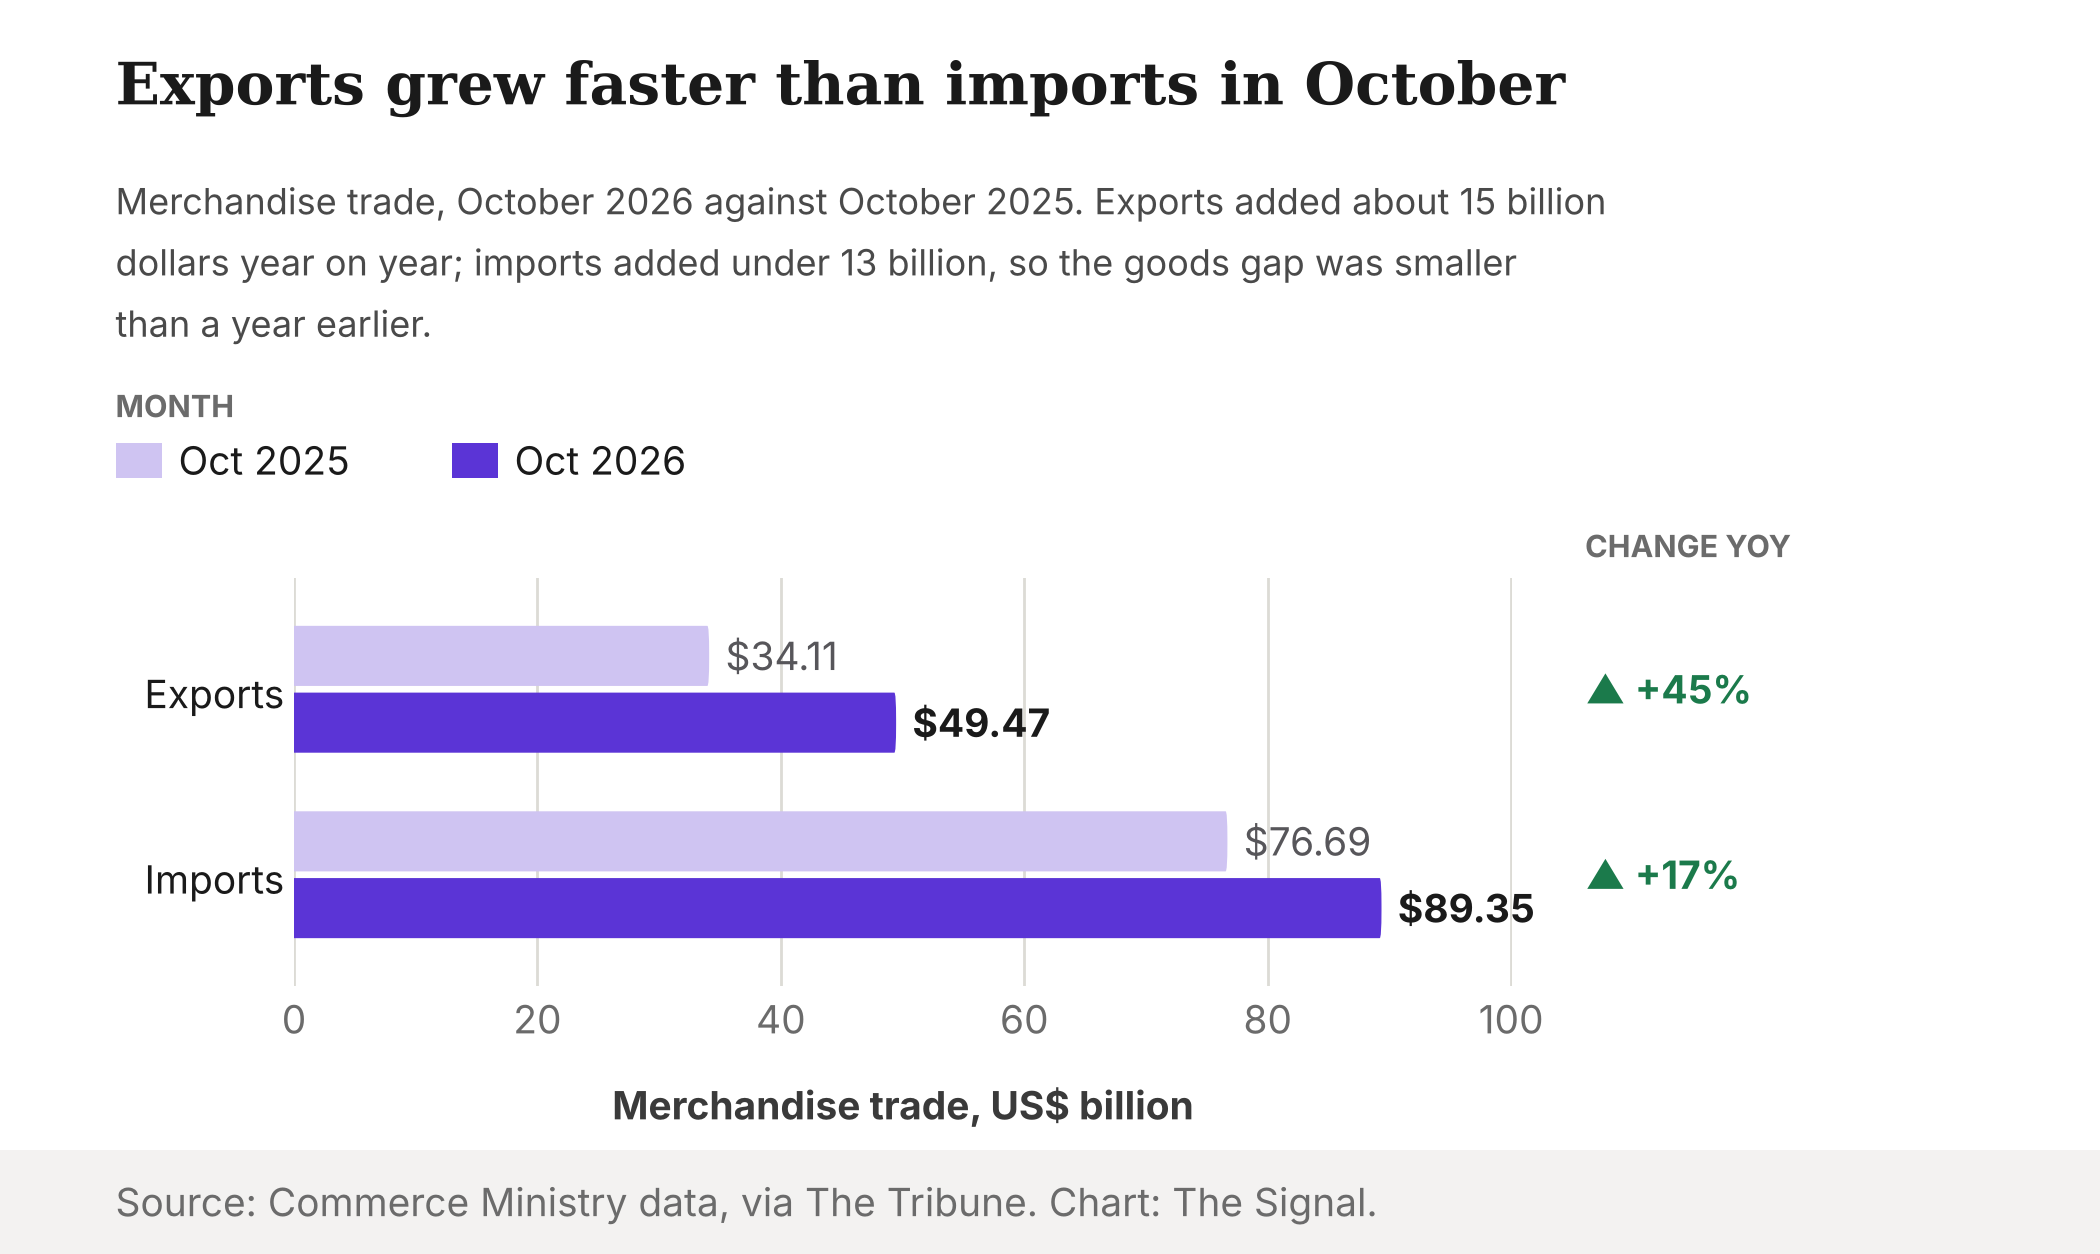
That is the comparison the day's coverage mostly skipped. Exports added about $15.4 billion year on year; imports added less, rising to $89.35 billion from $76.69 billion. When the smaller side of a gap grows by more in absolute dollars than the larger side, the gap closes. On the revised October 2025 figures the ministry now uses for comparison, $34.11 billion of exports against $76.69 billion of imports, that month's goods gap was about $42.6 billion. October 2026's is $39.88 billion, roughly $2.7 billion narrower.
The base was broken, in both directions
The 45 percent export number is not evidence of a 45 percent better India. It is a comparison against a month that was unusually bad. Merchandise exports in October 2025 fell to $34.38 billion, as first published, from $38.98 billion a year earlier, a sharp contraction, while 50 percent US tariffs were in force for a second month and shipments to the United States fell 8.55 percent to $6.31 billion.
The import side of that month was distorted too, and in the opposite direction. Non-petroleum imports were $61.27 billion in October 2025 while non-petroleum, non-gems and jewellery imports were $42.78 billion, which leaves roughly $18.5 billion of gems, jewellery and precious metals in a single month. That is the gold spike, arriving in the base year right where a reader is now being invited to see improvement.
So October 2026 is measured against a month with depressed exports and swollen imports. A 45 percent export jump off a base of $34.11 billion is a smaller achievement than it sounds, and a deficit that still came in below that month's $41.68 billion is a better outcome than the one-year-high framing suggests. Neither headline survives contact with its own denominator.
What actually moved
Strip out the year-on-year comparison and the sequential one is where the pressure shows. India's merchandise exports were $44.40 billion and imports $74.61 billion in September 2026. In one month, imports rose by $14.74 billion and exports by $5.07 billion. That is the move that widened the deficit from $30.21 billion to $39.88 billion, and it happened between two consecutive months, not across a year.
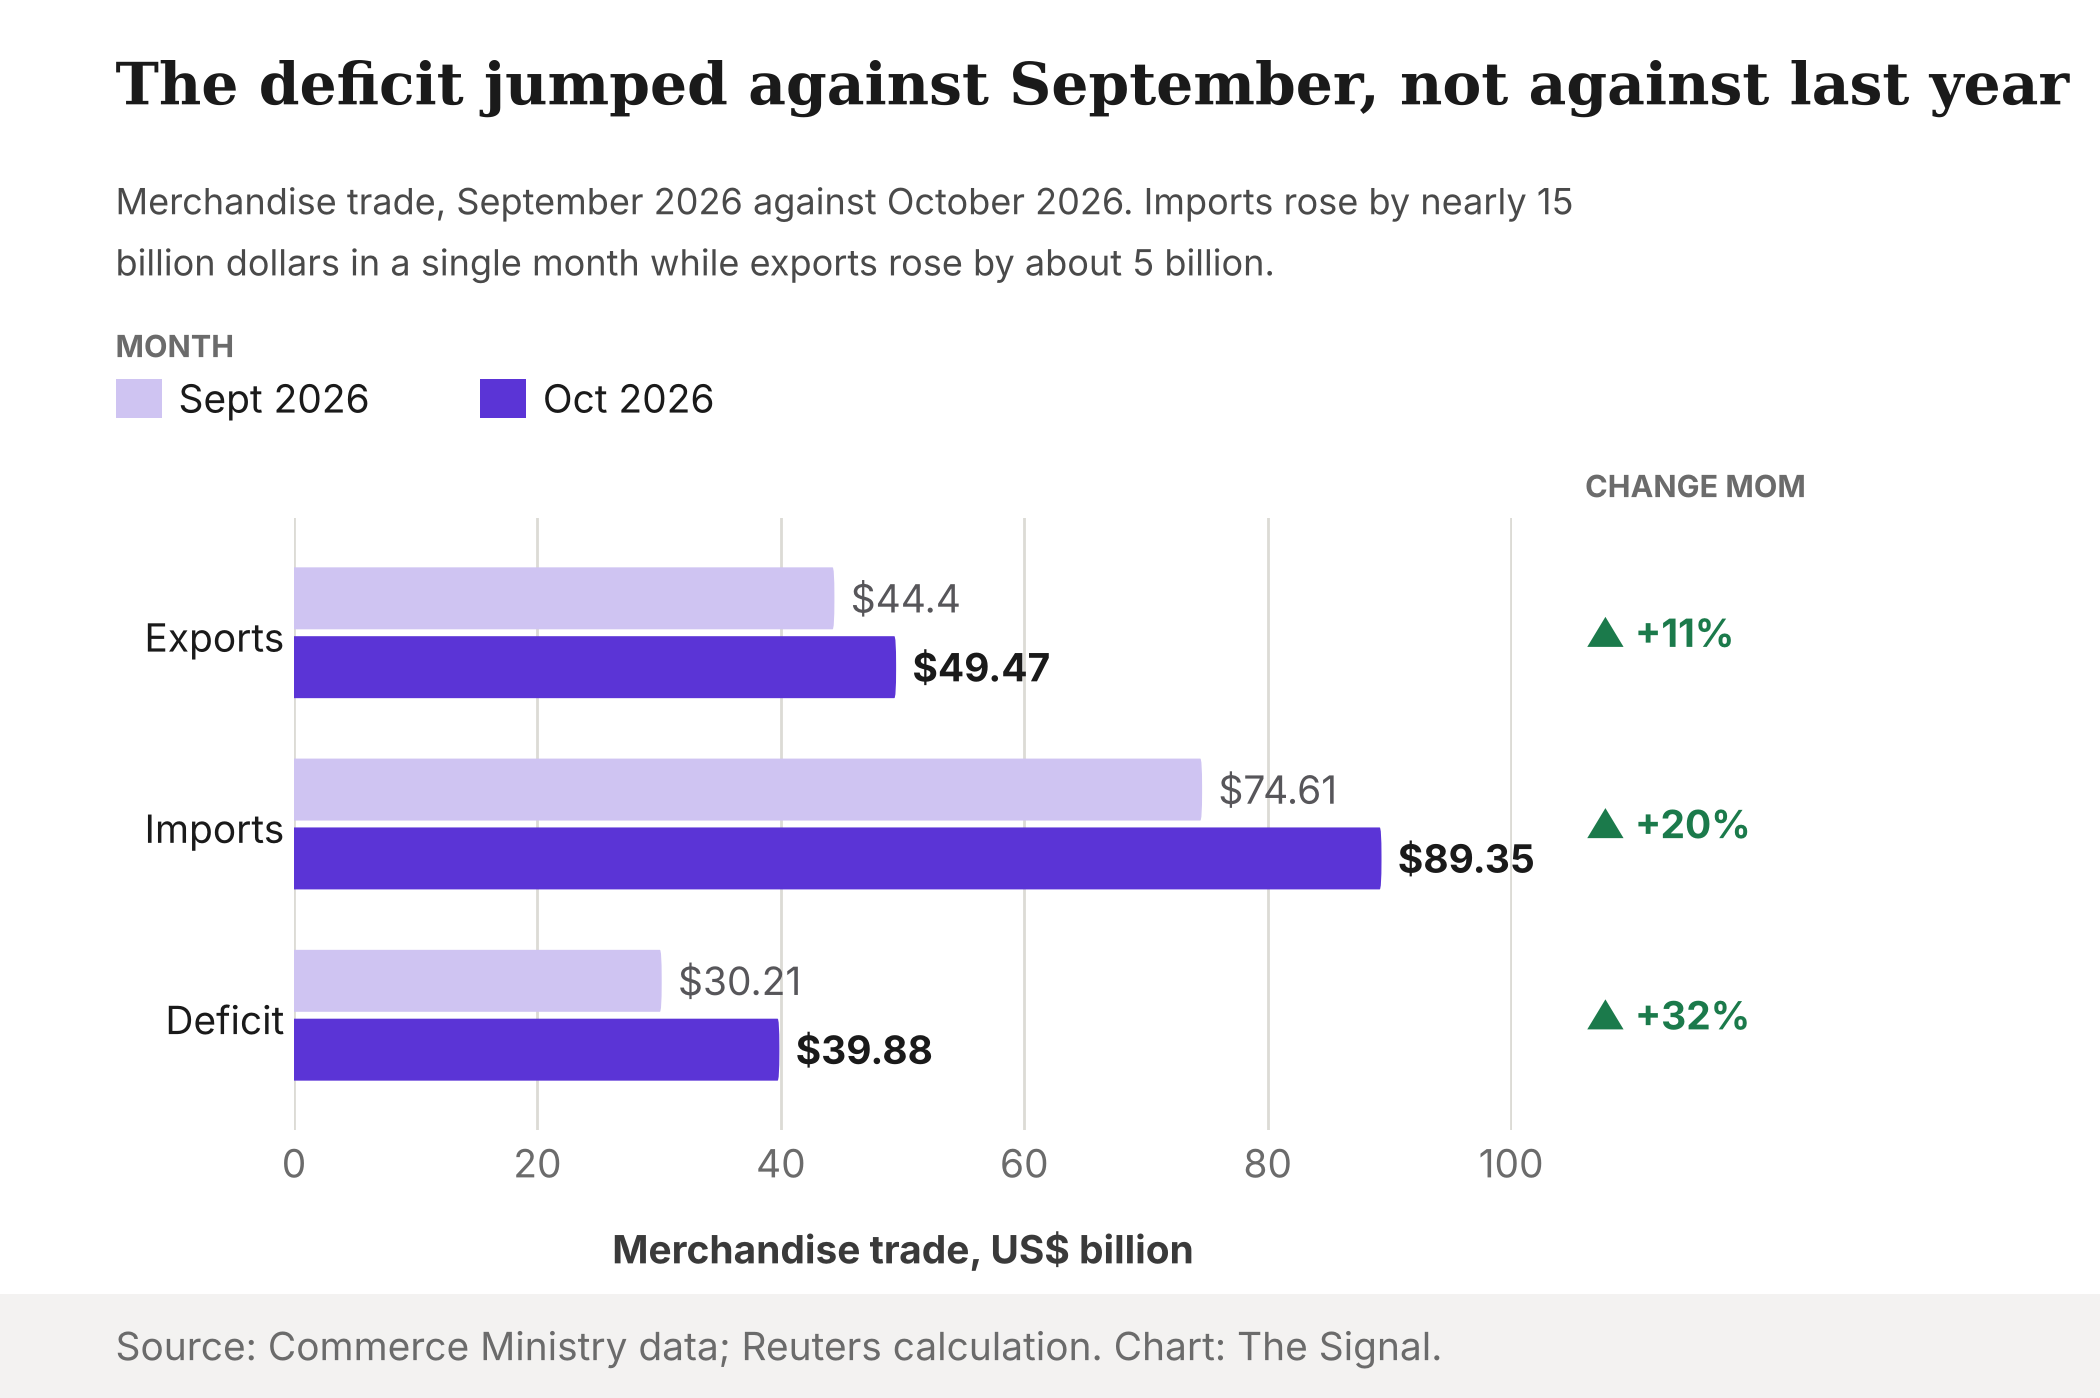
A single month's import surge of that size is not a trend, and the Commerce Ministry's own series shows why monthly readings mislead. The April to August 2026-27 merchandise deficit was $147.09 billion against $123.88 billion a year earlier, and the April to September figure was $177.64 billion against $156.88 billion. The cumulative gap has been running 13 to 19 percent wider than a year earlier through the fiscal year so far. October's single reading is noisier than that trend, in both directions.
The composition of the export growth is the part worth tracking. Electronic goods exports rose 70.44 percent to $5.31 billion in September 2026, and petroleum product exports 31.90 percent to $6.22 billion. Petroleum exports rise when crude is expensive, which is also when the crude import bill rises; electronics do not work that way. Electronics growth is a genuine change in what India sells. Petroleum growth is mostly a price moving through, showing up on both sides of the ledger at once.
Services do most of the work the headline ignores
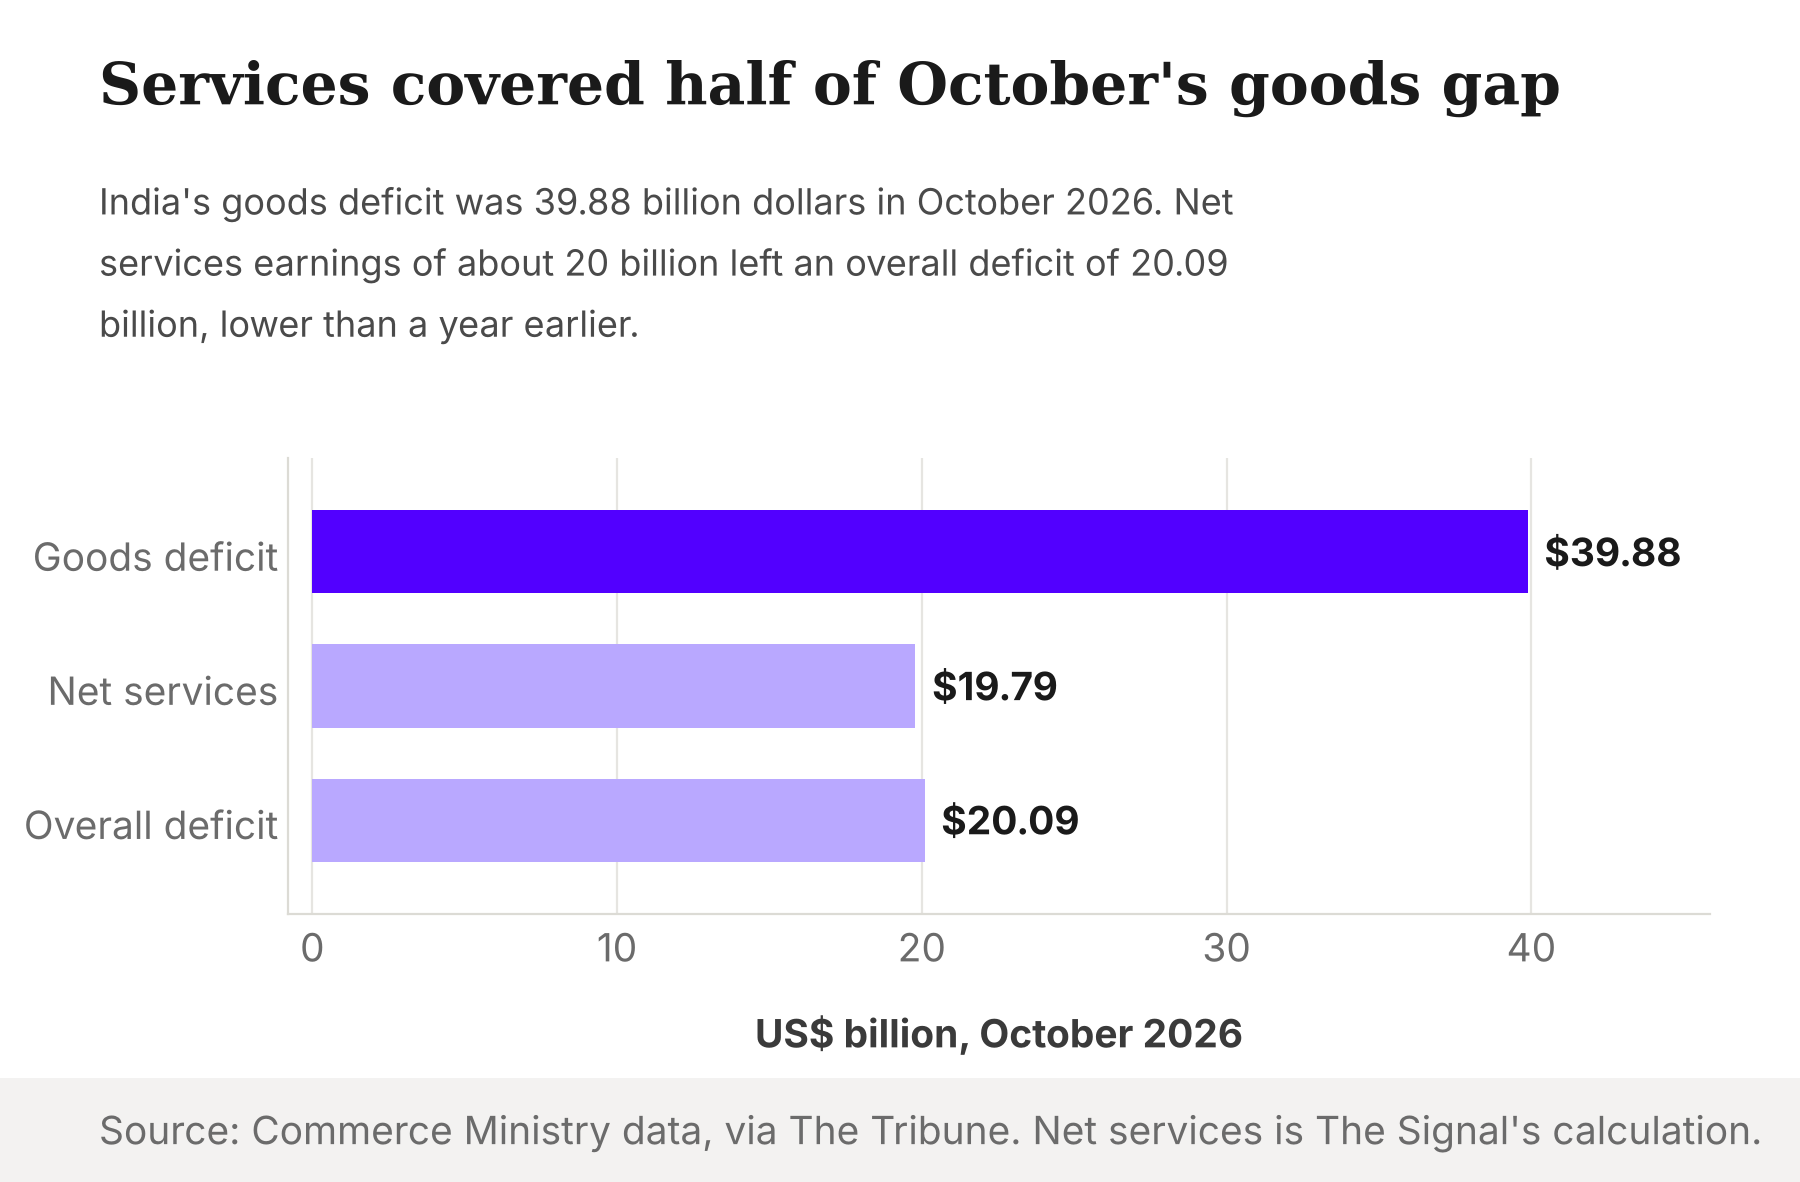
India's goods deficit has never been the number that determines external stress, because the country runs a large services surplus against it. In October 2026, the overall trade deficit including services narrowed to $20.09 billion from $25.15 billion in October 2025, with overall exports of $89.99 billion. Against a goods deficit of $39.88 billion, that implies net services earnings of about $19.79 billion in the month, covering just under half the goods gap.
The balance of payments confirms the pattern at quarterly scale. India's current account deficit was $4.2 billion, or 0.5 percent of GDP, in April to June 2026, with a merchandise trade deficit of $86.1 billion offset by net services receipts of $51.6 billion and by remittances. A goods gap of $86.1 billion in one quarter produced a current account deficit of half a percent of GDP. The goods number, read alone, is close to meaningless as a measure of external pressure.
The honest objection
The strongest case against all of this is that the base effect cuts the other way on the import side too, and that a one-month import jump from $74.61 billion to $89.35 billion is exactly what an economy under an oil-price shock looks like before the data admits it. On that view, the year-on-year comparison is the flattering one, the sequential move is the real signal, and anyone pointing at a narrowed overall deficit is reading a services estimate rather than a measured number.
Part of that is right, and the services caveat is real: the Commerce Ministry states plainly that the October 2026 services figures are estimates, pending the RBI's own release. But the objection argues for watching the next two months, not for the one-year-high framing. A deficit cannot be deteriorating if the same month a year ago was larger. The superlative is measuring where the window starts, not where the trade is going.
The Signal
India published goods exports of $49.47 billion and its widest goods deficit in a year on the same morning, and the second fact was the one that moved the coverage. Neither is wrong. Both are artifacts of what they are being compared against: a tariff-hit, gold-swollen October 2025 that flatters the export line and makes the deficit line look worse than the arithmetic supports. Three things are worth watching, and the next monthly superlative is none of them: whether the sequential import surge repeats in November, whether electronics keep climbing once the petroleum tailwind fades, and whether the services estimate survives the RBI's actual numbers. A deficit that sets a twelve-month record by being smaller than last year's is not a warning. It is a reminder that the window is doing the work.
Reporting basis: October 2026 merchandise and overall trade figures are Ministry of Commerce and Industry data, verified through The Tribune's and Asianet Newsable's reporting of the release, which share that single official origin; the one-year-high characterisation, the economists' forecast and the September comparison are per a Reuters calculation on the same release, as carried verbatim by one broadcaster. September 2026, August 2026 and October 2025 figures, including the commodity and non-petroleum breakdowns, are from the Commerce Ministry's own monthly releases, via the Press Information Bureau and the ministry's release PDFs. The October 2025 gold import figure and the US tariff detail are per Outlook Business, reporting that month's release, and rest on that single secondary source. Balance of payments figures are from the Reserve Bank of India's release covering April to June 2026. The year-on-year and month-on-month dollar changes, the implied gems and jewellery import figure, and the implied net services earnings for October 2026 are The Signal's calculations from those figures.