India's retail inflation crossed the Reserve Bank's ceiling in October. MoSPI's National Statistics Office reports that CPI inflation was 6.09% in October 2026, up from 5.54% in September, with rural inflation at 6.63% and urban at 5.41%. Business Today calls it a two-year high, but that label spans a change of series. Two years earlier, in October 2024, MoSPI reported 6.21% on its old 2012-base series, and the current series uses a 2024 base with a different basket. The comparison is a rough guide, not a like-for-like record. The culprit seemed obvious on release day, November 12. MoSPI's October release shows onion prices up 116.22% from a year earlier, the steepest rise of any item in the basket. And the rate response was already in motion: the RBI's Monetary Policy Committee raised the repo rate by 25 basis points to 5.50% on October 7, 2026, and CNBC reported that HSBC and Goldman Sachs expect another hike in December.
It is worth slowing down on that. Two separate stories are folded into one print. Onion alone is why October crossed 6%. It did not drive the acceleration in October, though, and it is not why the RBI is tightening.
One item, 0.7% of the basket
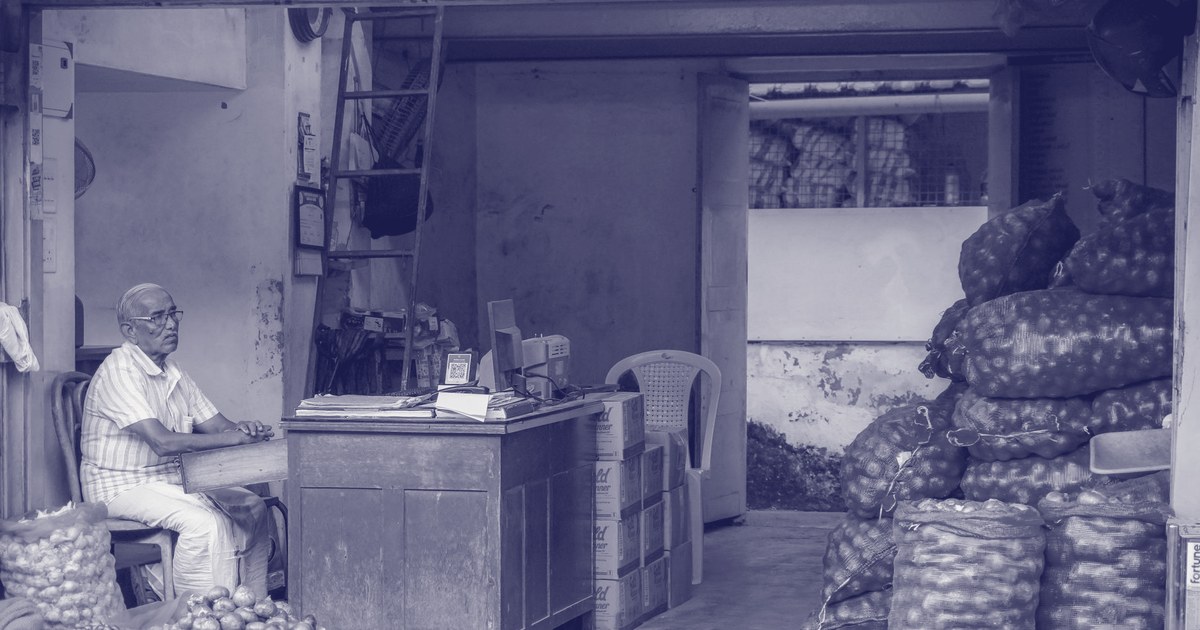
Onion carries a weight of 0.7006 in a basket of 100, according to MoSPI's October 2026 release. Its index stood at 143.99 in October 2026 against 66.60 a year earlier, per MoSPI's eSankhyiki item data. Weight that change against the whole basket and onion added about 0.52 percentage points to the 6.09% headline. Remove it and October inflation would have been about 5.59%, below the 6% upper tolerance level. Remove garlic too, up 60.74%, and the figure falls to about 5.49%. Those exclusions are our calculation from MoSPI's item weights and indices, and the method reproduces the published headline index exactly.
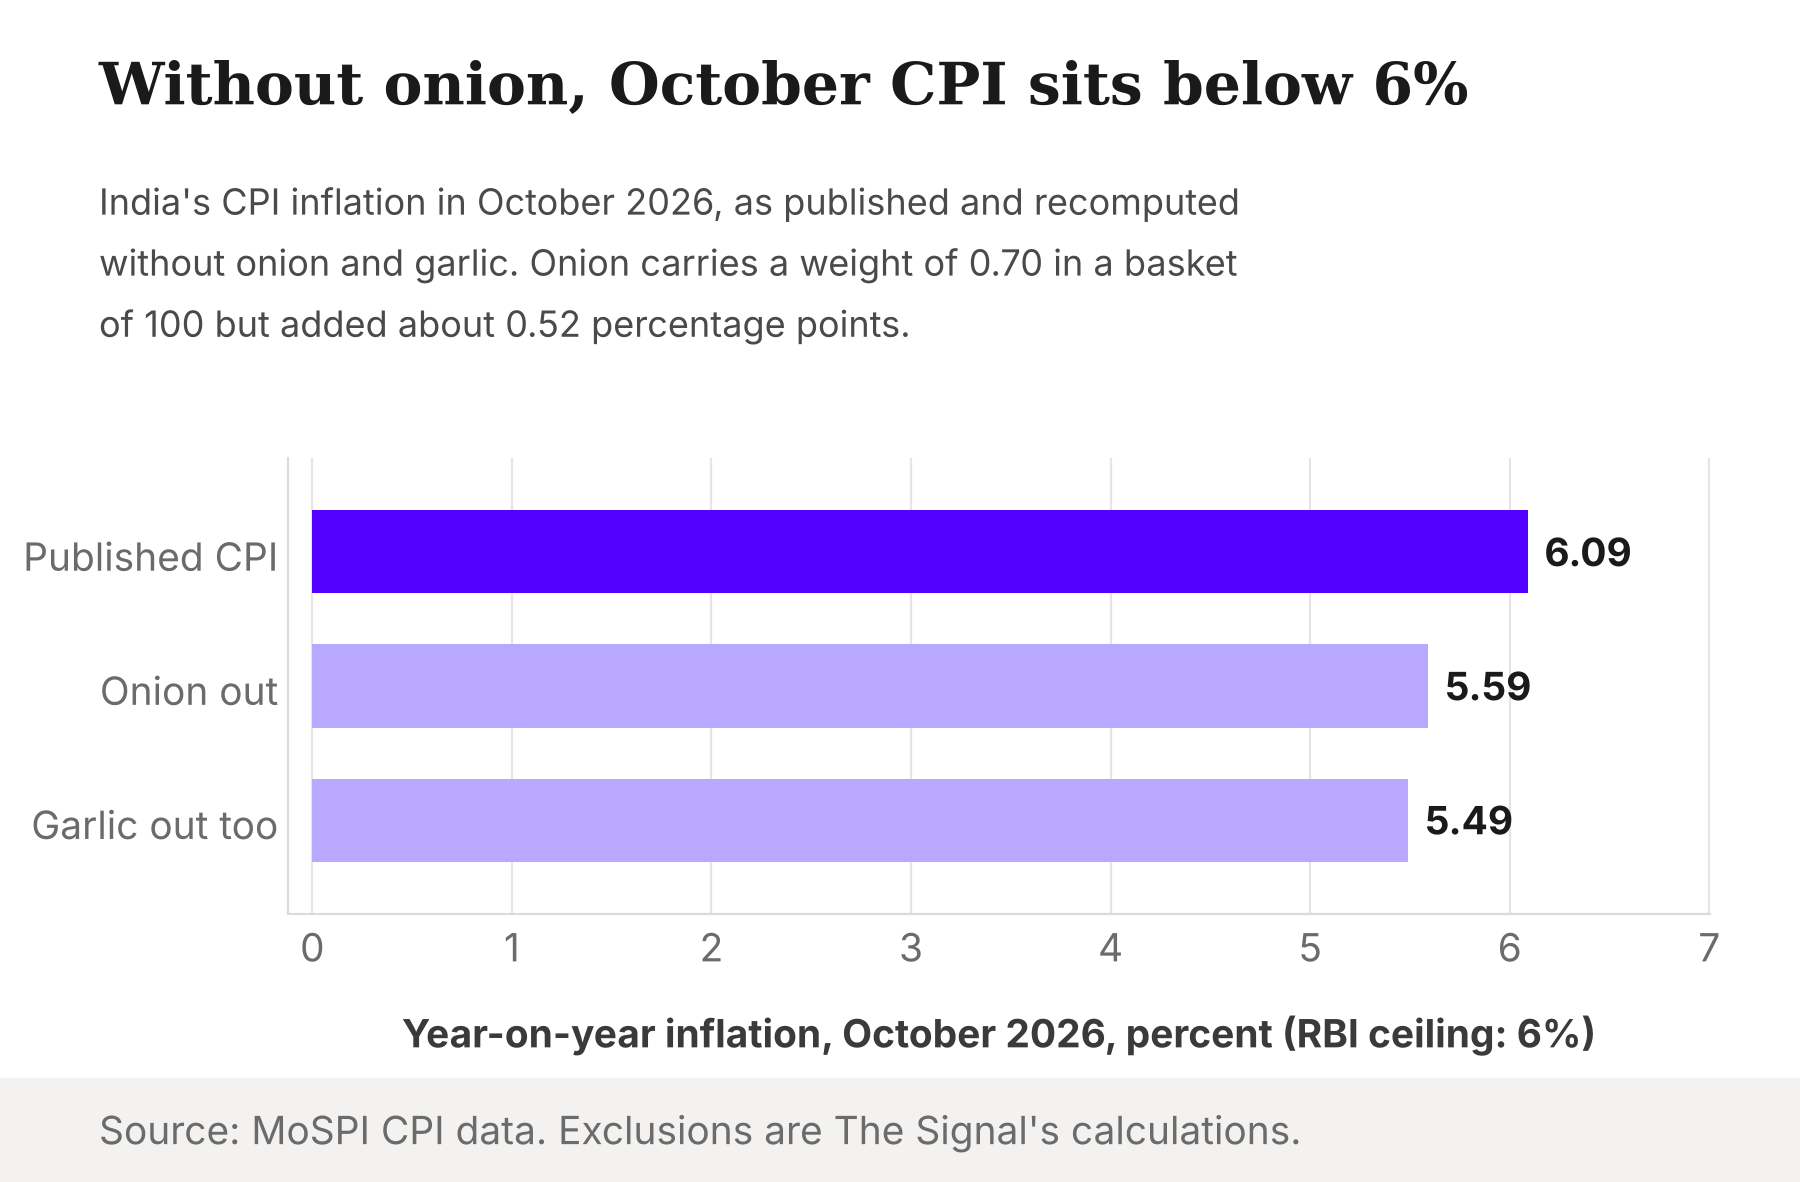
This is an onion story, not a vegetable story. Fresh vegetables other than onion contributed only about 0.05 percentage points in October, by The Signal's calculation from MoSPI item indices. Potato prices fell 14.24% from October 2025 and cauliflower fell 10.57%. The leverage stands out because food now counts for less: in the new 2024-base series, food and beverages weigh 36.75% of the basket, against about 42.62% for the old series on a like-for-like classification. A smaller food basket, and one bulb still moved the headline by half a point.
The harvest did not fail
A 116% price rise usually implies a crop shortfall. The production data say otherwise. The Department of Agriculture's second advance estimates put onion output at 307.37 lakh tonnes in 2025-26, against 307.67 lakh tonnes in 2024-25, with area up 2.31% to 20.14 lakh hectares. A flat harvest that still produces a price doubling points to storage and timing, not to a missing crop.
The government acted on that reading in the summer of 2026. The Department of Consumer Affairs said on August 26, 2026 that about 1.21 lakh tonnes had been procured for the buffer, against a 2.00 lakh tonne target, and began retail sales at ₹35 a kilo when the all-India average retail price was ₹37.87.
Part of the 116% is also arithmetic about last year. MoSPI's item data show onion's index barely moved month on month, from 142.91 in September 2026 to 143.99 in October, a rise of 0.8%. The year-on-year rate climbed from 108% to 116% because the October 2025 index had fallen to 66.60 from 68.66 in September 2025. The October figure says as much about October 2025 as about October 2026.
What actually moved in October
That matters for the month's jump. Headline inflation rose 0.55 points from September to October. By The Signal's calculation from MoSPI item indices, onion supplied only about 0.02 points of that rise. Broad food added about 0.42 points, led by rice, tomato, chicken, mustard oil and milk. Transport and clothing added about 0.07 each. Jewellery pulled the other way by about 0.18 points, as silver jewellery inflation fell to 52.39% from 87.82%, per MoSPI's release.
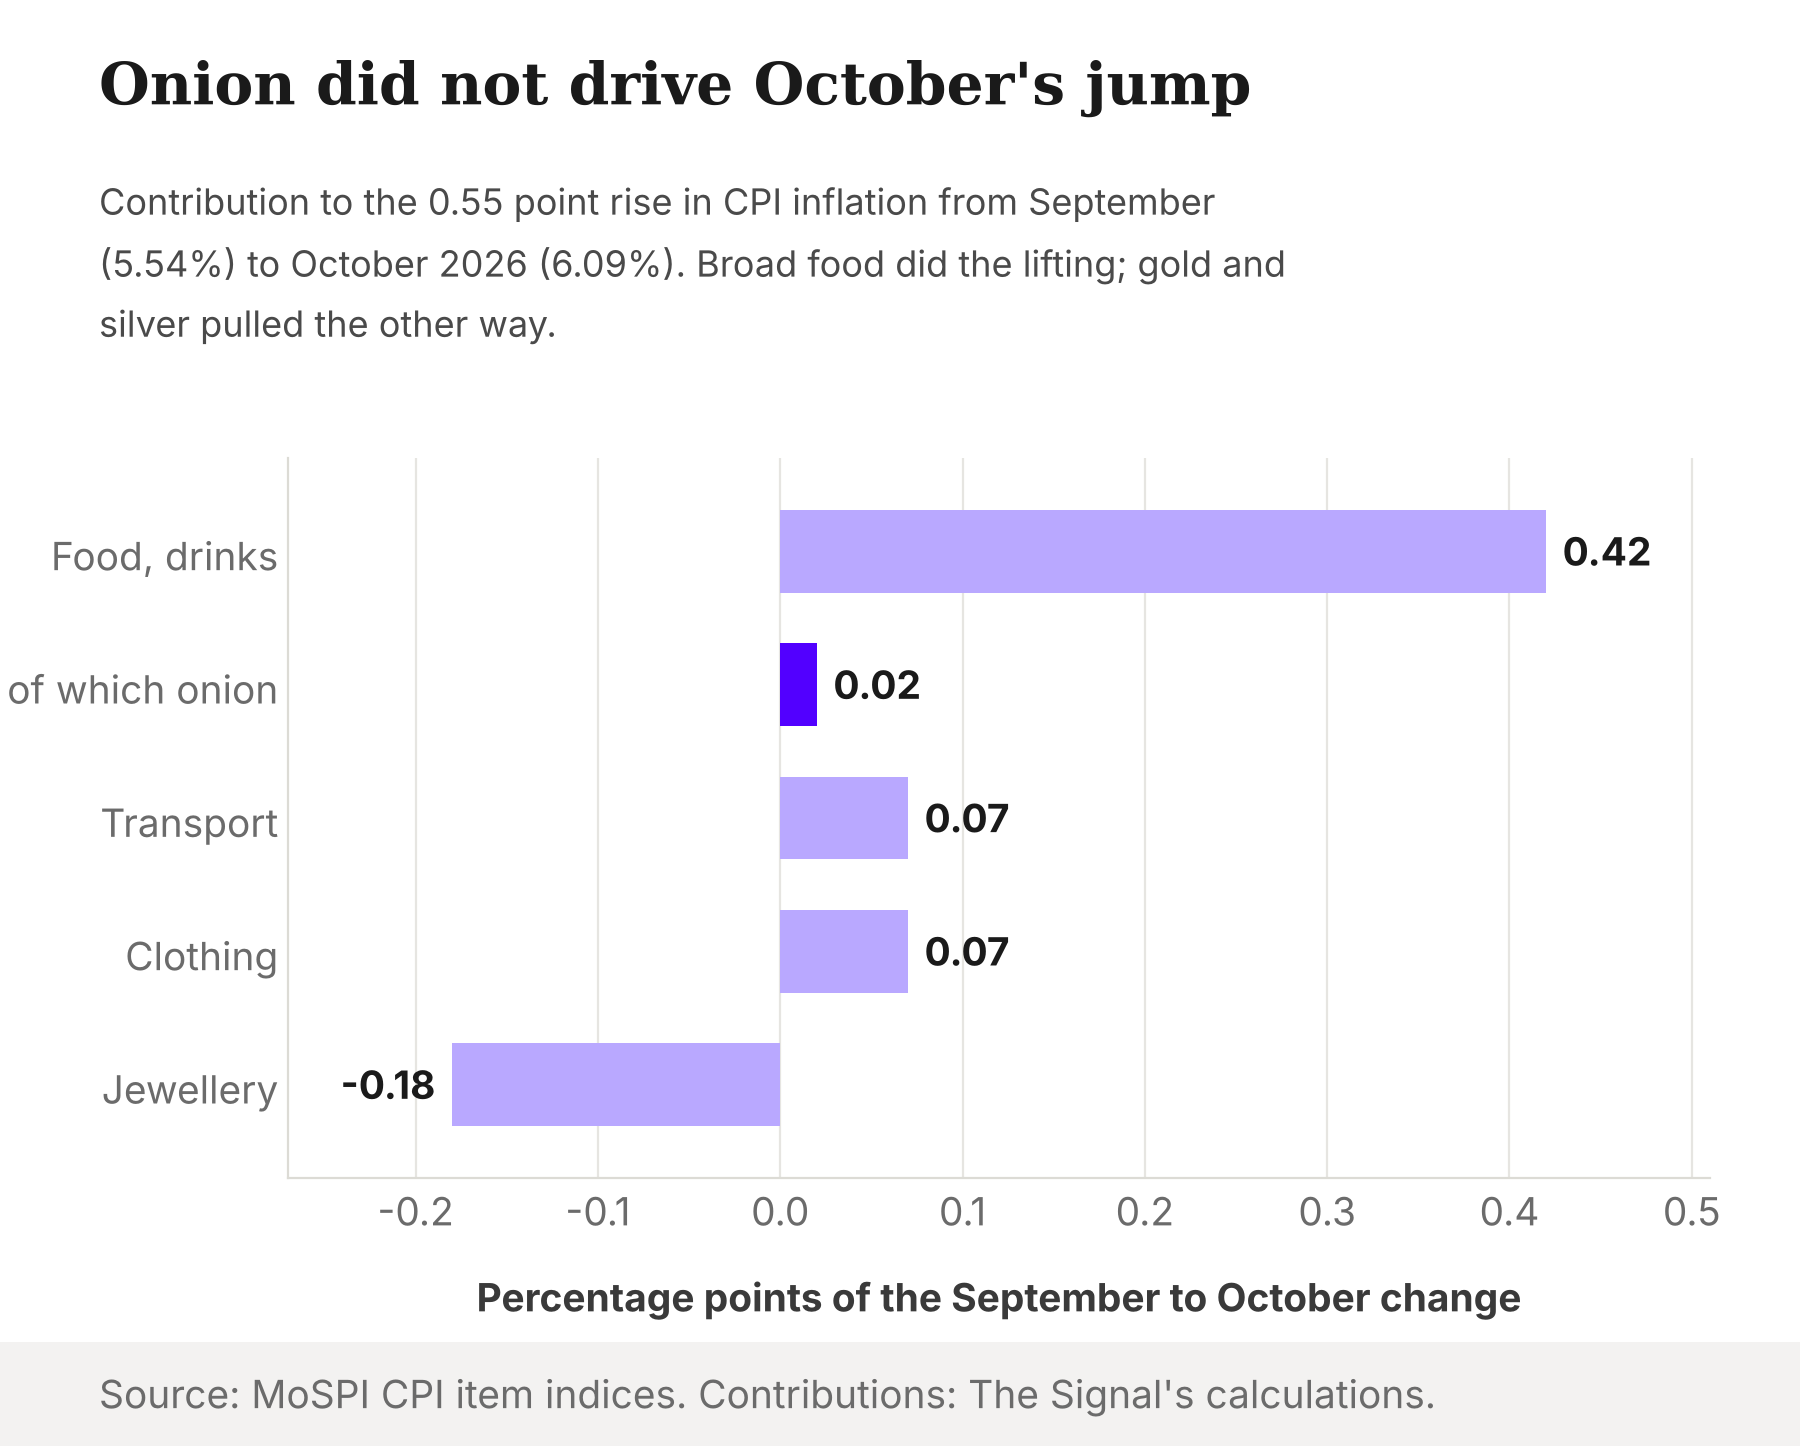
So onion explains the level. The acceleration came from food in general, and gold and silver hid some of it.
A breach is not a failure
The 6% line has a precise legal meaning, and one month does not trigger it. The RBI's Monetary Policy Framework overview states that the inflation target is failed when "the average inflation is more than the upper tolerance level of the inflation target for any three consecutive quarters." The government retained the 4% target and the 2% to 6% band on March 25, 2026, for April 2026 to March 2031. On failure, the RBI must report the reasons and its remedial actions to the government.
Every quarter of 2026 so far sits under the line.
| Quarter, 2026 | Monthly CPI inflation (%) | Quarterly average (%) |
|---|---|---|
| January to March | 2.74, 3.21, 3.40 | 3.12 |
| April to June | 3.48, 3.93, 4.38 | 3.93 |
| July to September | 4.45, 4.83, 5.54 | 4.94 |
| October to December | 6.09, pending, pending | needs Nov and Dec above about 5.96 to exceed 6 |
Source: MoSPI's September 2026 CPI release, Annexure IV; quarterly averages and the threshold are The Signal's calculations.
Using MoSPI's monthly series, the October to December 2026 quarter exceeds 6% only if November and December average above about 5.96%, our calculation. The RBI itself is close to that line: its October resolution projects CPI inflation at 6.0% for October to December 2026 and 5.7% for January to March 2027. A formal failure would need October to December 2026, January to March 2027 and April to June 2027 all to average above 6%. The October print starts no clock.
The honest objection
The strongest case against reading this as an onion blip is that the core underneath is rising, and the core is what monetary policy is for. Core inflation, excluding food and beverages, household fuel and vehicle fuel, rose from about 4.16% in August 2026 to 4.33% in September and 4.51% in October, by The Signal's calculation from MoSPI item indices. Excluding gold and silver as well, it rose from about 2.91% to 3.22% to 3.78%. MoSPI does not publish core. The same method gives the August figures the RBI stated, 4.2% and 2.9% excluding precious metals.
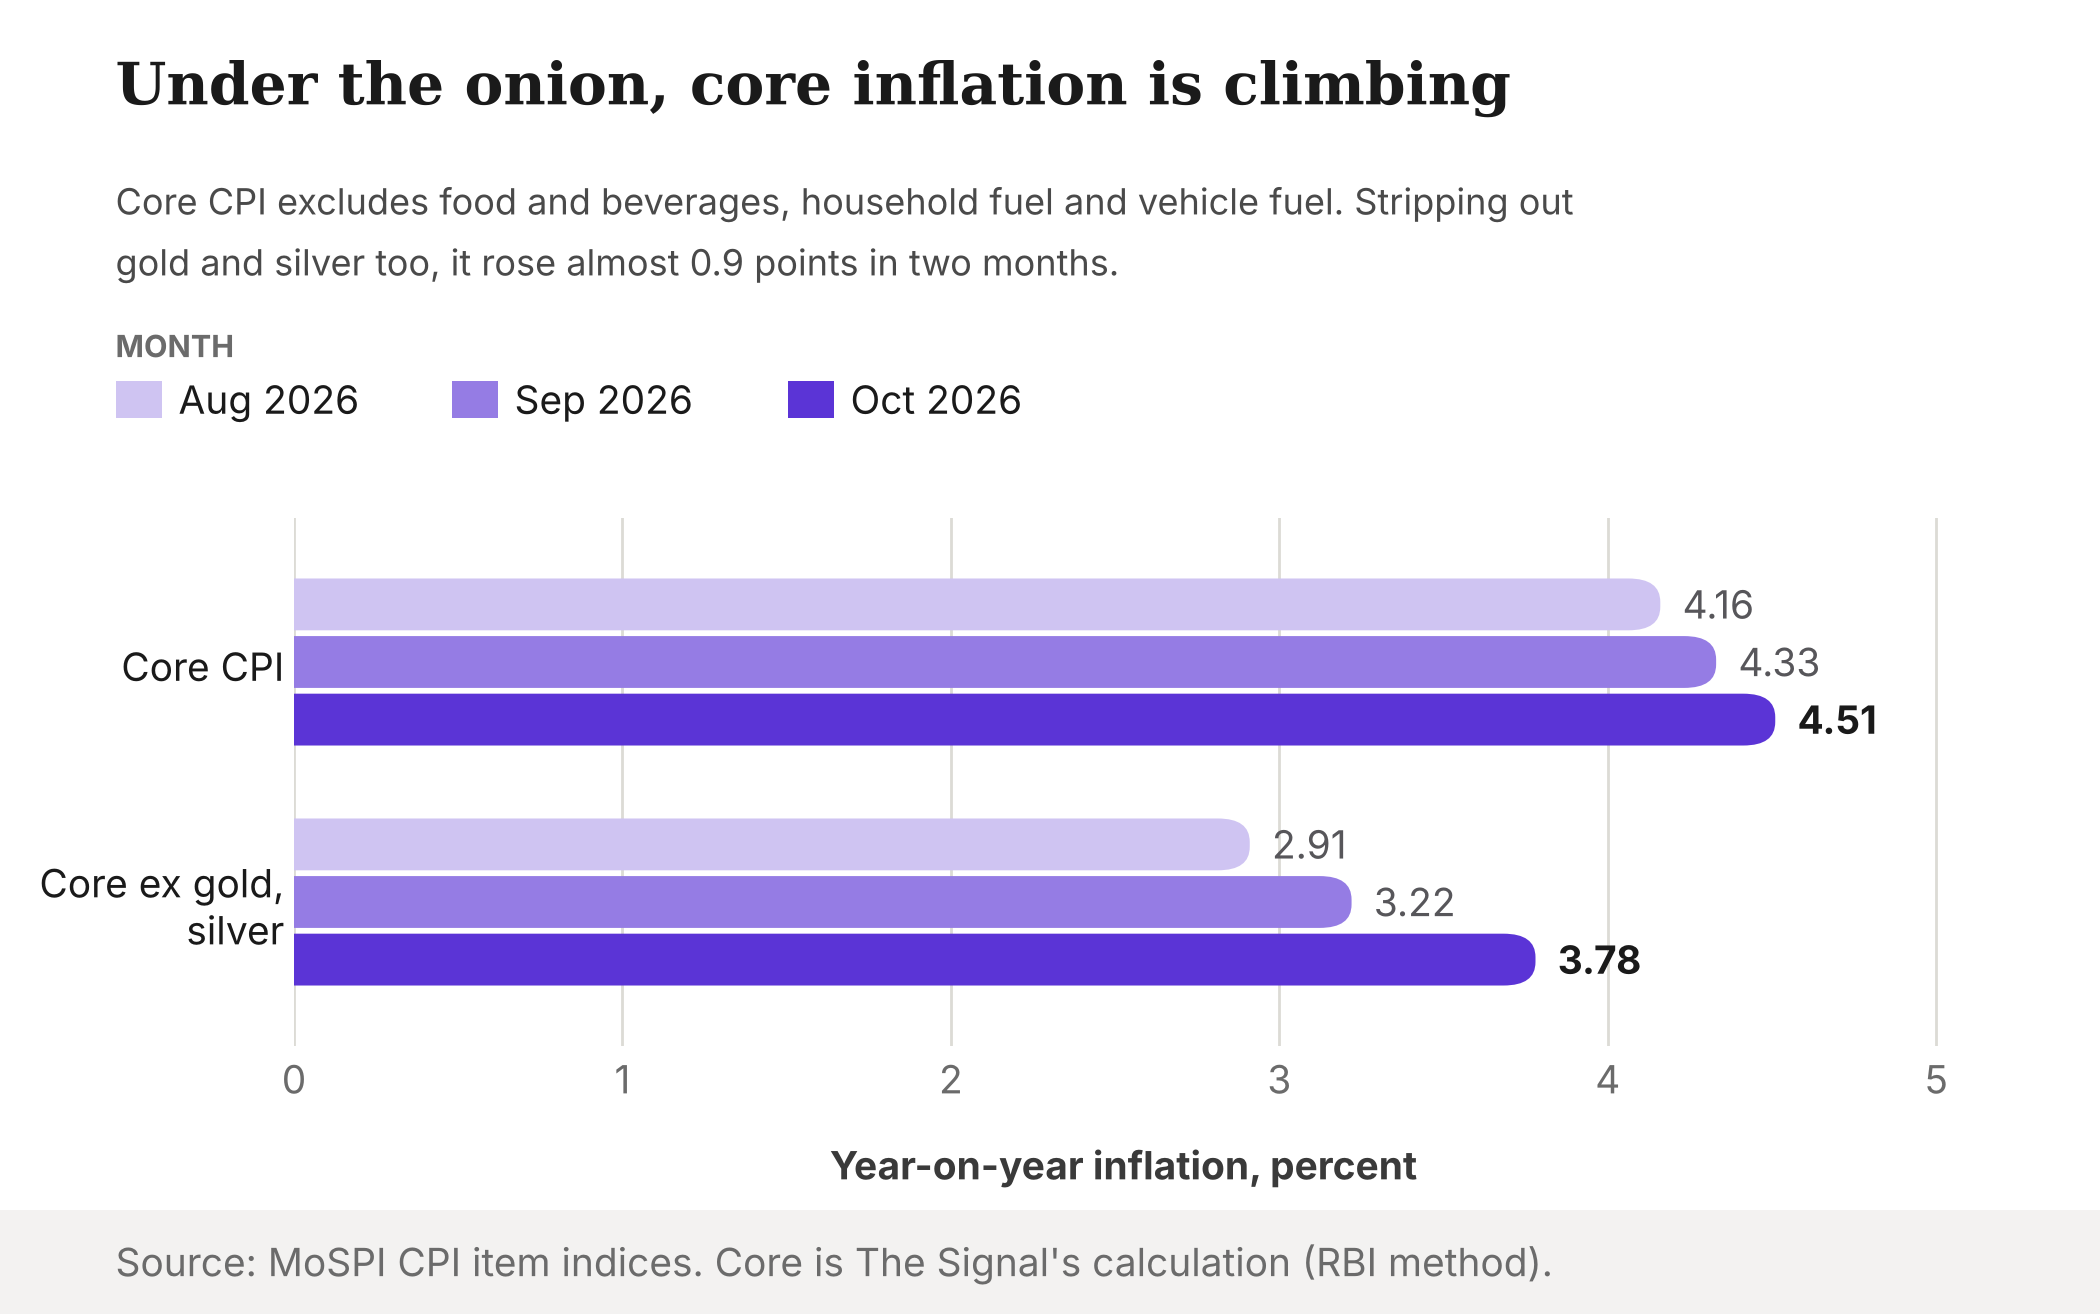
The RBI has also said what it is aiming at. Its October 7 resolution notes "notable spikes in certain items such as sugar and onion" and states that "as regards supply side inflation, monetary policy primarily acts by curtailing second round effects." On that view, a hike in December would aim at the second round: stopping a food shock from becoming a wage and pricing habit, rather than lowering onion prices. The core numbers say that may already be under way.
That case is right about policy, and it should be read at full strength. It still does not make onion the reason. Core excluding precious metals, at 3.78% in October 2026, is still below the RBI's 4% target, but it climbed 0.87 points in two months. That is the number a rate decision can reach. The 6.09% is mostly a number it cannot.
The Signal
October's print carries two messages, and the headline sends the wrong one. The breach of 6% is an onion number: a single item with a 0.70 weight added about 0.52 points, from a flat harvest and a base effect. The policy problem is a core number, rising three months running beneath it. The MPC meets on December 2 to 4, 2026, and MoSPI's release calendar schedules the November print for December 12, so the committee decides without it. When it lands, watch two things: whether onion's index finally turns down month on month, and whether core excluding gold and silver keeps climbing toward 4%. If onion eases and core does not, the RBI's case gets stronger as the headline gets weaker. The onion explains the headline. It does not explain the core.
Reporting basis: the headline, rural, urban and food inflation rates, the item weights and item inflation rates for onion, garlic and silver jewellery, and the monthly series for 2026 are from MoSPI's National Statistics Office, in its October 2026 CPI release via PIB, its accompanying PDF, its September 2026 release and its October 2024 release on the old 2012 base; the item indices are from MoSPI's eSankhyiki data service; the food weight comparison is from MoSPI's February 2026 release on the new base; the November release date is from MoSPI's 2026-27 Advance Release Calendar. All of these are one origin, MoSPI. The repo rate decision, inflation projections, August core figures and quoted language are from the RBI's October 7, 2026 MPC resolution, and the failure definition and target review are from the RBI's Monetary Policy Framework overview; both are RBI, one origin. Onion production is per the Department of Agriculture and Farmers Welfare's second advance estimates, and the buffer figures are per the Department of Consumer Affairs, both via PIB. The December rate expectations of HSBC and Goldman Sachs are as reported by CNBC and rest on that single source; the two-year-high description is Business Today's alone, and it compares the new 2024-base series with MoSPI's October 2024 figure on the old 2012 base, so it is not a like-for-like comparison. The onion and garlic contributions, the exclusion figures, the vegetable and month-on-month decompositions, core inflation, the quarterly averages and the November to December threshold are The Signal's calculations from MoSPI's figures.