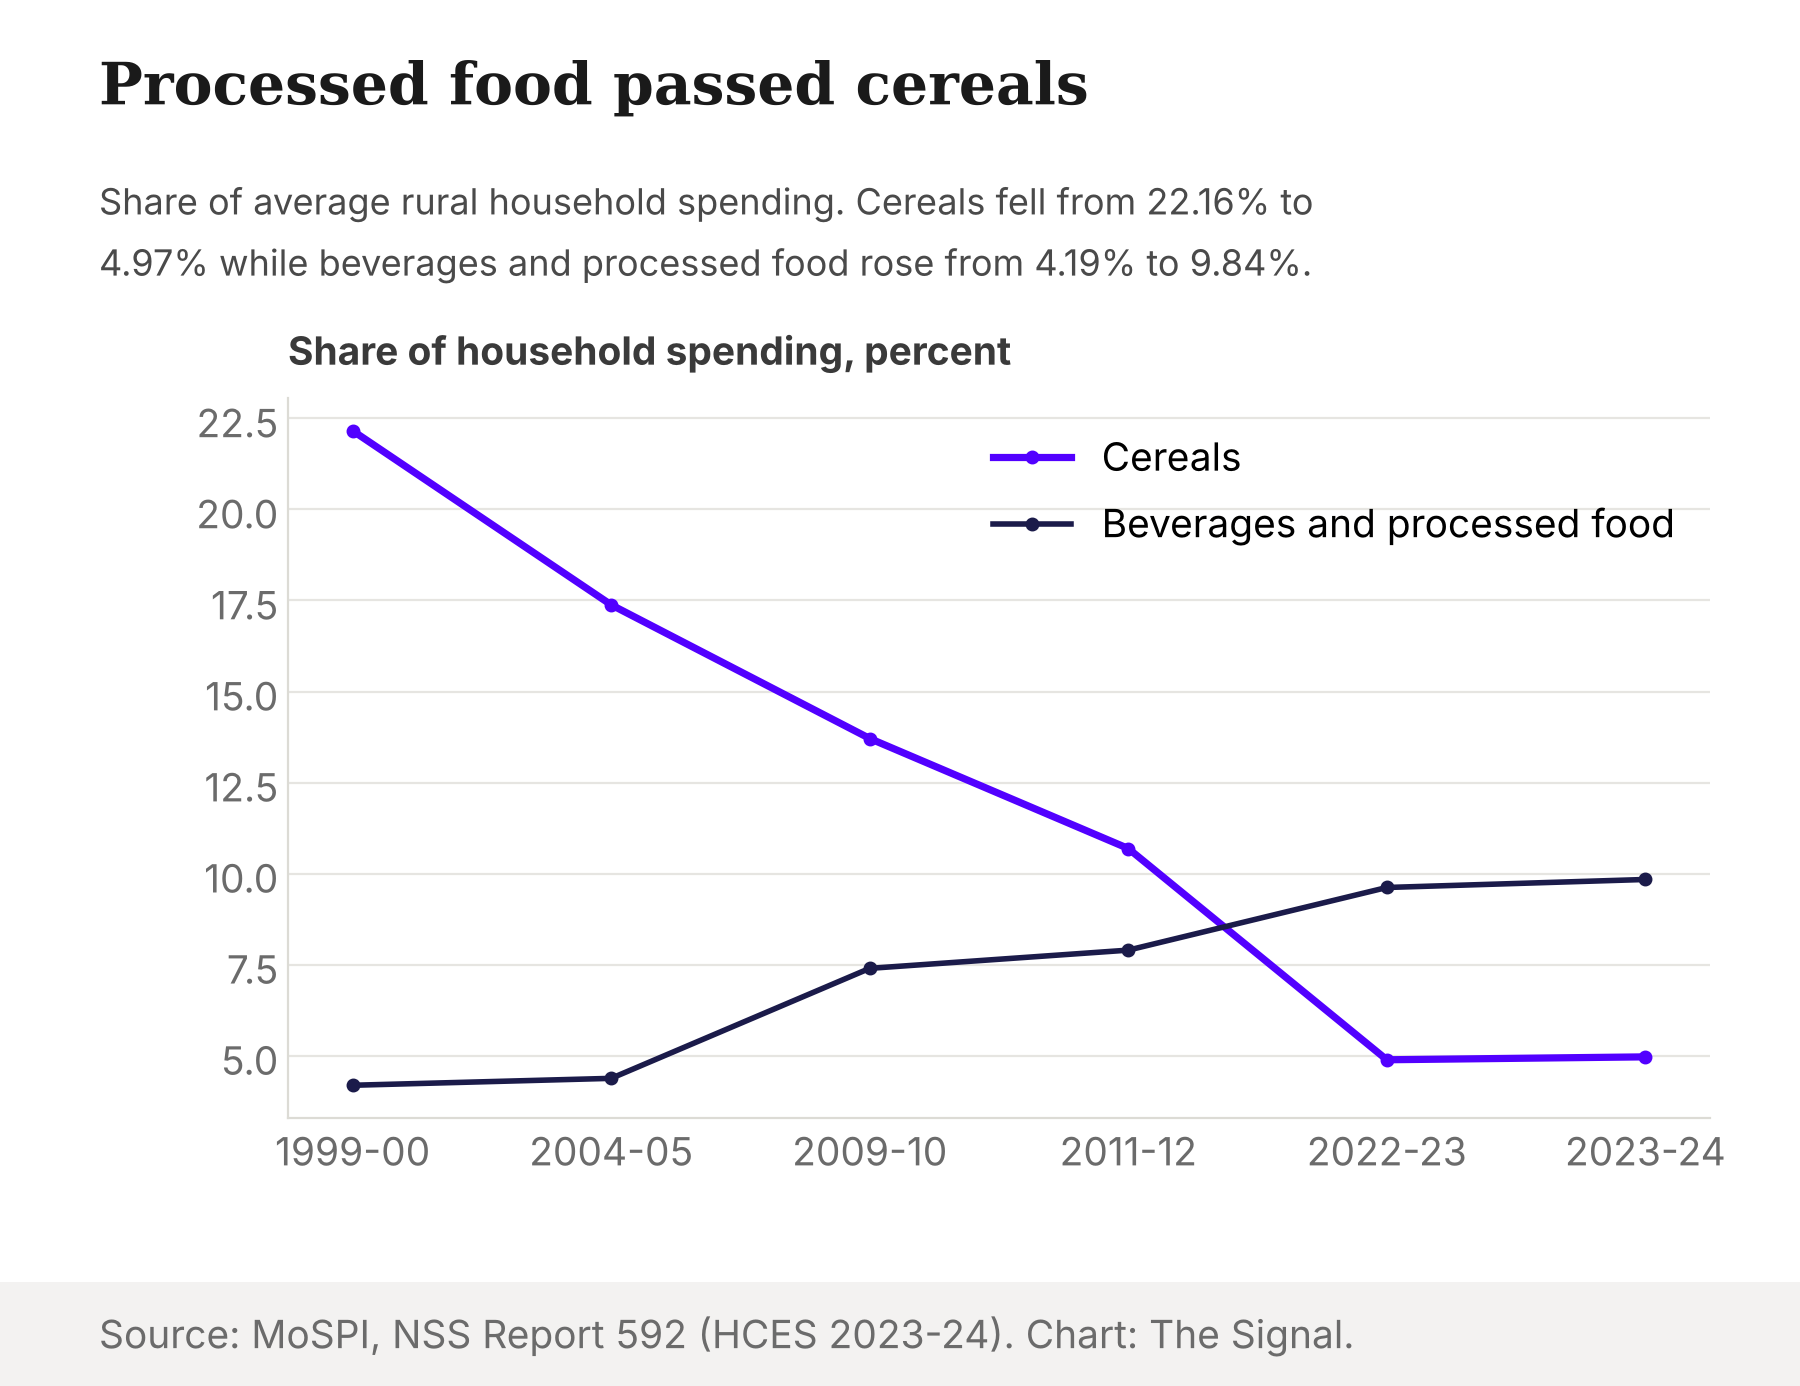
For most of the last quarter century, the Indian household budget was a grain bowl with other things around it. In rural India in 1999-00, cereals took 22.16 percent of average household spending, against 4.19 percent for beverages and processed food. By 2023-24 those numbers had crossed: cereals were down to 4.97 percent and processed food and beverages were up to 9.84 percent.
The usual reading is that Indians are getting richer and eating differently, so food matters less for prices. That reading is half right. It is worth slowing down on the other half.
The plate has moved
The 2023-24 Household Consumption Expenditure Survey is the newest national snapshot of what households buy. In rural India, processed food and beverages were the largest food item at 9.84 percent of spending, followed by milk at 8.44 percent and vegetables at 6.03 percent, while cereals and cereal substitutes took about 4.99 percent. That is roughly two rupees on processed food for every rupee on cereals.
The urban gap is wider. In urban India, beverages, refreshments and processed food took 11.09 percent, followed by milk at 7.19 percent and vegetables at 4.12 percent. Cereals took 3.76 percent in the same table, so urban households spent nearly three times as much on processed food as on grain.
The whole food share has shrunk too. MoSPI reports that food fell from 59.40 percent of rural spending in 1999-00 to 47.04 percent in 2023-24, and from 48.06 percent to 39.68 percent in urban areas.
Two cautions apply. The survey covers 2023-24, so it is not a picture of spending today. And "processed food" is a broad bucket that includes beverages and refreshments, not only packaged goods.
The basket was rebuilt to follow
The consumer price index is only as good as its weights. The old series carried weights from 2011-12. The new 2024-base series does not. MoSPI says the revised weights reflect household spending patterns captured in HCES 2023-24, and that the food and beverages share is lower, though still the largest component.
The headline figure is that food and beverages fell to 36.75 percent of the basket from 45.86 percent. Part of that drop is bookkeeping. On the old classification, MoSPI says the share would have fallen from 45.86 percent to 40.10 percent. The rest of the gap to 36.75 percent comes from reclassifying items under the new structure.
The new basket is also wider. The number of weighted items rose from 299 to 358. The measuring stick now looks a lot more like the budget the survey describes.
Half of the inflation from a third of the basket
Here is the figure that carries the argument. Retail inflation was 5.54 percent in September 2026, with food inflation on the Consumer Food Price Index at 7.74 percent. The food and beverages division ran at 7.36 percent, restaurants and accommodation at 9.36 percent, and housing at 2.74 percent.
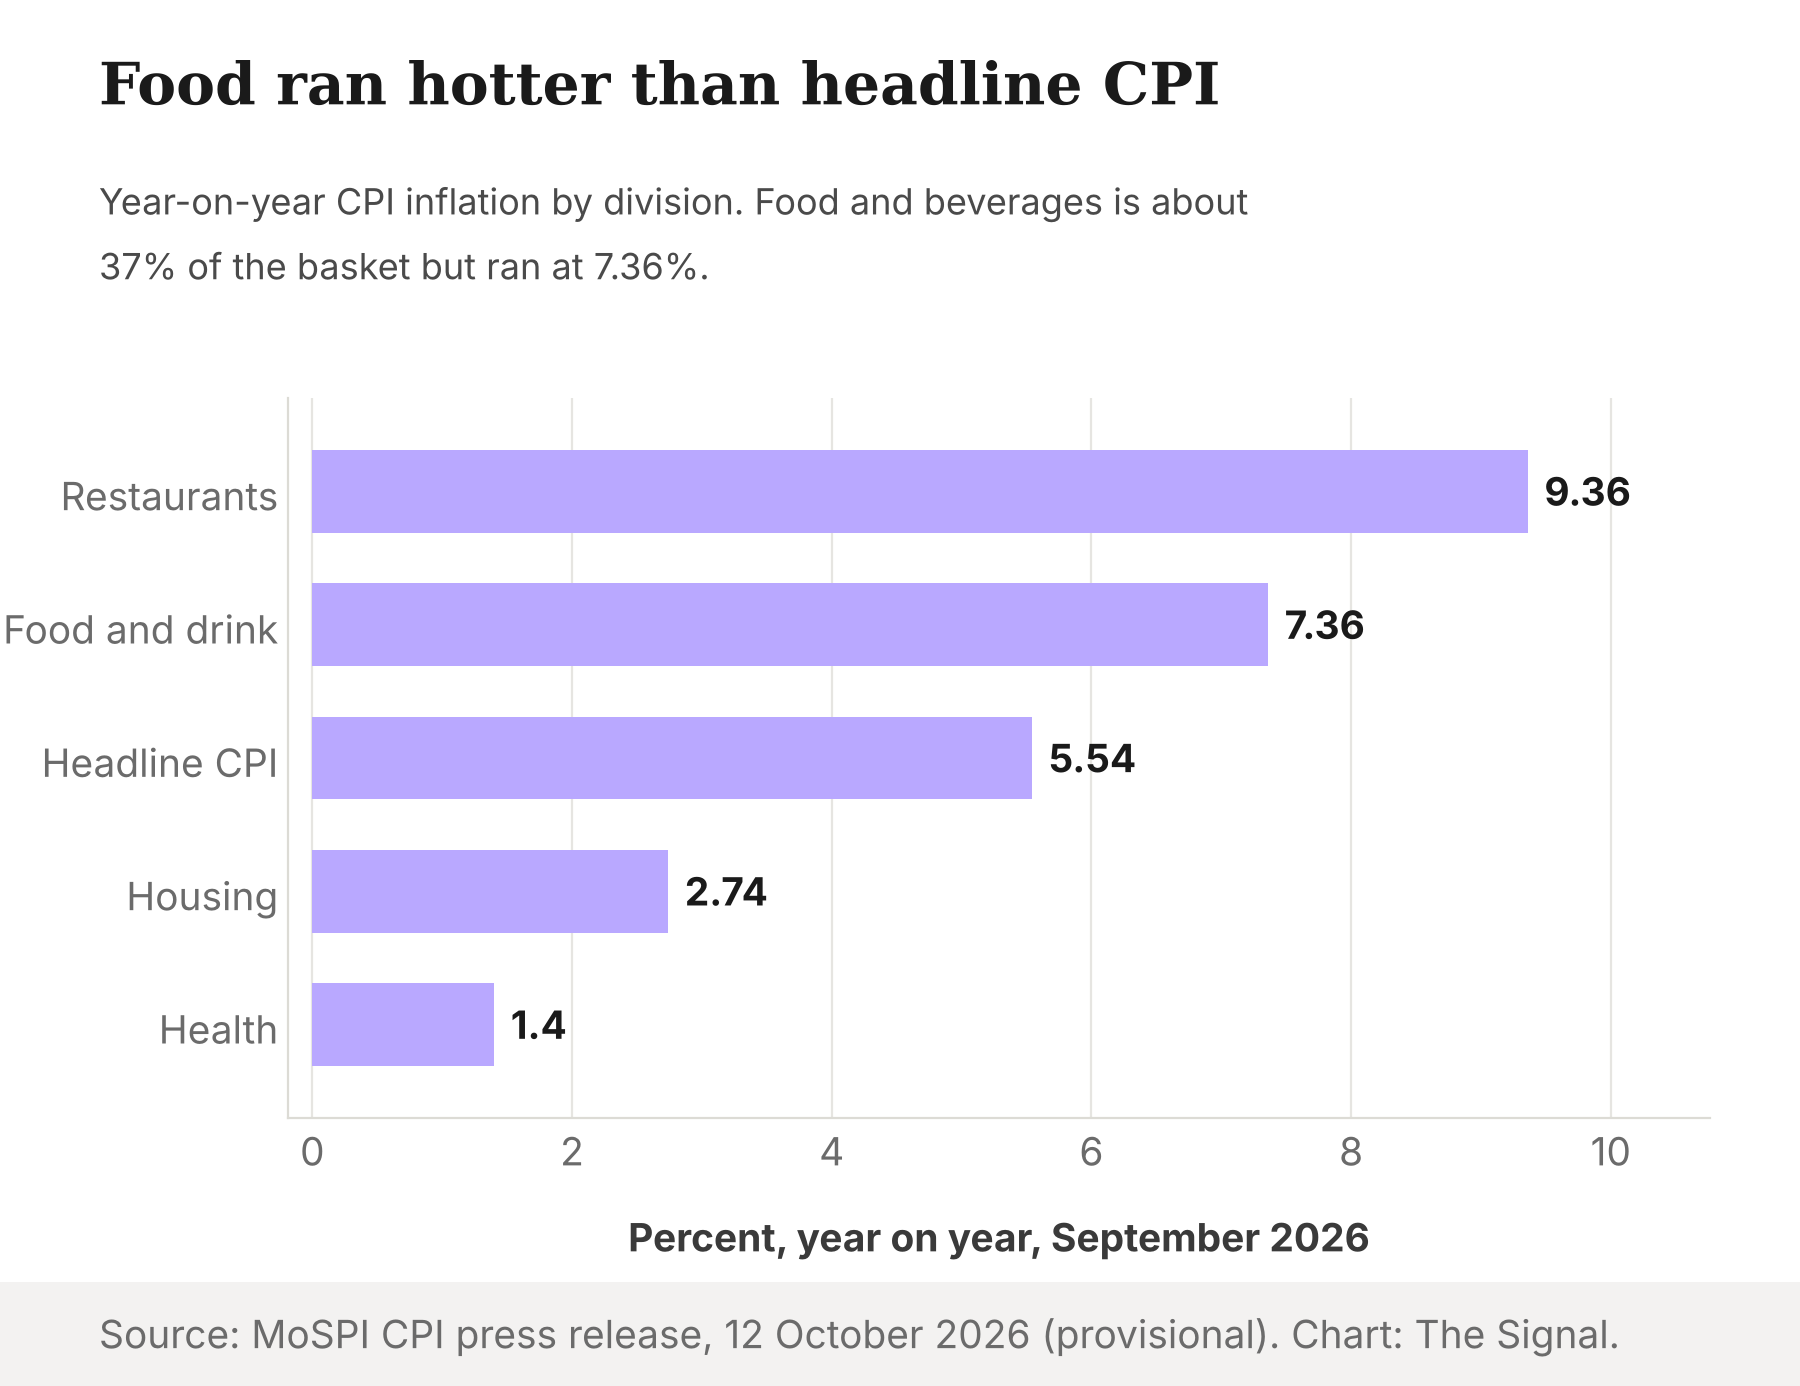
Multiply the division's 36.75 percent weight by its 7.36 percent inflation and you get about 2.7 percentage points. Set against the 5.54 percent headline, that is close to half. This is our calculation, and it is approximate: it uses base-period weights, while the true contribution drifts as relative prices change. The direction is not in doubt.
Food and beverages is about 37 percent of the basket, yet it supplied roughly half of the headline. Even after the rebuild, the shrinking budget share has not made food a minor driver of inflation.
Why the plate and the price are different stories
The spending shift and the inflation story point in different directions because they measure different things. A budget share tells you what households buy. An inflation print tells you what moved. The categories that moved in September were not grain or packaged snacks.
Onion inflation was 108.09 percent in September 2026, the highest of any key item, and onion's CPI weight is just 0.7006. A single vegetable with a tiny weight can lift the food division on its own. The data we hold here do not break down how much of the food print comes from vegetables, so we do not claim a figure for it.
What we can say is narrower. Cereals no longer anchor household spending, but the food division still dominates the inflation arithmetic. A lower weight was not enough to take food out of the driver's seat.
The honest objection
The strongest counterargument is that the story is a base effect. Food is still the largest component of the basket, so a high food print will always move the headline most. On that view nothing needs explaining.
There is something to that. A division with the largest weight and 7.36 percent inflation will contribute the most, almost by construction. But the objection concedes the point that matters. If food still decides the headline, then a policy debate built around grain stocks misses part of the picture, because spending has moved toward milk, vegetables and processed items. Our calculation also cannot say how much of the contribution is vegetables versus processed food. That needs the item-level table, which this piece does not use.
A second objection is vintage. The weights come from the 2023-24 survey, and the September print is provisional. Both are fair, and both are why the figures here are stated with their periods.
The Signal
The grain bowl has gone from more than a fifth of a rural budget to about a twentieth. The inflation that households feel did not follow it out. MoSPI will release October's CPI on 12 November 2026. Watch whether the food division stays near the 7 percent mark and whether its roughly 2.7-point contribution holds. If it does, the new basket has not made food inflation less important to the headline. It has only moved it from the grain bowl to the vegetable bag.
Reporting basis: every figure in this piece comes from one origin, the Ministry of Statistics and Programme Implementation. The spending shares are from MoSPI's NSS Report 592 on the 2023-24 Household Consumption Expenditure Survey, the inflation figures are from MoSPI's CPI press release of 12 October 2026 (provisional), and the weights are from MoSPI's CPI 2024 technical note, as relayed by PIB. We verified each against the primary documents, but no independent second origin backs them, so the load-bearing claims rest on one compiler. The roughly 2.7-point contribution and the "about half" share are The Signal's calculations from those figures.