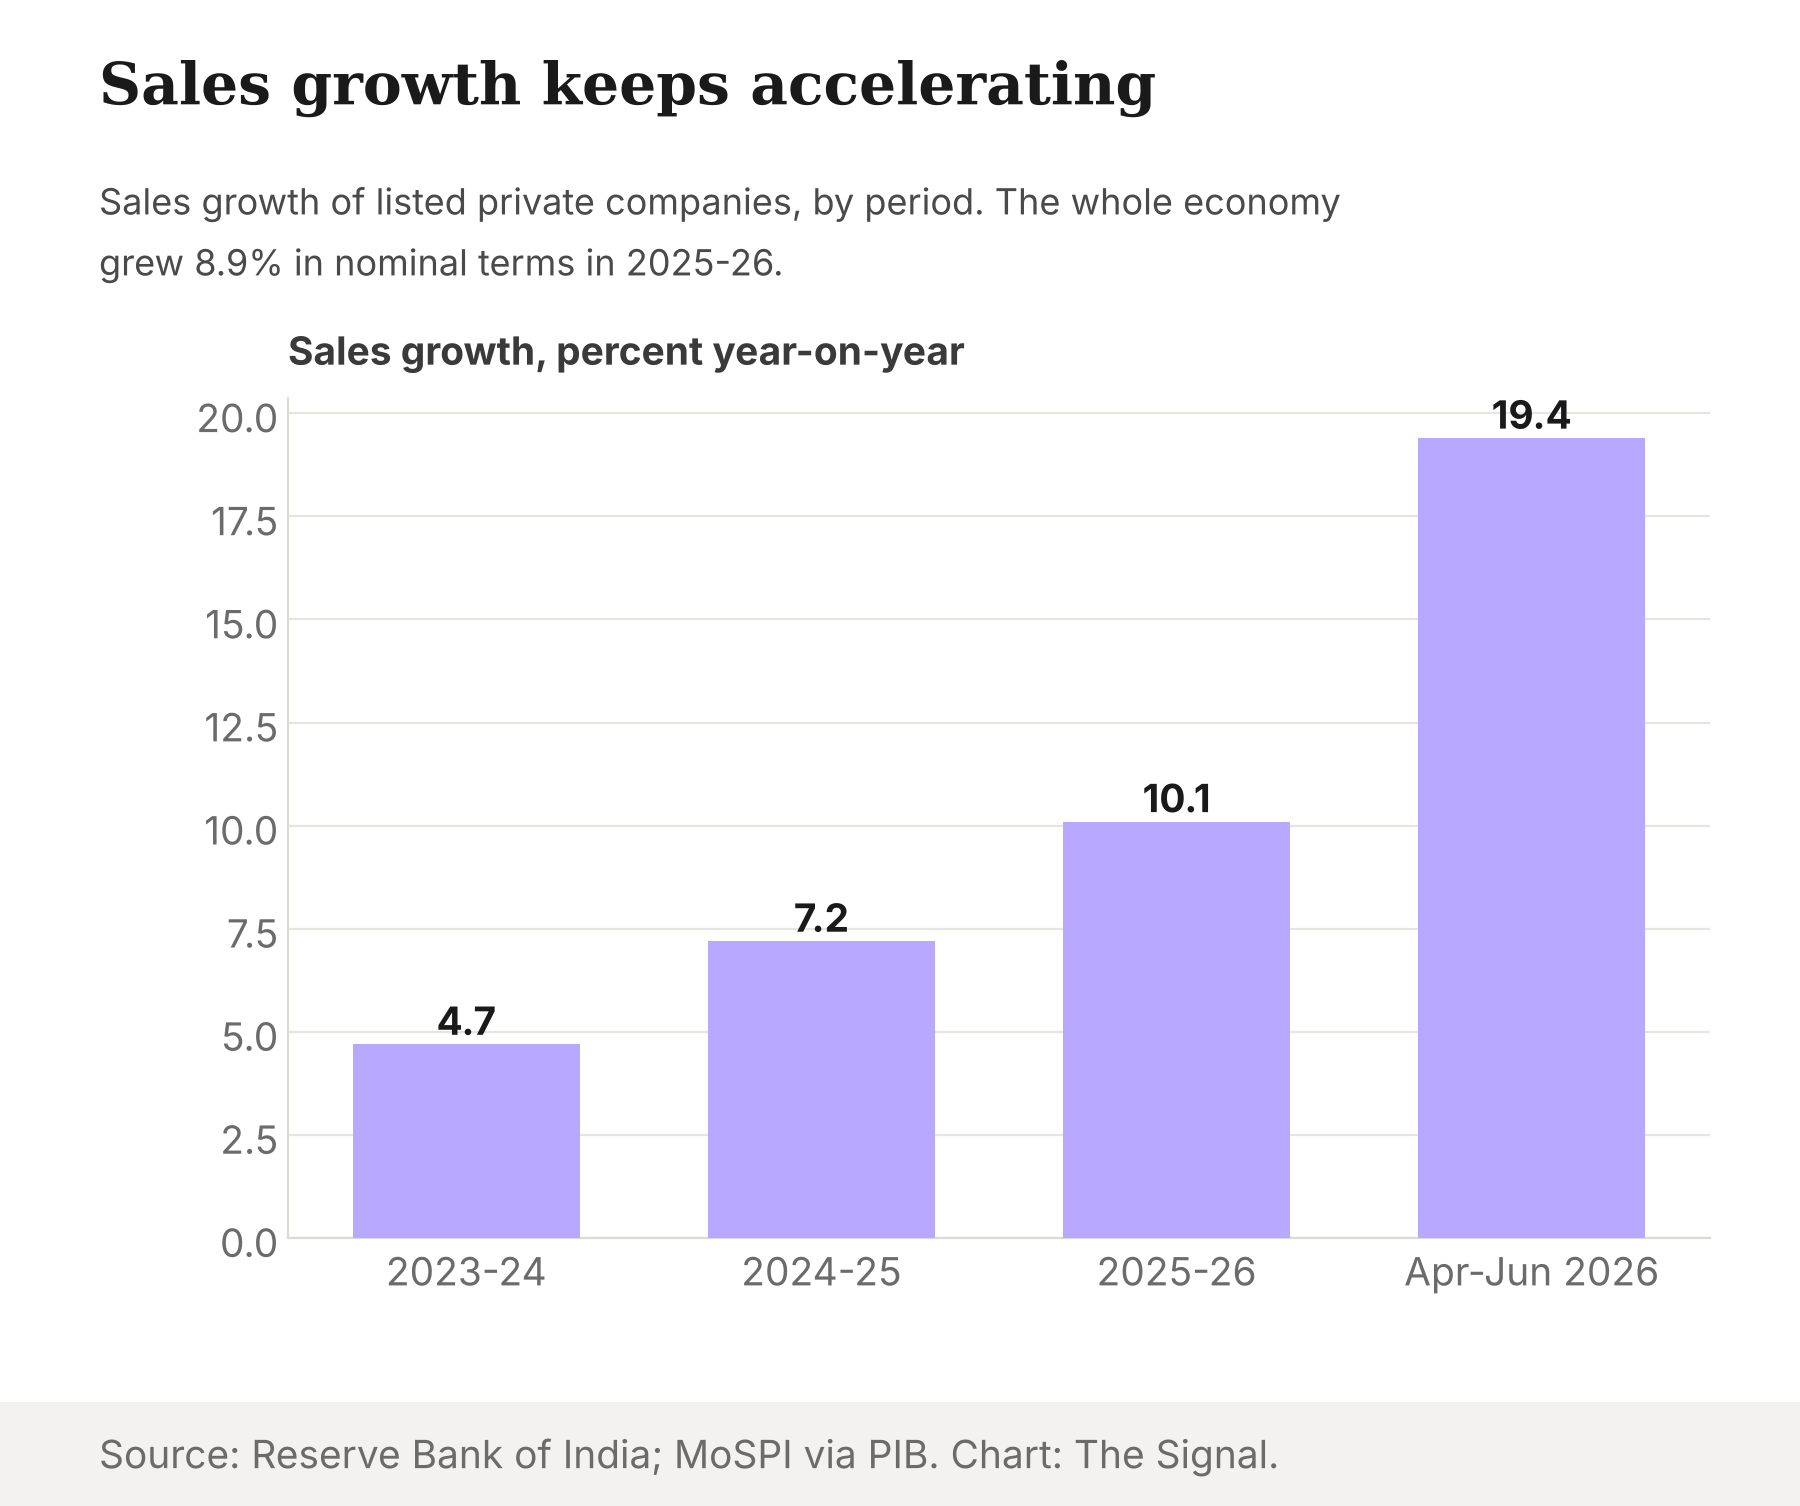
The headline number from the Reserve Bank of India's latest corporate results is a good one. Sales of listed private non-financial companies grew 19.4 percent year on year in the April to June 2026 quarter, up from 13.9 percent in the quarter before, according to the RBI's data on 3,247 listed companies. For manufacturers the figure was 21.4 percent. A company selling a fifth more than it did a year ago is, on the usual reading, a company having a very good year.
That reading skips the cost side of the ledger, and the cost side is where this quarter gets strange.
The bill rose faster than the sales
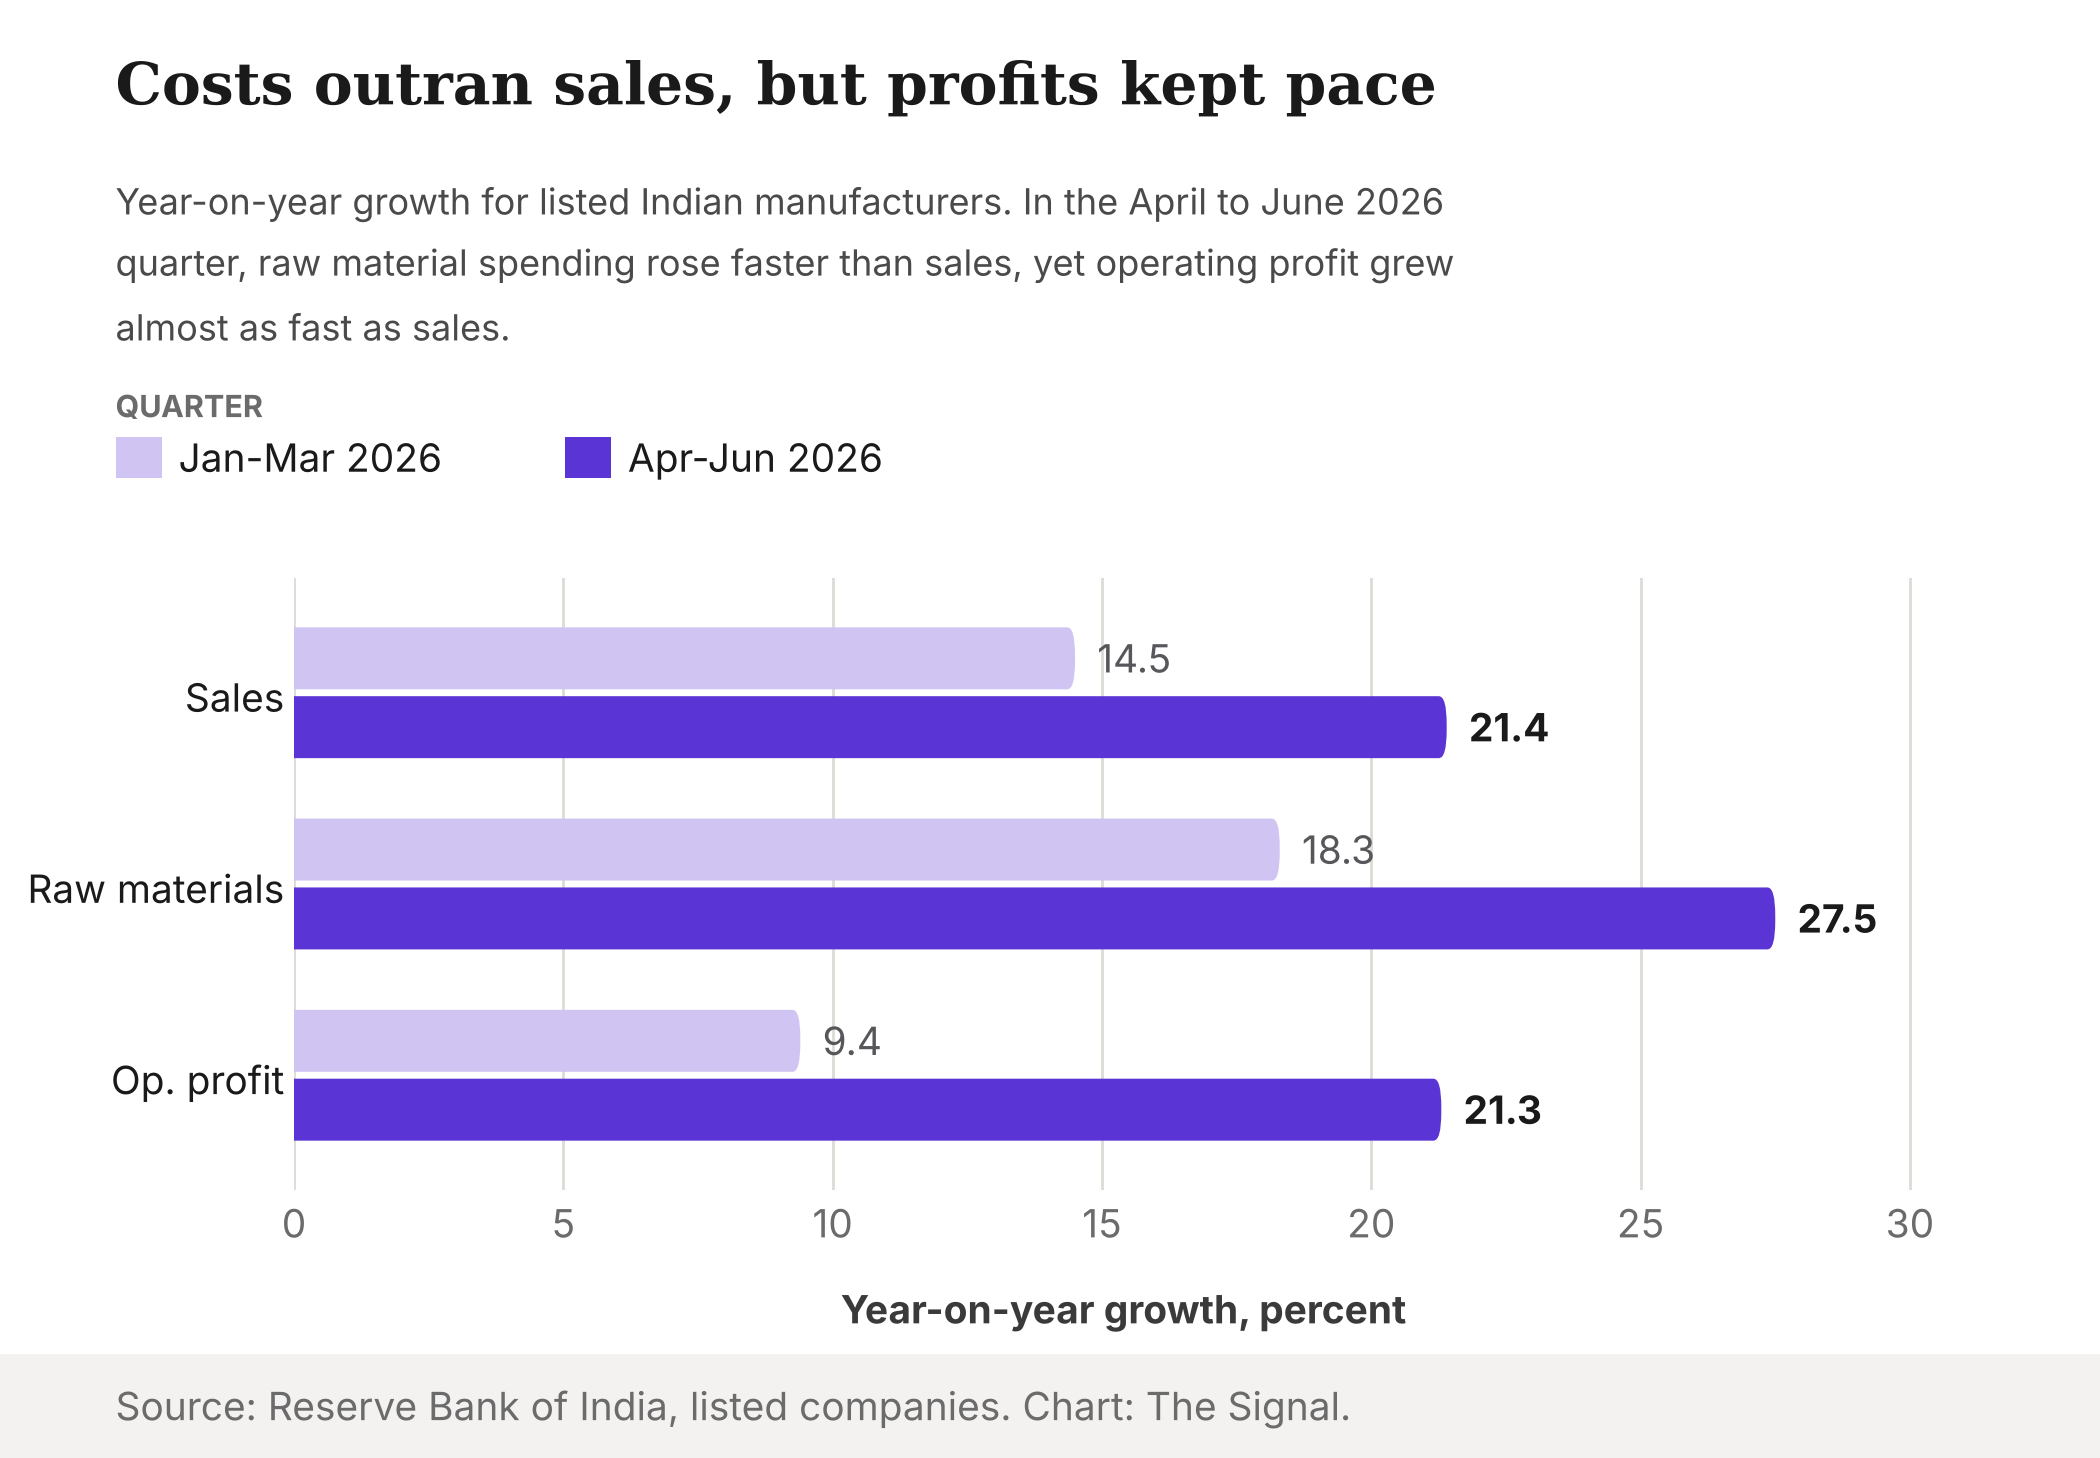
In the same quarter, raw material expenses of listed manufacturers rose 27.5 percent year on year, which the RBI ties to "global supply chain disruptions". That is six percentage points faster than their sales growth of 21.4 percent. A firm whose biggest input costs grow faster than its revenue should see its margin squeezed. This is the ordinary arithmetic of a factory.
The ordinary arithmetic did not show up in profits. Manufacturers' operating profit grew 21.3 percent, a hair below sales growth of 21.4 percent. In plain terms, profit kept pace with sales even though the raw material bill ran well ahead of both. The RBI's own heading for this section of the release is "Pricing power".
One quarter earlier, the squeeze was real
The pivot is clearer against the previous quarter. In January to March 2026, raw material expenses of manufacturers rose 18.3 percent year on year, and raw material spending reached 58.5 percent of sales, up from 57.5 percent the quarter before. Manufacturing operating profit growth slowed to 9.4 percent from 11.8 percent. That is what a squeeze looks like: costs accelerate, profit growth fades.
Then the pattern broke. Operating profit growth jumped to 21.3 percent from 9.4 percent in April to June, even as raw material growth went from 18.3 to 27.5 percent. Costs accelerated by nine points. Profit growth accelerated by twelve.
| Listed manufacturers, year-on-year growth | Jan to Mar 2026 | Apr to Jun 2026 |
|---|---|---|
| Sales | 14.5% | 21.4% |
| Raw material expenses | 18.3% | 27.5% |
| Operating profit | 9.4% | 21.3% |
Source: RBI press releases on Q4 2025-26 and Q1 2026-27 results.
The full year told a milder version of the same story
The shape was visible across all of 2025-26. Aggregate sales growth of listed private companies reached 10.1 percent, after single-digit growth in the previous two years, and manufacturing sales grew 10.8 percent against 6.0 percent a year earlier. The year before, growth had been 7.2 percent, up from 4.7 percent.
Costs rose too. Manufacturers' raw material-to-sales ratio climbed to 57.6 percent in 2025-26 from 55.7 percent, which the RBI reads as input cost pressure. The margin consequence was uneven, so the table below keeps sectors apart.
| Operating profit margin, 2025-26 | Level | Change from 2024-25 |
|---|---|---|
| Manufacturing | 13.9% | down 30 basis points |
| Non-IT services | 20.0% | down 210 basis points |
| IT | 22.4% | up 50 basis points |
Source: RBI, Performance of Private Corporate Business Sector during 2025-26. A basis point is one hundredth of a percentage point.
So the cost shock did bite in 2025-26, trimming manufacturing margins slightly and non-IT services margins sharply. Then the next quarter reversed the pressure. On a sequential basis, operating margins improved across all major sectors in April to June 2026.
Is this a boom or a pass-through?
Sales growth for listed companies is now far above the pace of the economy that contains them. India's nominal GDP grew 8.9 percent in 2025-26, compared with 10.1 percent sales growth for listed companies over the same year. Nominal means before adjusting for price rises, so it includes inflation.
That matters for how to read the 19.4 percent. When input prices rise sharply, a company that passes them on shows higher revenue. Sales can grow fast without a single extra unit moving. The RBI's "pricing power" label points the same way: firms were able to hold margins while their costs jumped. The data cannot say how much of the sales growth is volume and how much is price, because the releases report values, not units.
The honest objection
The strongest counterargument is that this is simply good news. Faster sales, steady profit and, for manufacturers, interest coverage that improved to 10.2 in the latest quarter, all describe healthy balance sheets. Interest coverage is the ratio of earnings before interest and tax to interest expenses, and a higher number means debt is easier to service. For a lender or an investor in these firms, the quarter is a strong one.
That is true, and nothing here disputes it. The point is narrower. A listed manufacturer's profit is one side of a transaction. If its raw material costs rose 27.5 percent and its profit did not suffer, either it found savings, or its customers paid more. The RBI data suggest the second explanation is at least part of the picture, but they do not prove it. Another gap is coverage: these are listed companies, and smaller unlisted firms with less leverage over prices may have fared differently.
The Signal
India's listed manufacturers have shown, for one quarter, that they can absorb a 27.5 percent jump in raw material costs without giving up profit growth. That is a sign of strength, and it is also a transfer. The cost did not vanish. It moved downstream, to wholesale buyers, retailers or consumers, or upstream to suppliers.
Two things are worth watching in the RBI's next release. The first is whether the raw material-to-sales ratio, 58.1 percent in April to June 2026, keeps falling as input costs settle, or whether margins give back what this quarter held. The second is whether services firms, whose margins fell furthest in 2025-26, can repeat the manufacturers' trick.
A cost shock that leaves profits intact has not disappeared. It has found someone else's ledger. The 21.3 percent profit growth is the visible half of that story.
Reporting basis: Every company figure in this piece comes from the Reserve Bank of India's own press releases on the results of listed non-government non-financial companies, the full-year release for 2025-26 (4,278 companies), the Q4 2025-26 release (3,266 companies) and the Q1 2026-27 release (3,247 companies), plus its 2024-25 release. The coverage of companies varies by period, so growth rates compare different company samples. The GDP figure is from the Ministry of Statistics and Programme Implementation's provisional estimates, as published by the Press Information Bureau. That makes two independent origins in total, and the entire corporate story rests on one: the RBI. The RBI's interpretations ("input cost pressure", "pricing power") are its own. The claim that costs were passed to customers is The Signal's inference, not a reported finding. Differences between growth rates and the comparison with nominal GDP growth are The Signal's calculations from those figures.