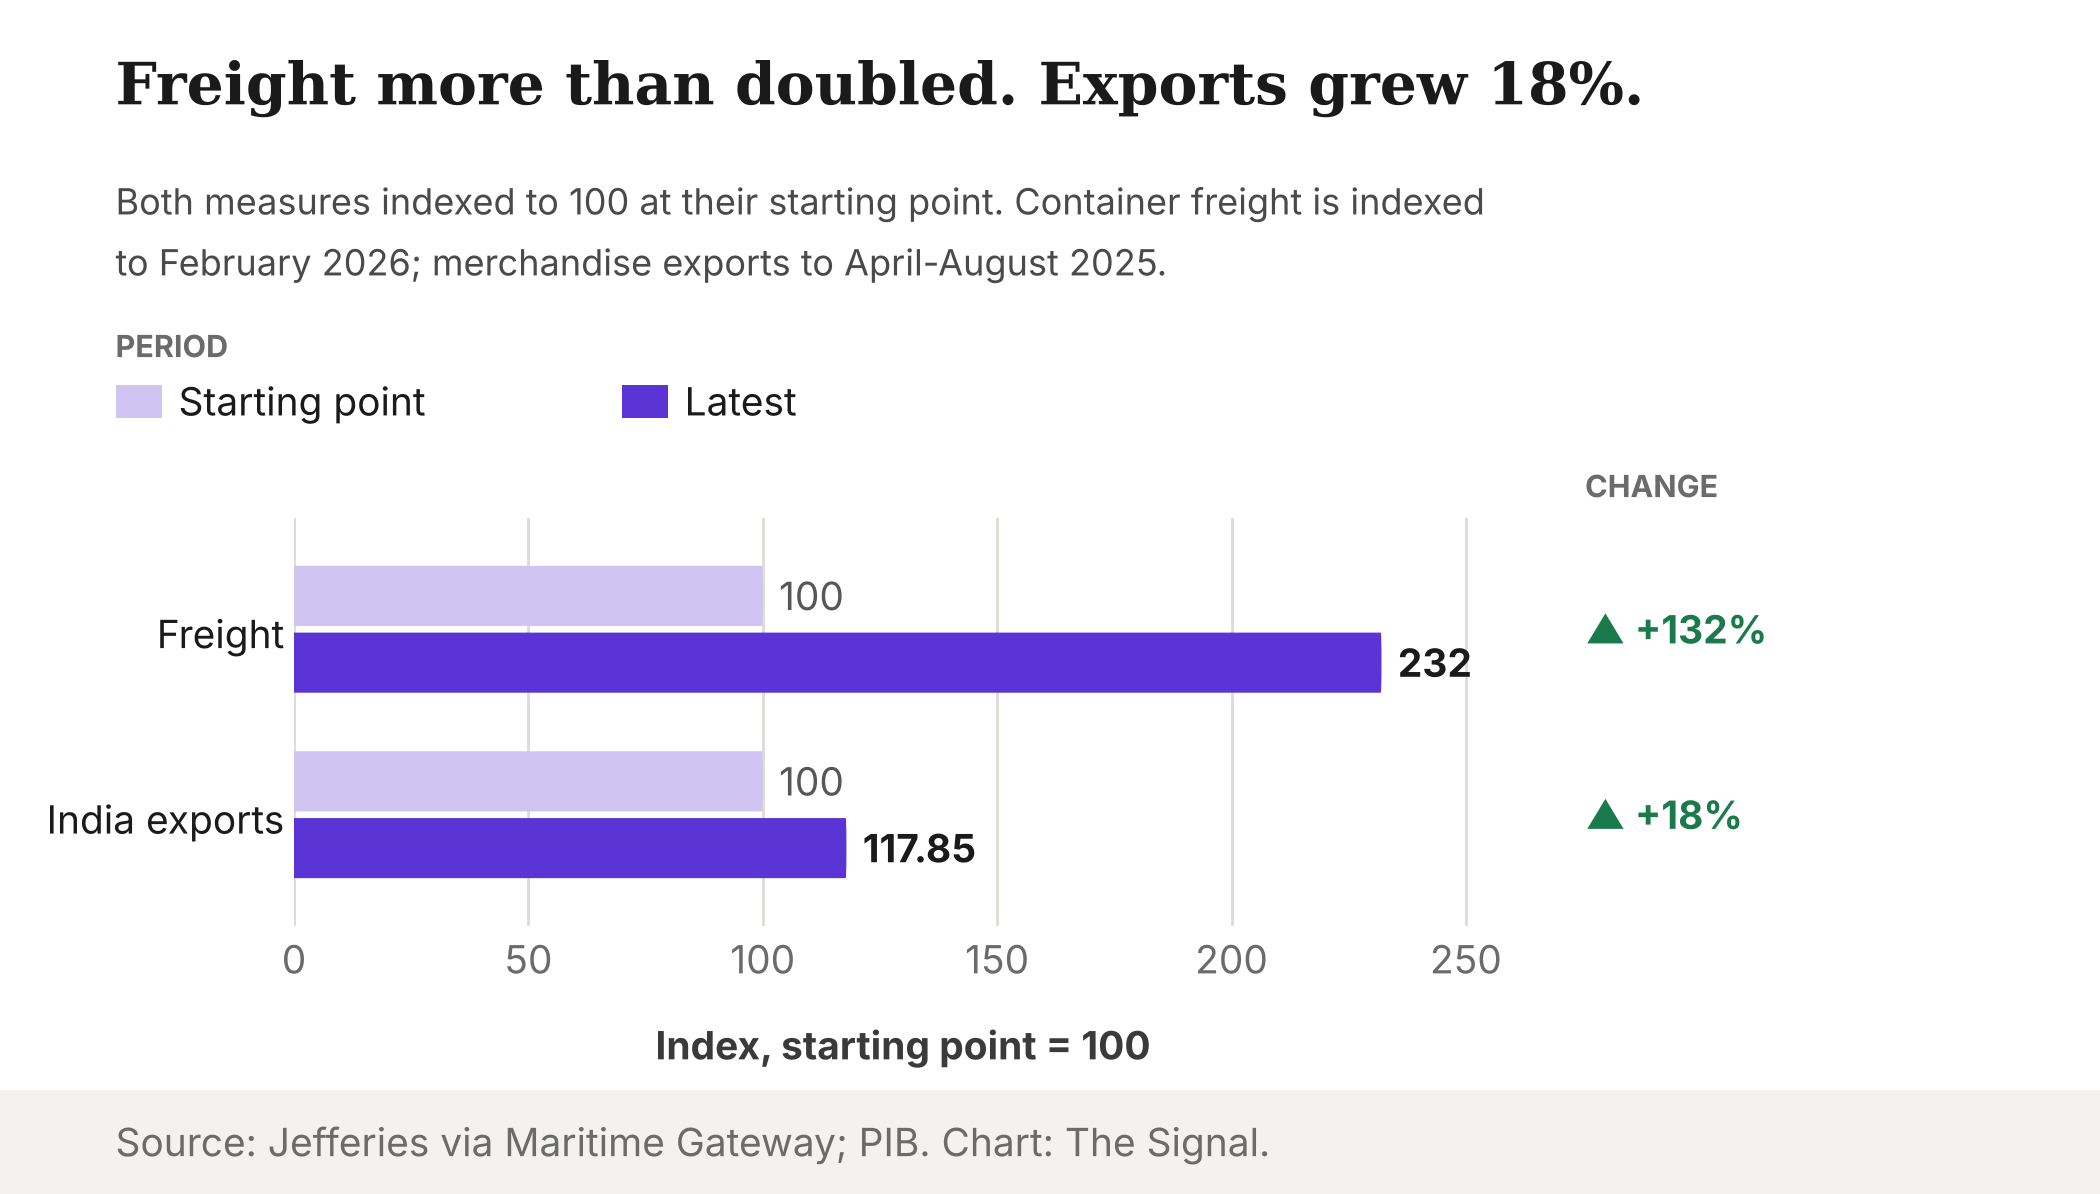
The expected story about 2026 shipping is a squeeze. Global container freight rates rose 132% from their February levels, according to a Jefferies report, as reported by Maritime Gateway in September. Jefferies attributed the rise to tensions in the Middle East, early peak-season shipments and the Chinese Golden Week. A rate that has more than doubled in six months should, on the usual reasoning, eat into the margins of exporters and shrink what they send.
On the available figures, it has not. India's merchandise exports in April-August 2026-27 were US$215.91 billion, against US$183.21 billion a year earlier, growth of 17.85%, according to the Ministry of Commerce and Industry. July alone brought US$44.24 billion, against US$36.98 billion in July 2025, a rise of about 20%. Freight more than doubled and exports grew by close to a fifth.
Freight rose 132%. Exports rose 17.85%. The two lines are moving in the same direction.
The chart indexes each series to 100 at its own starting point. The periods differ, because Jefferies measures from February while the ministry compares April-August with the year before, so read it as a rough contrast, not a precise ratio.
It is worth slowing down on what this does and does not show. It does not show that freight is harmless. A rate is a cost, and a cost that high must be hurting someone. What the figures show is that the damage is not landing on the total.
The cargo moved, it did not stop
The same Jefferies note carries the clue. Exports to the United States increased 22% year on year, while shipments to the United Arab Emirates and Saudi Arabia declined between 17% and 26%. In the same note, India's port volumes increased 7% year on year in August 2026.
Put those together and the shock looks like a reallocation. The Gulf lanes, the ones closest to the Middle East tensions Jefferies names, lost volume. The long haul to the United States gained it. A 22% rise to the US against a 17% to 26% fall to two Gulf buyers is a gap of 39 to 48 percentage points between lanes, and the total still grew.
Jefferies does not say why exporters chose this path, so the explanation below is our reading, not its finding.
What is carrying the total
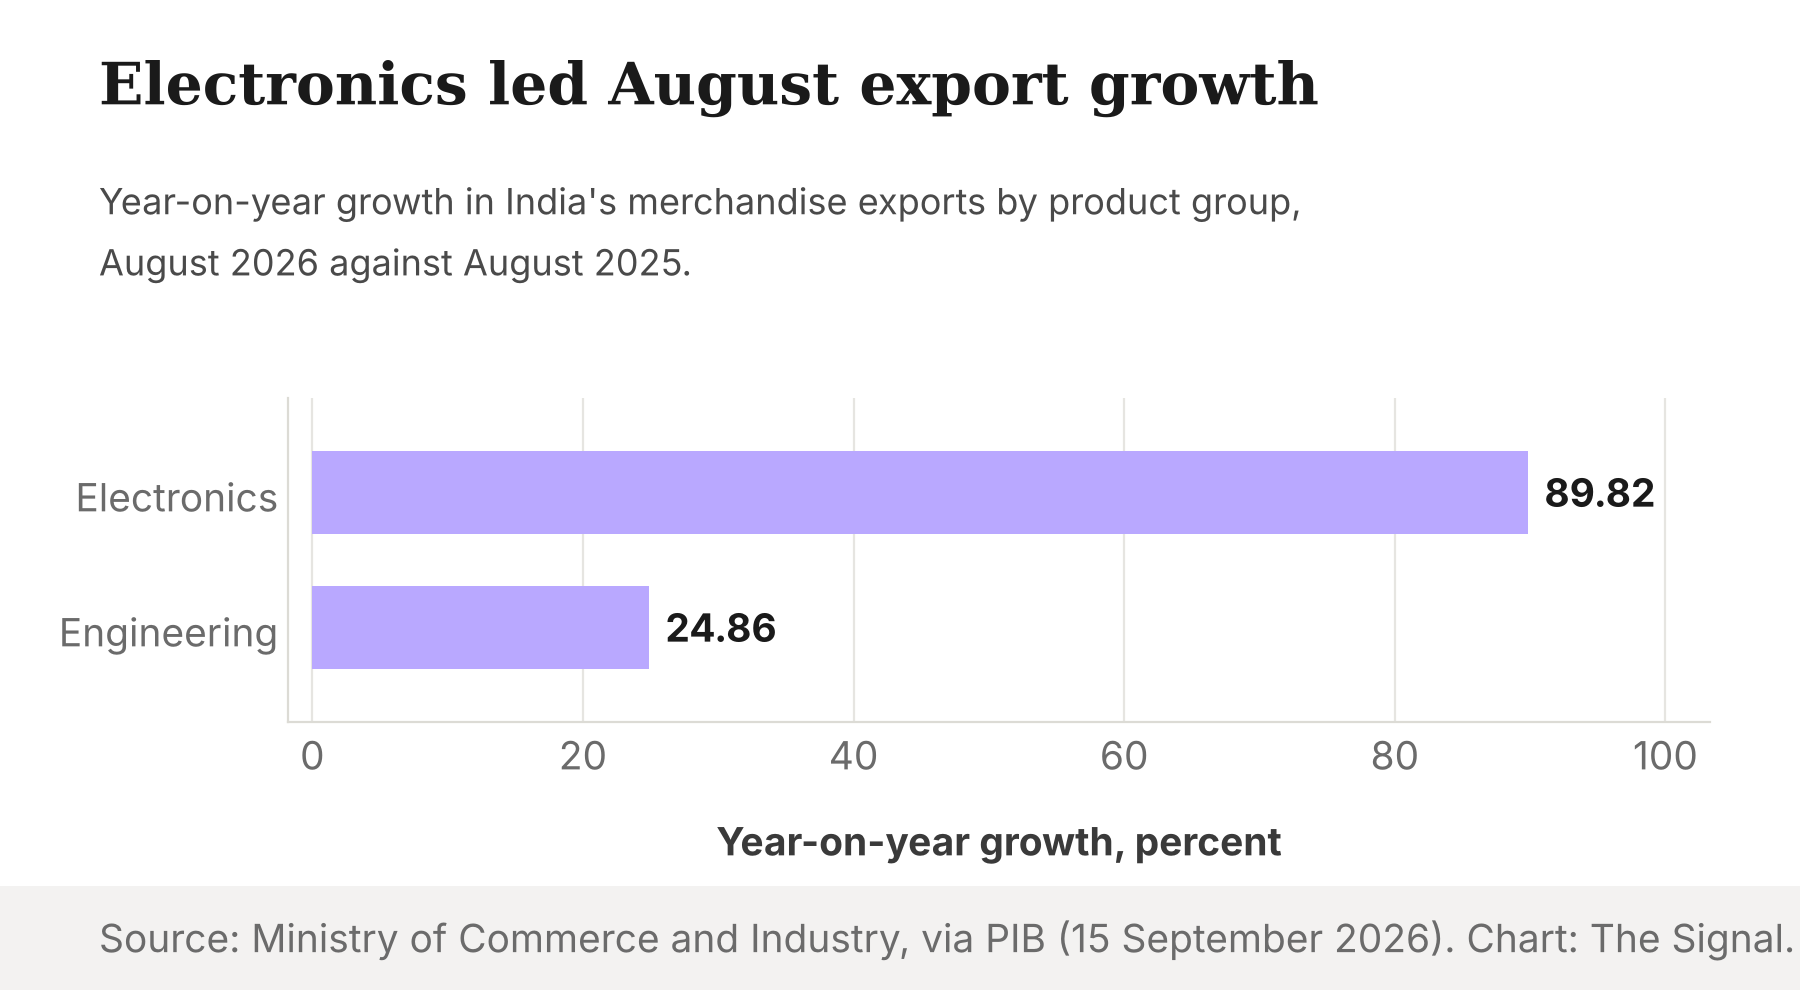
Two product groups explain a large part of the growth in August. Electronic goods exports increased by 89.82%, from US$2.93 billion in August 2025 to US$5.55 billion in August 2026. Engineering goods exports increased by 24.86%, from US$9.87 billion to US$12.32 billion.
A plausible reading is that the electronics and engineering goods leading the growth can absorb a freight spike better than bulky, low-value goods could. This is an inference. None of the sources reports freight as a share of the price of these goods, so treat it as a hypothesis worth testing, not a finding.
Where the new trade deal fits
India's newest trade agreement lands in the middle of this. New Zealand and India have ratified the agreement, paving the way for entry into force on 20 October 2026, according to New Zealand's Ministry of Foreign Affairs and Trade. India's commerce ministry says the FTA provides duty-free access for 100% of India's exports to New Zealand, covering all tariff lines.
That is a real tariff cut. It is also a small market. India-New Zealand two-way total trade amounts to NZ$3.95 billion annually. Set that beside the US$44.24 billion India shipped in July alone, allowing for the difference in currency and for the fact that the NZ figure covers trade in both directions, and the deal is a rounding error on the monthly total. The tariff cut matters for the specific exporters who use it. It is not what is steering India's export numbers this year.
The honest objection
The strongest case against the reading above is that dollar values flatter volumes. Export value can rise because prices rise, and the figures here are in current US dollars. If prices for some exported goods climbed, the growth would overstate the physical cargo moved, and the freight squeeze could still be biting on volumes underneath. The 7% rise in port volumes is consistent with real growth in boxes, but it is a Jefferies figure for August only, and it covers imports as well as exports.
A second objection is timing. The freight series starts in February and the export comparison runs April to August, so the two are not a clean experiment. Freight could be hurting margins now in ways that will reach export orders later, after today's contracts roll off.
Both points are fair. Neither explains away the Gulf-versus-US split, which is the part of the picture that is directly reported and hard to reconcile with a simple "freight is crushing exporters" story.
The Signal
A 132% rise in container freight is a large shock, and so far it has changed where India's cargo goes more than whether it goes. Shipments to the Gulf fell and exports to the United States rose, and the goods leading the export numbers appear best placed to carry the cost. The watch point is whether the Gulf decline is temporary, tied to the tensions Jefferies names, or the start of a permanent shift in which lanes Indian exporters rely on. If freight stays high into 2027, the exporters in the cheap, bulky categories are the ones that will show the damage first.
Reporting basis (Ministry of Commerce and Industry via PIB, Jefferies via Maritime Gateway): export, product-group and cumulative figures are from the Ministry of Commerce and Industry's monthly releases for July and August 2026, via the Press Information Bureau, which is the single origin for all of them. The freight rate rise, port volumes and lane-level export changes come from one Jefferies research note, as reported by Maritime Gateway, and were not checked against the note itself; they rest on that single report. The FTA entry-into-force date and trade value are per New Zealand's Ministry of Foreign Affairs and Trade, and the duty-free claim is the Indian commerce ministry's own statement at signing. The indexed chart values, the roughly 20% July growth and the 39 to 48 point lane gap are The Signal's calculations from those figures.