On 16 October, Business Standard's Datanomics column ran under the headline that India's capital productivity has declined in recent years. The intuition is easy to follow. India invests a large share of its output, and growth has not climbed to the 8 percent the government says it needs, so more capital seems to be going in without more growth coming out.
It is worth slowing down on that. The official national accounts on the new 2022-23 base do not show capital getting less productive. They show the investment rate flat and growth rising, which is the opposite pattern.
Investment did not move. Growth did.
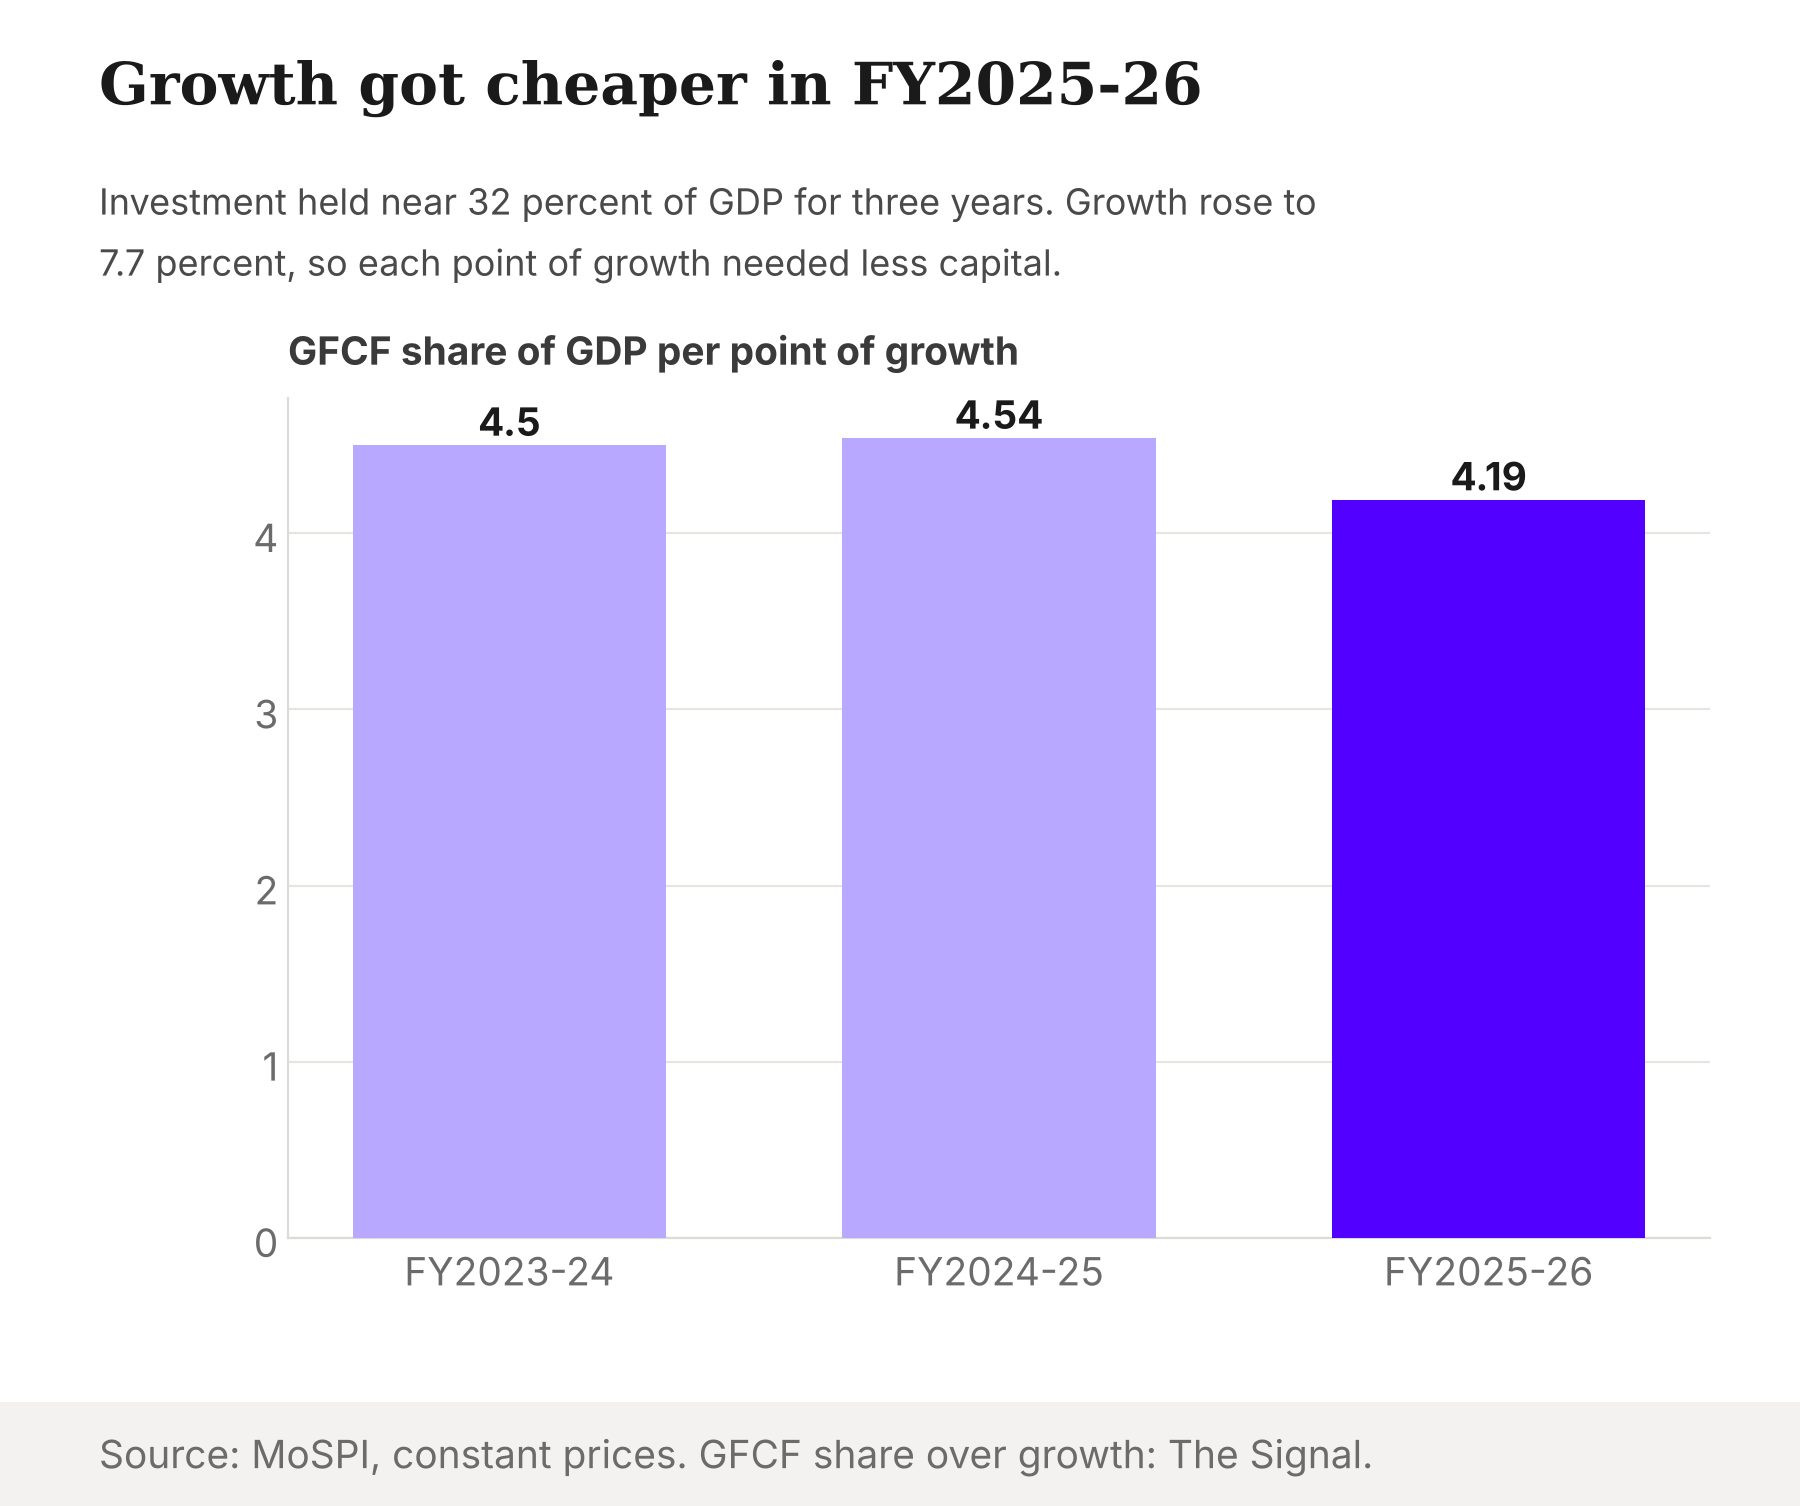
MoSPI estimates real GDP grew 7.7 percent in FY2025-26, against 7.1 percent in FY2024-25. In its constant-price table, real growth ran 7.2, 7.1 and 7.7 percent in FY2023-24, FY2024-25 and FY2025-26, while gross fixed capital formation (GFCF) held at 32.4, 32.4, 32.2 and 32.3 percent of GDP from FY2022-23 to FY2025-26. The investment share barely moved in four years. Growth moved by 0.6 points in the last one.
Divide the investment share by growth and the result is the capital India spends per point of growth. For FY2023-24 it is 4.50, for FY2024-25 4.54 and for FY2025-26 4.19. A lower figure means growth was cheaper. On the official data, the latest year is the best of the three.
What the column may be seeing
Two things can make the other reading feel right. The first is the long run. MoSPI released the new series with base year 2022-23 on 27 February 2026, so consistent figures on this base start only in FY2022-23. Any claim about a decade of decline has to splice old and new series, and the splice carries its own error.
The second is the first quarter of this fiscal year. In Q1 FY2026-27 GFCF at current prices was 34.3 percent of GDP, against 31.4 percent a year earlier. That is a sharp jump, and real GDP growth in the same quarter was 7.8 percent while GFCF at constant prices grew 11.9 percent. Investment rose far faster than output, which looks like falling productivity if the reader stops there.
Look at the constant-price levels and the picture changes. GFCF was ₹27,95,605 crore on GDP of ₹81,36,153 crore in Q1 FY2026-27, against ₹24,97,280 crore and ₹75,46,230 crore in Q1 FY2025-26. That is 34.4 percent of GDP against 33.1 percent. Quarterly growth was 7.8 percent against 6.9 percent. On the same ratio, capital per point of growth fell from 4.8 to 4.4 (our calculation, Q1 against Q1 to avoid seasonality). Investment jumped, and growth rose with it.
What 8 percent would cost
The case that matters is not whether productivity fell. It is what the growth goal requires. The Economic Survey 2024-25 said India must grow around 8 percent a year in real terms for at least a decade, which would require an investment rate of around 35 percent of GDP from around 31 percent. A parliamentary standing committee repeated the 35 percent figure in August 2025, as reported by PTI.
Hold capital efficiency at the FY2025-26 level of 4.19 and 8 percent growth needs an investment rate of 33.5 percent. At the FY2024-25 level of 4.54 it needs 36.3 percent. For 9 percent growth the range is 37.7 to 40.9 percent. India's constant-price GFCF share was 32.3 percent in FY2025-26. The gap to 8 percent is between 1.2 and 4.0 points of GDP, depending on which year's efficiency holds.
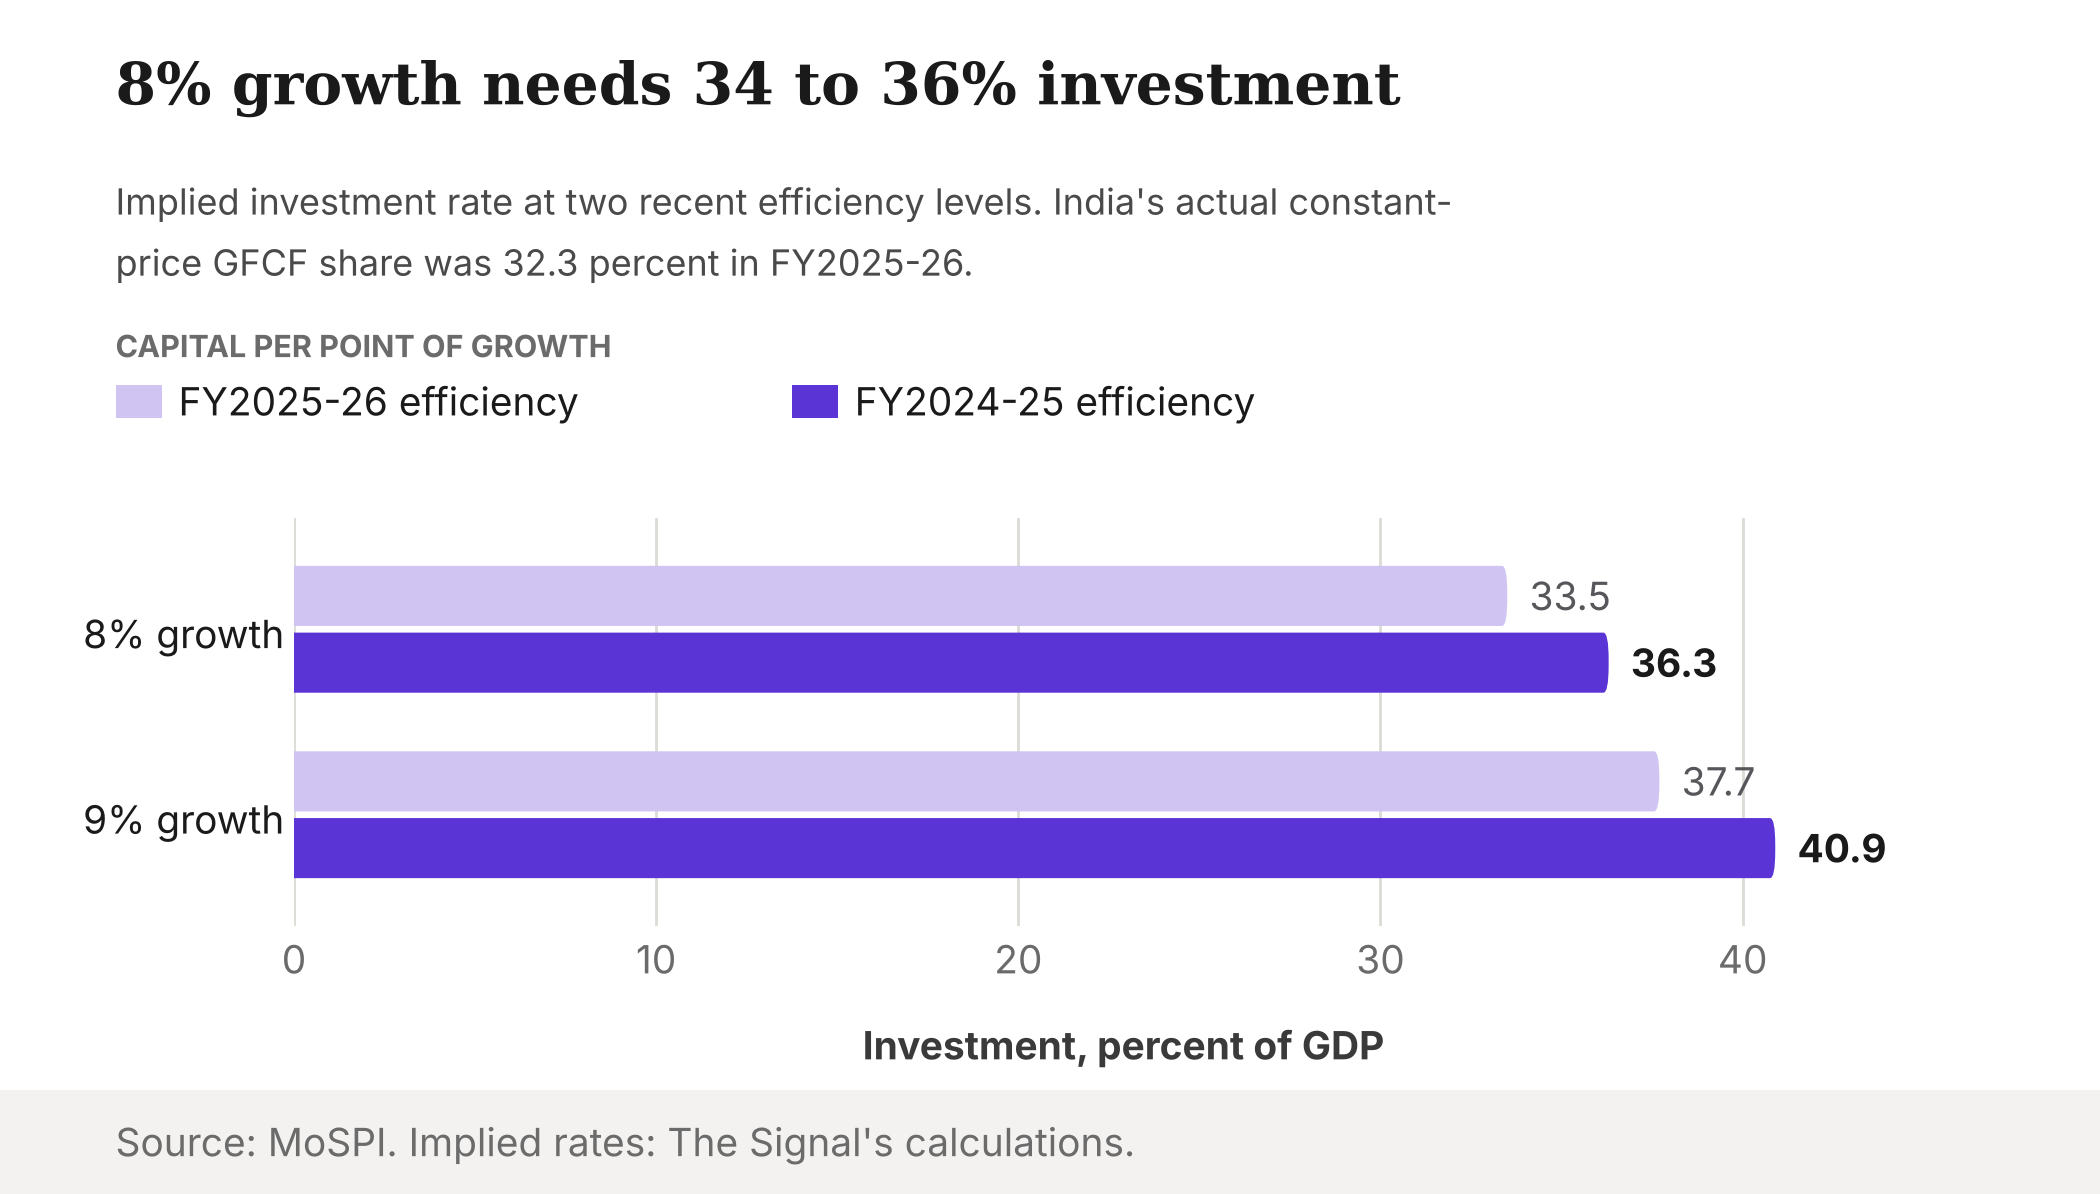
The Survey's 35 percent sits inside that range. The arithmetic and the official target agree, so the target holds up as a calculation even if the growth is unproven.
India against two peers
The comparison with two fast-growing economies is less flattering. The table uses World Bank figures for 2024.
India spends more capital per point of growth than Vietnam or Malaysia.
| Country (2024) | GFCF, % of GDP | Real GDP growth, % | GFCF share per point of growth |
|---|---|---|---|
| India | 31.64 | 7.1 | 4.5 |
| Vietnam | 29.04 | 7.04 | 4.1 |
| Malaysia | 20.54 | 5.11 | 4.0 |
Source: World Bank, India; World Bank, Vietnam and Malaysia. Ratios are The Signal's calculations.
The ratio for each country is its GFCF share divided by real growth in the same year. India comes out highest, by about 0.4 to 0.5 of a point. One year is thin evidence, and the World Bank's India figures are on a different base from MoSPI's new series, so they should not be read against the 4.19 above.
The honest objection
The strongest case against this reading is that GFCF share over growth is a crude proxy. It leaves out changes in stocks, treats a rupee of a road and a rupee of a machine alike, and ignores that infrastructure pays back slowly. If public capex is leading, as the Datanomics column suggests, capital productivity could look flat now and rise later, or look good now on spending that has not yet reached the output side. Three years on a new series is also short.
All of that is fair, and it cuts in both directions. The data cannot prove capital got less productive, and it cannot prove it got more productive either. What it shows is narrower: the investment share was steady and growth rose in the latest full year, so the headline claim does not hold on the official series for these years. The column's text could not be retrieved for this piece, so its own evidence is not judged here.
The Signal
The debate over whether India's capital is getting less productive is the wrong fight. On MoSPI's new series, FY2025-26 was the cheapest of the three years on the new base. The real constraint is the investment rate. At recent efficiency, 8 percent growth needs between 33.5 and 36.3 percent of GDP in fixed investment, and India's constant-price GFCF share was 32.3 percent in FY2025-26.
Watch the next two quarters. If constant-price GFCF stays near the 34.4 percent Q1 level while growth holds at or above 7.8 percent, the investment rate has finally moved and the 8 percent arithmetic begins to work. If investment falls back toward 32 percent, the first quarter was timing. Capital productivity is the one variable India can already see. Investment is the one it still has to raise.
Reporting basis: GDP, GFCF and quarterly figures are from MoSPI's press notes on the provisional estimates for FY2025-26 and the Q1 FY2026-27 estimates, read in the original PDFs. The 8 percent and 35 percent targets are from the Economic Survey 2024-25, and the same 35 percent figure from the Parliamentary Standing Committee on Finance is per PTI, via The Week. Peer figures are from World Bank data. The Datanomics column is cited by its headline only, as the article text could not be retrieved. The capital-per-point ratios, the implied investment rates, the Q1 constant-price shares and the peer ratios are The Signal's calculations from those figures.