
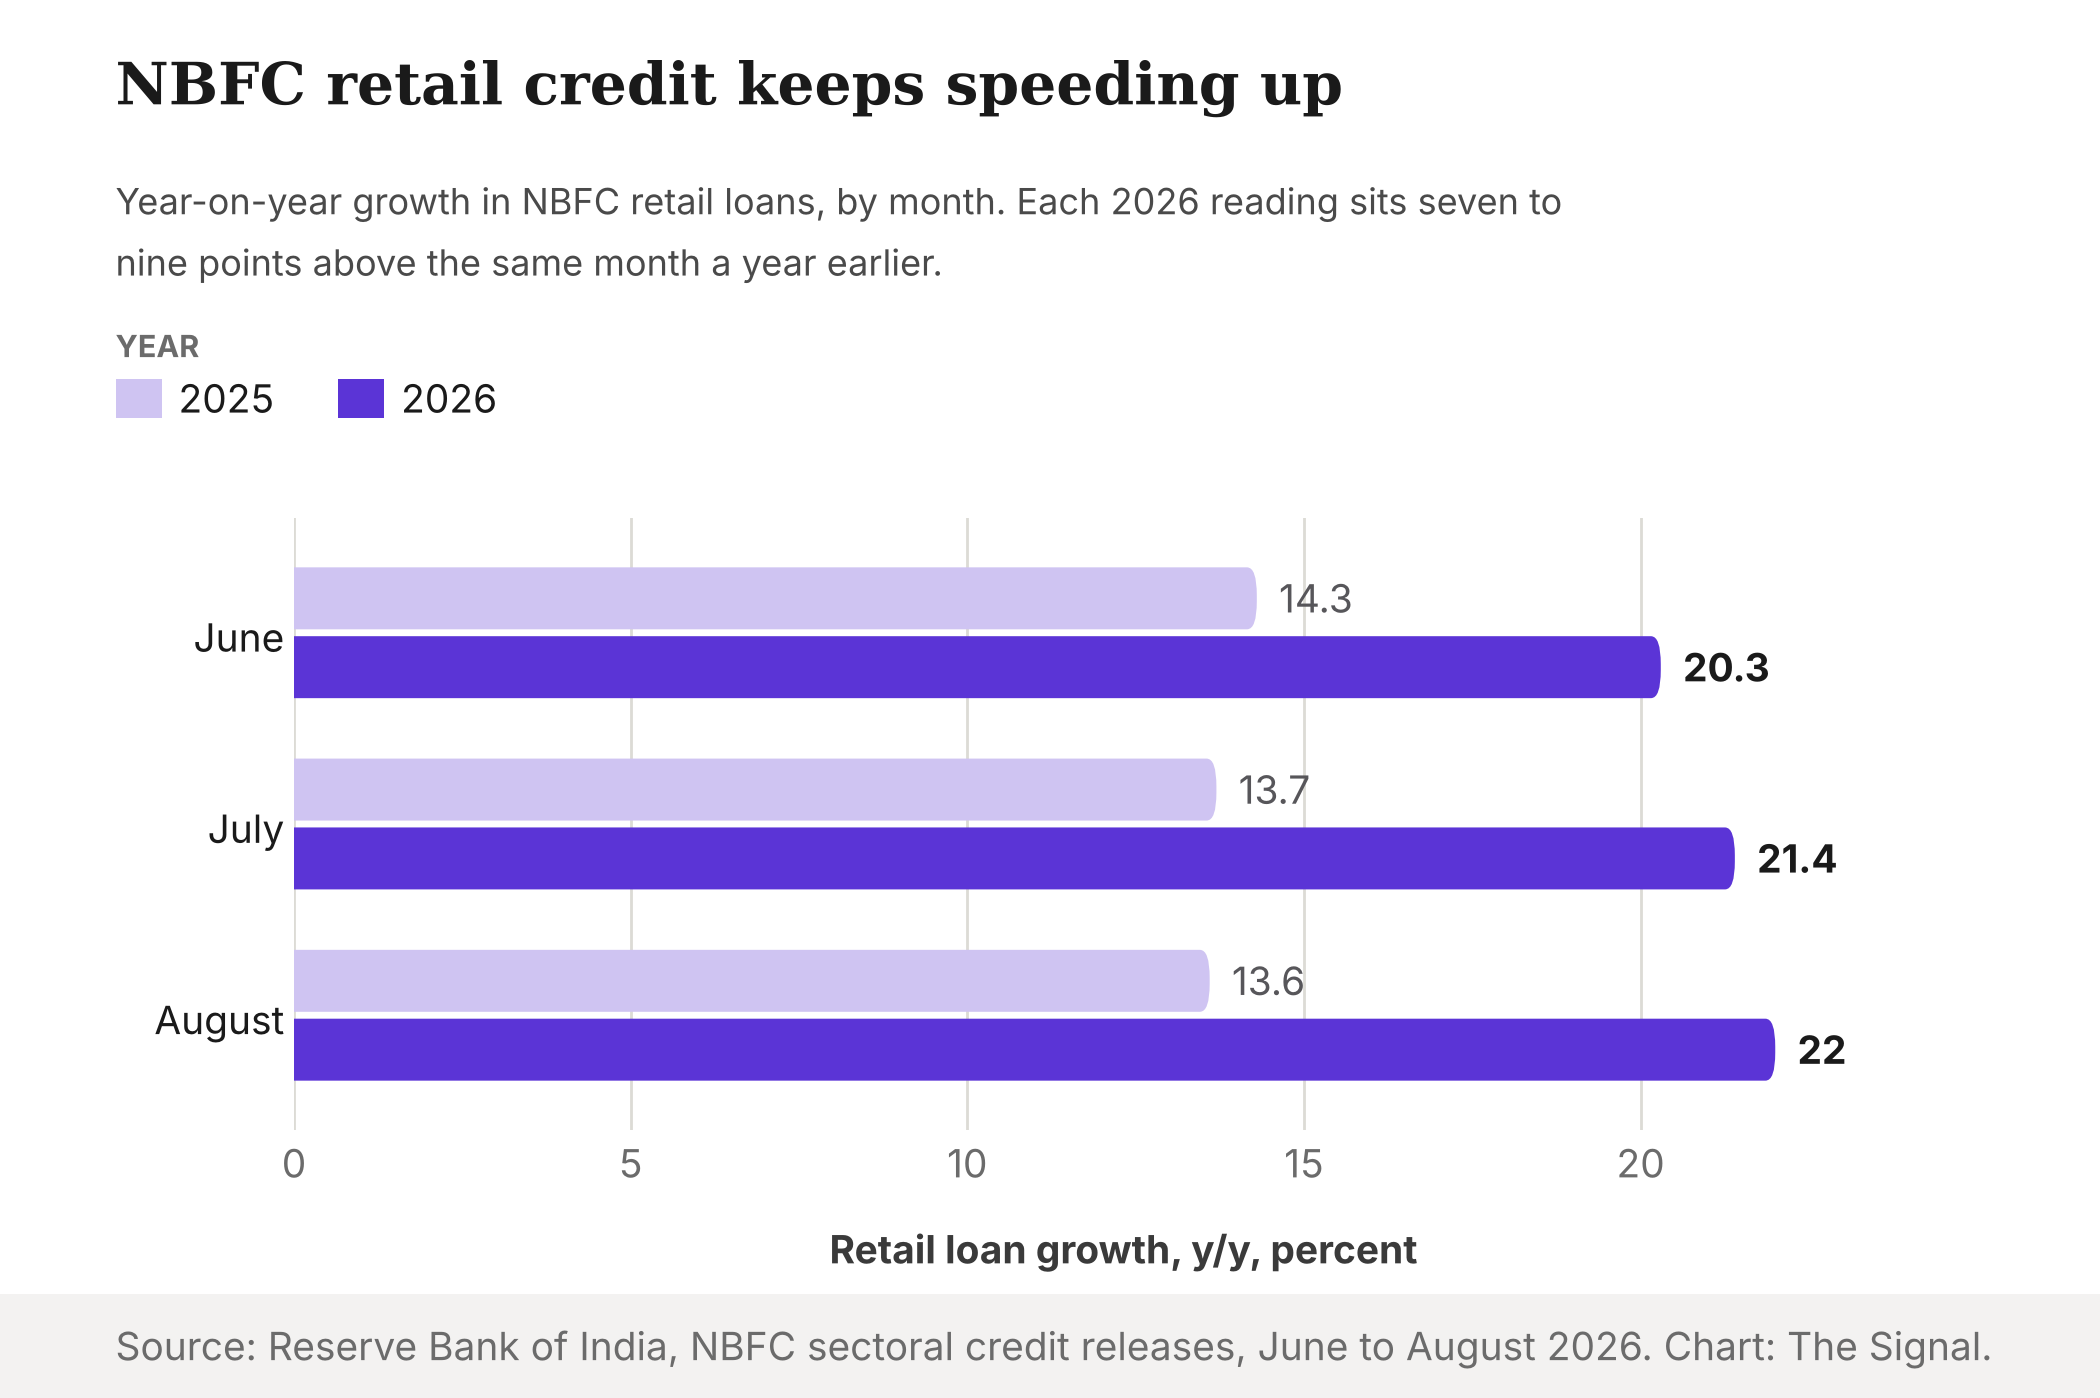
The headline reading of India's non-bank lenders this year is easy to state: they are lending to households faster. The Reserve Bank of India reports that NBFC retail loan growth accelerated to 22.0 percent year on year in August 2026, compared with 13.6 percent a year earlier. The RBI's figures for June and July read 20.3 and 21.4 percent. Three months, three higher readings. A faster-growing credit market looks like a healthy one, and the next question seems to be how long it can run.
It is worth slowing down on that. "Retail" is a basket, and one item in it is growing far faster than the rest. The more useful question is what is holding up the growth, because the answer is a metal, not a borrower's income.
One segment is doing the sprinting
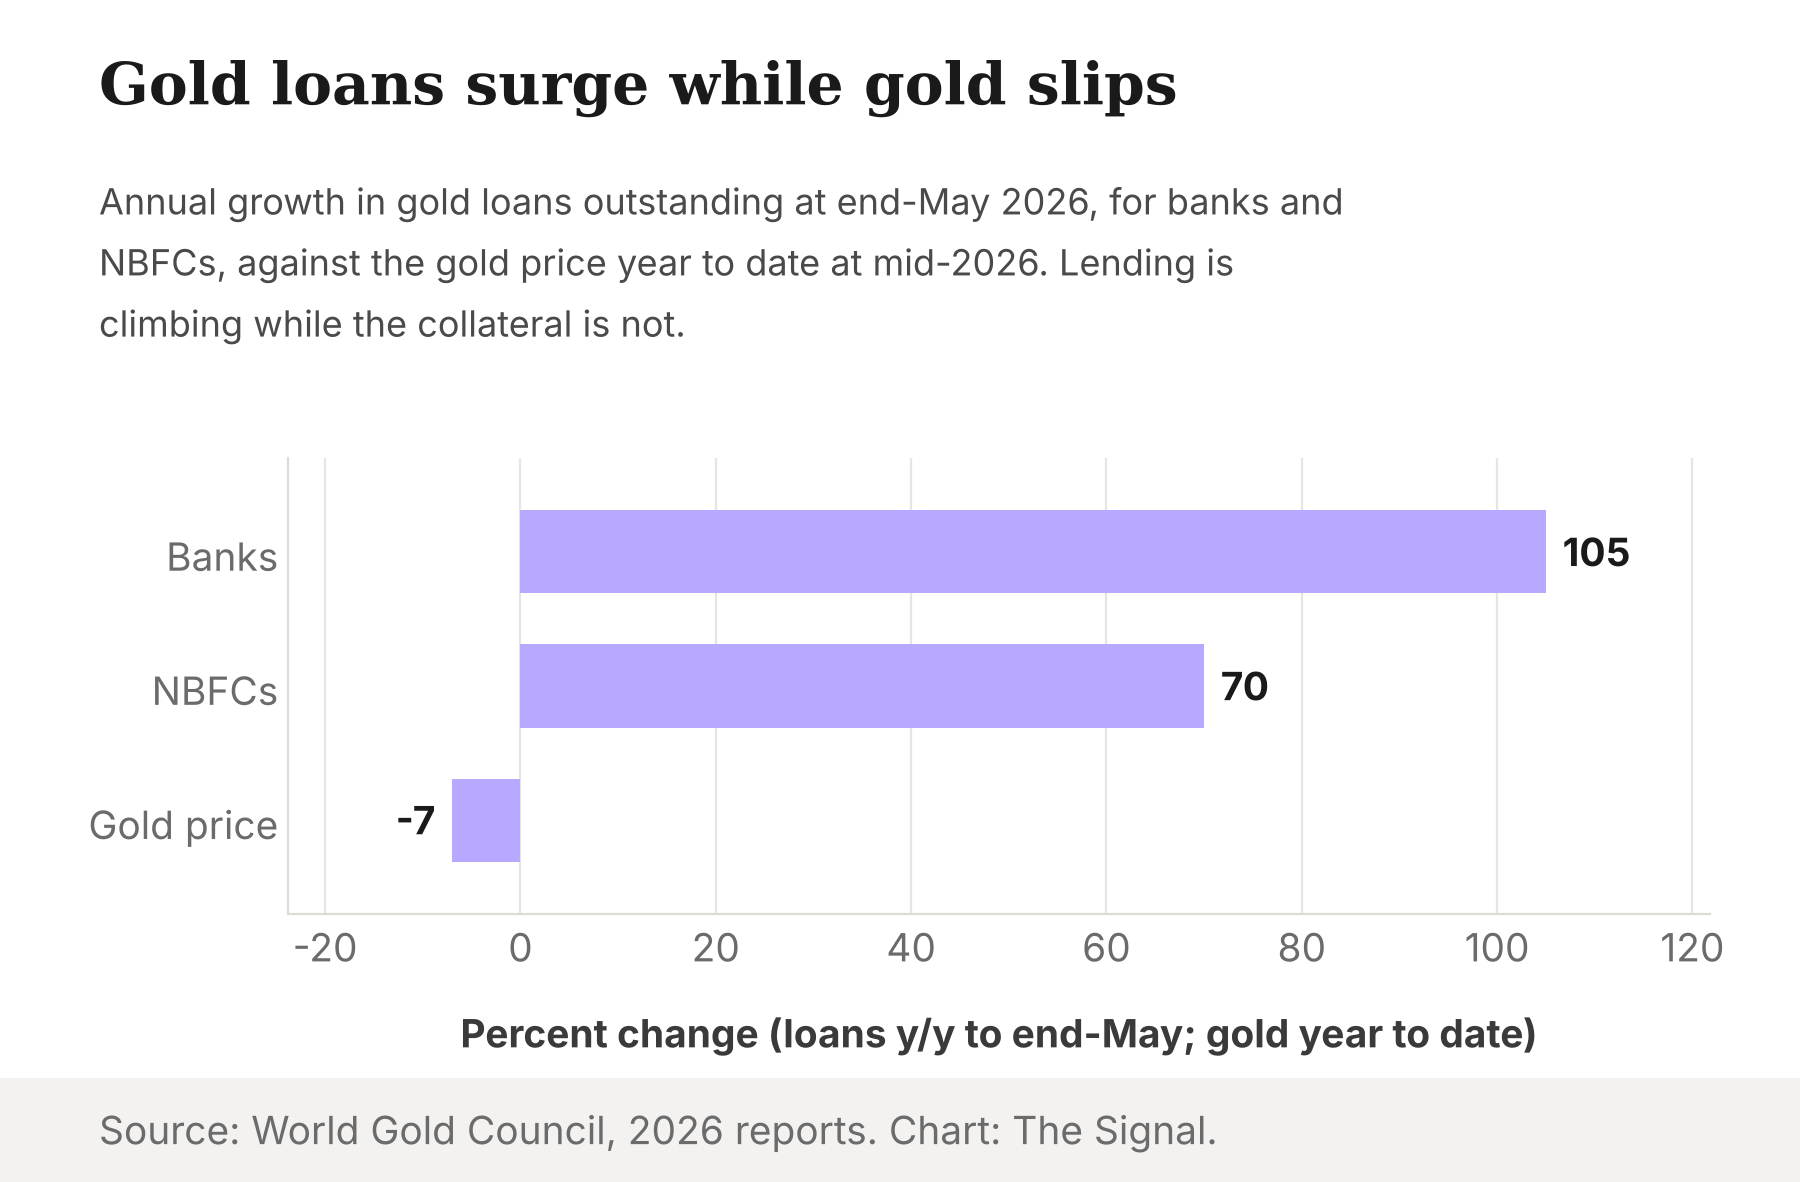
The World Gold Council's Q2 2026 India report states that as of end-May, outstanding gold loans stood at ₹5.1 trillion at banks, up 105 percent year on year, and ₹3.3 trillion at NBFCs, up 70 percent. It adds that gold loans are now the second-largest retail lending segment after housing.
Set that next to the RBI's overall number. NBFC gold loans grew 70 percent in the year to end-May, while NBFC retail loans overall grew 22.0 percent in the year to August. The periods differ by three months, so treat the comparison as a rough one. Even so, 70 against 22.0 means the gold book is growing more than three times as fast as the retail category it sits inside.
A second figure sharpens the picture. Add the two ₹ figures above (₹5.1 trillion at banks and ₹3.3 trillion at NBFCs) and banks and NBFCs together held about ₹8.4 trillion of gold loans at end-May 2026. NBFCs hold ₹3.3 trillion of that, about 39 percent.
The collateral did not follow the loans
Start with the metal. The World Gold Council's Mid-Year Outlook 2026 states that gold was down roughly 7 percent year to date, though it ranks among the top performers over the past year. Gold loans outstanding rose by 70 to 105 percent in a year. The metal behind them fell about 7 percent in the first half of 2026.
The two figures cover different windows, so they do not contradict each other. The same Council text says gold still ranks among the top performers over the past year, and that earlier rise is what a lender sees in the books today. A gold loan is sized as a share of the value of the jewellery pledged. When prices climb, the same grams support a bigger loan, and a borrower who pledged last year can borrow more against the same ornaments this year. Some of the growth in loans outstanding may therefore be the price of gold, restated as credit.
This is the difference between a cash-flow loan and a collateral loan. A lender to a salaried borrower is betting on a monthly income. Against gold, the lender is betting that the pledged metal keeps its value.
What the regulator says it is watching
The RBI has put this in writing. The Reserve Bank of India's June 2026 Financial Stability Report says that loan-to-value ratios across banks and NBFCs have declined despite strong gold-loan growth, supported by rising gold prices. It also says a prolonged correction in gold prices could weaken collateral protection, increase borrower stress, and result in higher delinquencies.
Read the report's two statements together. Loan-to-value ratios have fallen because prices rose. The cushion is a product of the boom, not a feature of the loans. A lender that looks well protected today is protected by the same variable that could reverse.
The rules set a ceiling on how thin the cushion can get. The RBI's Lending Against Gold and Silver Collateral Directions, 2025 provide loan-to-value caps of 85 percent for loans up to ₹2.5 lakh, 80 percent up to ₹5 lakh and 75 percent above that, with bullet consumption loans capped at 12 months, effective by 1 April 2026.
| Loan size | Maximum loan-to-value | Gold price fall that erases the cushion at the cap |
|---|---|---|
| Up to ₹2.5 lakh | 85 percent | 15 percent |
| Up to ₹5 lakh | 80 percent | 20 percent |
| Above ₹5 lakh | 75 percent | 25 percent |
Caps per the RBI's Lending Against Gold and Silver Collateral Directions, 2025. The right-hand column is simple arithmetic: 100 minus the cap.
A loan written at the 85 percent cap is covered until the metal falls by 15 percent. Loans written below a cap have a wider cushion. The point is the shape of the risk. It is a price risk, and the table says how large a move it takes to consume the margin at each cap.
The honest objection
The strongest case against this reading is that the system has been built to absorb a fall. The RBI's caps leave a margin, the Financial Stability Report says loan-to-value ratios have declined, and the 12-month limit on bullet consumption loans keeps exposures short. Gold is also a liquid, easily valued asset, and the roughly 7 percent fall came after a year in which gold ranked among the top performers, so borrowers who pledged a year ago still plausibly hold a cushion.
That case is real, and it deserves weight. It explains why the book is not fragile today. It does not explain why a regulator is publishing a warning about a prolonged correction, and it leaves the dependency in place. A short tenor limits how long a lender is exposed, but it does not change what the exposure is to. One thing would settle the question and is missing here: how many gold loans have actually gone bad. We have no delinquency figure for the segment, so the claim is about how the book is exposed, not that losses are occurring.
A fresher price reading complicates the mid-year "fell" half of that story. The World Gold Council's September 2026 India update states that gold prices rose 13 percent in August on the LBMA Gold Price PM, one of the strongest monthly gains in nearly three decades, and then pulled back in September, by 3.9 percent internationally and 4.6 percent domestically. The mid-year decline therefore does not describe where gold stands now, and the collateral is more volatile than a single year-to-date figure suggests. Price swings of that size are the reason the cushion matters in both directions.
The Signal
India's non-bank lenders grew retail credit 22.0 percent year on year in August 2026, and the fastest part of that book is lending against a commodity that was down roughly 7 percent in 2026 at mid-year. The growth does not tell you that borrowers have become more creditworthy. It tells you that more households are pledging gold, and that each pledged gram supports more rupees than it did a year ago.
Two data points set the clock. The loan figures are as of end-May 2026, the retail growth figure is for August 2026, and the main gold price reading is from mid-2026, so none of them shows where gold stands in October; the Council's September update gives only monthly moves for August and September. Watch the next RBI release of NBFC credit, and watch the next gold-loan figure from the World Gold Council. If retail growth keeps accelerating while gold stays below where it began the year, the lending is outrunning the collateral. A gold loan is only as safe as the price of the gold behind it.
Reporting basis: NBFC retail loan growth for June, July and August 2026 is from the Reserve Bank of India's monthly NBFC credit releases, the August release dated 6 October 2026. Gold loans outstanding at banks and NBFCs, as of end-May 2026, and the segment ranking are per the World Gold Council's Q2 2026 India report, a single source for those figures. The August and September price moves are per the Council's September 2026 India update. The gold price move to mid-2026 is per the Council's Mid-Year Outlook 2026, the same origin. The loan-to-value finding and the correction warning are per the RBI's June 2026 Financial Stability Report, and the caps and tenor limit are per the RBI's Lending Against Gold and Silver Collateral Directions, 2025. The combined bank and NBFC total, the NBFC share, the growth multiple and the cushion column in the table are The Signal's calculations from those figures.