A common line about Indian manufacturing is that it grows without hiring. The Annual Survey of Industries for 2024-25, released by the statistics ministry on 30 September 2026, does not support it for registered factories. The estimated number of persons engaged rose from 1.96 crore in 2023-24 to 2.10 crore in 2024-25, a growth of 7.19 percent, which is about 14 lakh more people. Total emoluments paid to the workforce rose 12.08 percent over the same year.
On the headline figures, this is a good year for workers. It is worth slowing down on what those figures contain.
The wage bill grew mostly because there were more people on it
Gross value added, the value a factory creates after paying for inputs, rose 9.59 percent, from ₹2,458.3 thousand crore to ₹2,694.2 thousand crore. So the wage bill (12.08 percent) grew faster than the value added (9.59 percent), and headcount grew 7.19 percent.
Divide them and the picture changes. Spread across 7.19 percent more people, a 12.08 percent larger wage bill works out to about 4.6 percent more per person. Value added per person rose by only about 2.2 percent. In rupees, the survey's Table 3 puts 2024-25 gross value added at ₹269,419,806 lakh and total persons engaged at 20,996,913, or roughly ₹12.8 lakh of value added per person. A year earlier, on the same table, it was roughly ₹12.6 lakh.
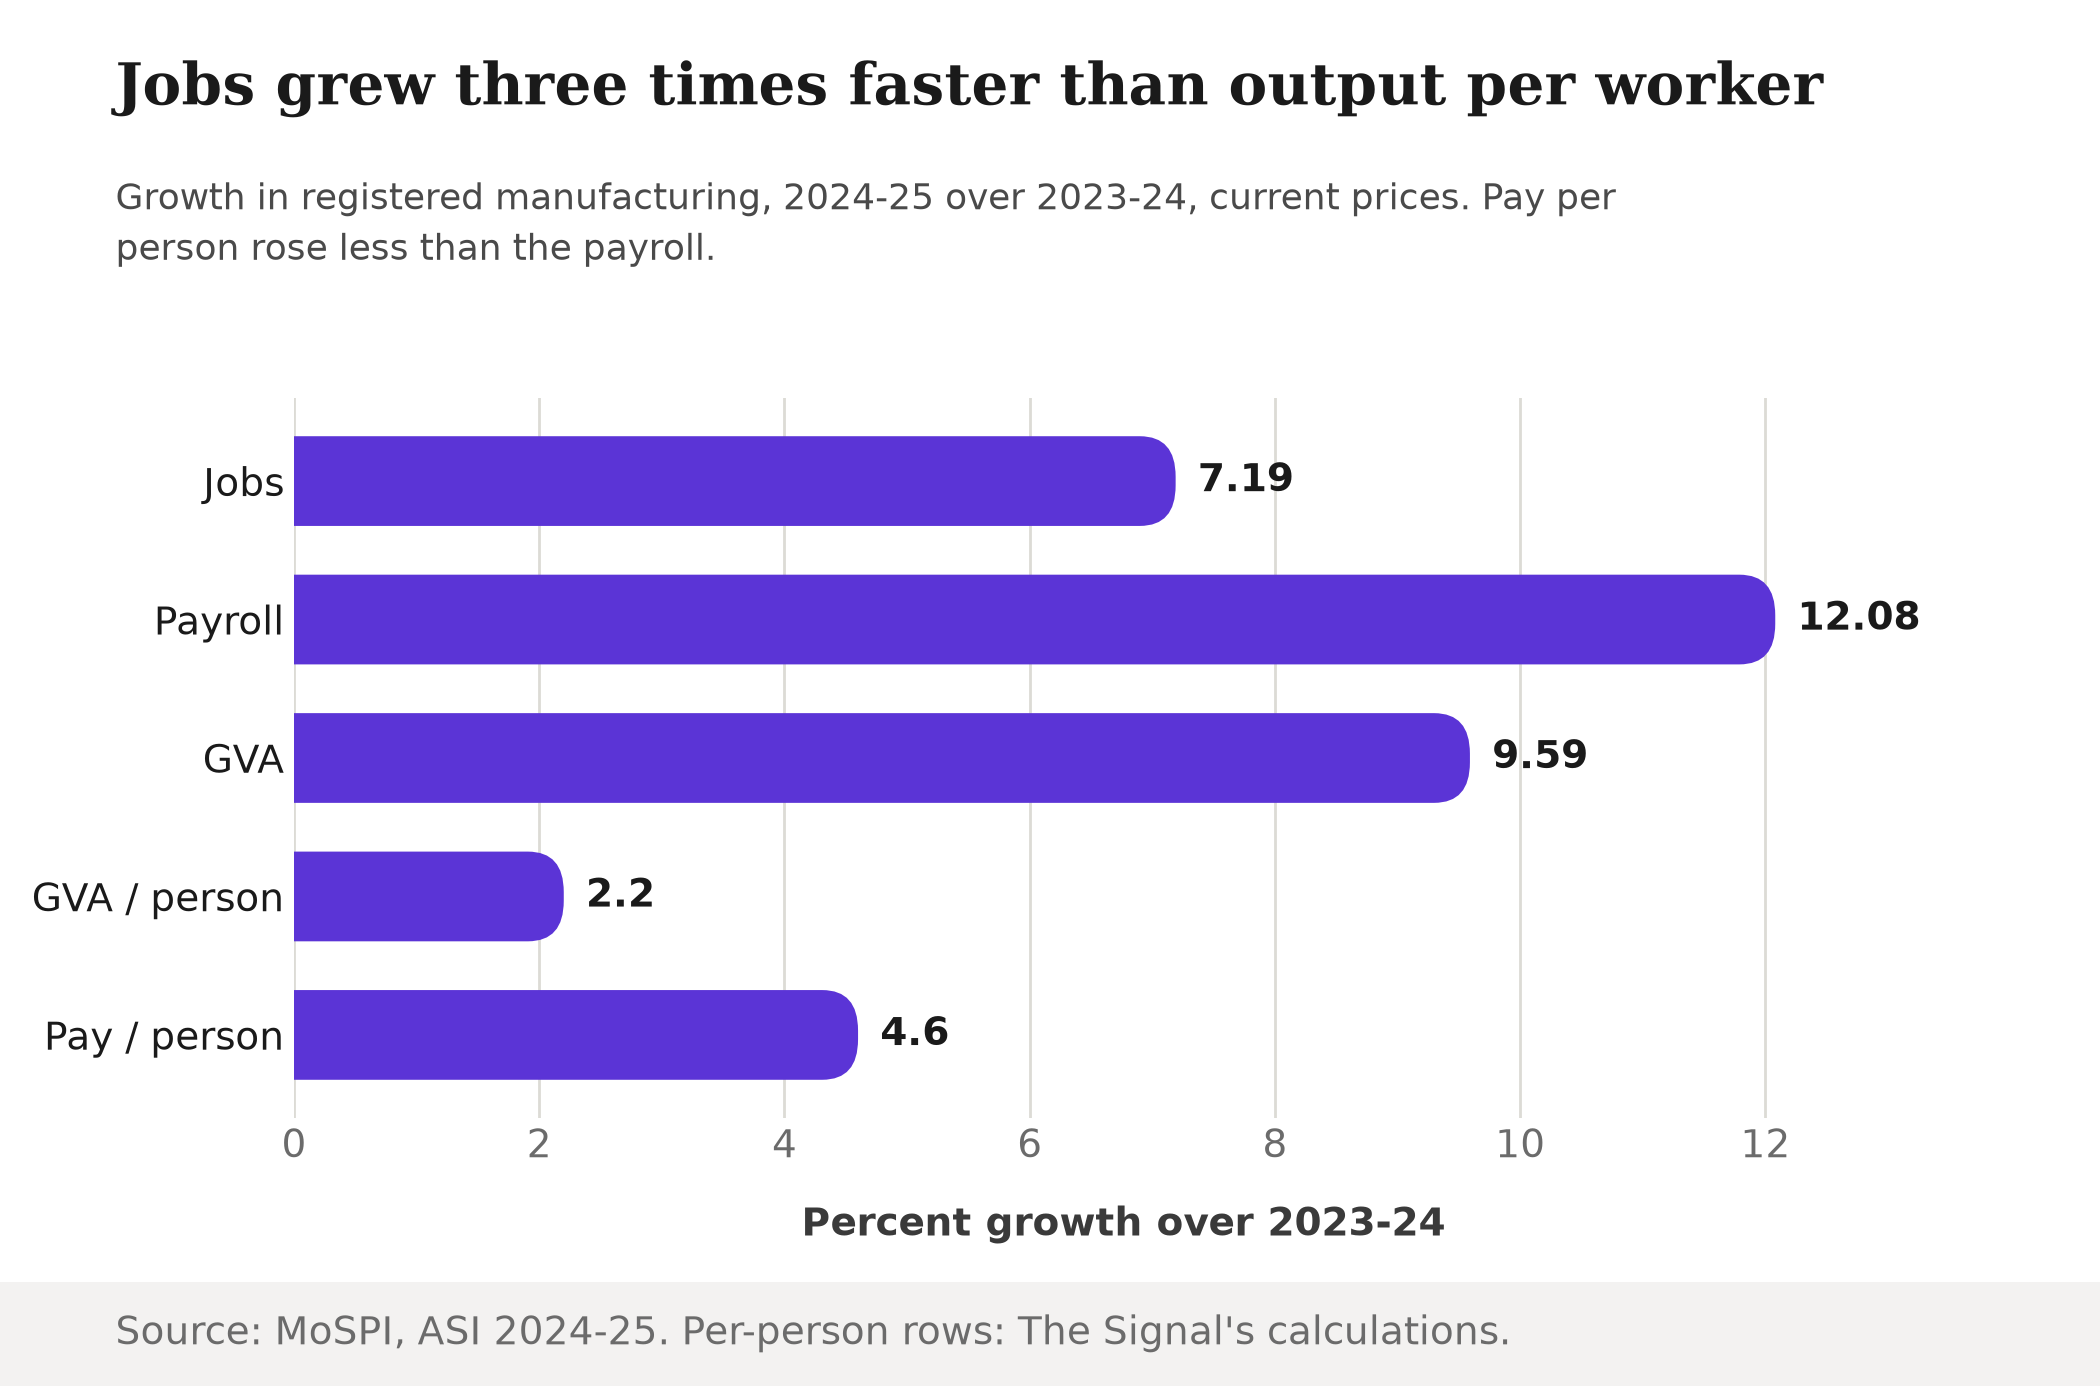
All of these are current-price figures from the survey, so some of the pay growth is simply inflation. The point is the relative order. Jobs grew about three times faster than output per worker. Factories are adding hands faster than they are adding what each pair of hands produces.
Workers did not lose ground to profits
The sharper version of the old worry is that capital takes the gains. The data does not show that either. Net income rose 9.68 percent and net profit 7.73 percent, both slower than the 12.08 percent growth in emoluments.
The shares tell the same story over five years. Using Table 3, emoluments were about 29.8 percent of gross value added in 2024-25, up from about 29.1 percent in 2023-24. Net profit was about 42.9 percent of value added, down from about 43.6 percent. Table 3 shows 2024-25 emoluments of ₹80,302,971 lakh against ₹71,646,903 lakh a year earlier, and the same table carries the profit and value-added series used here.
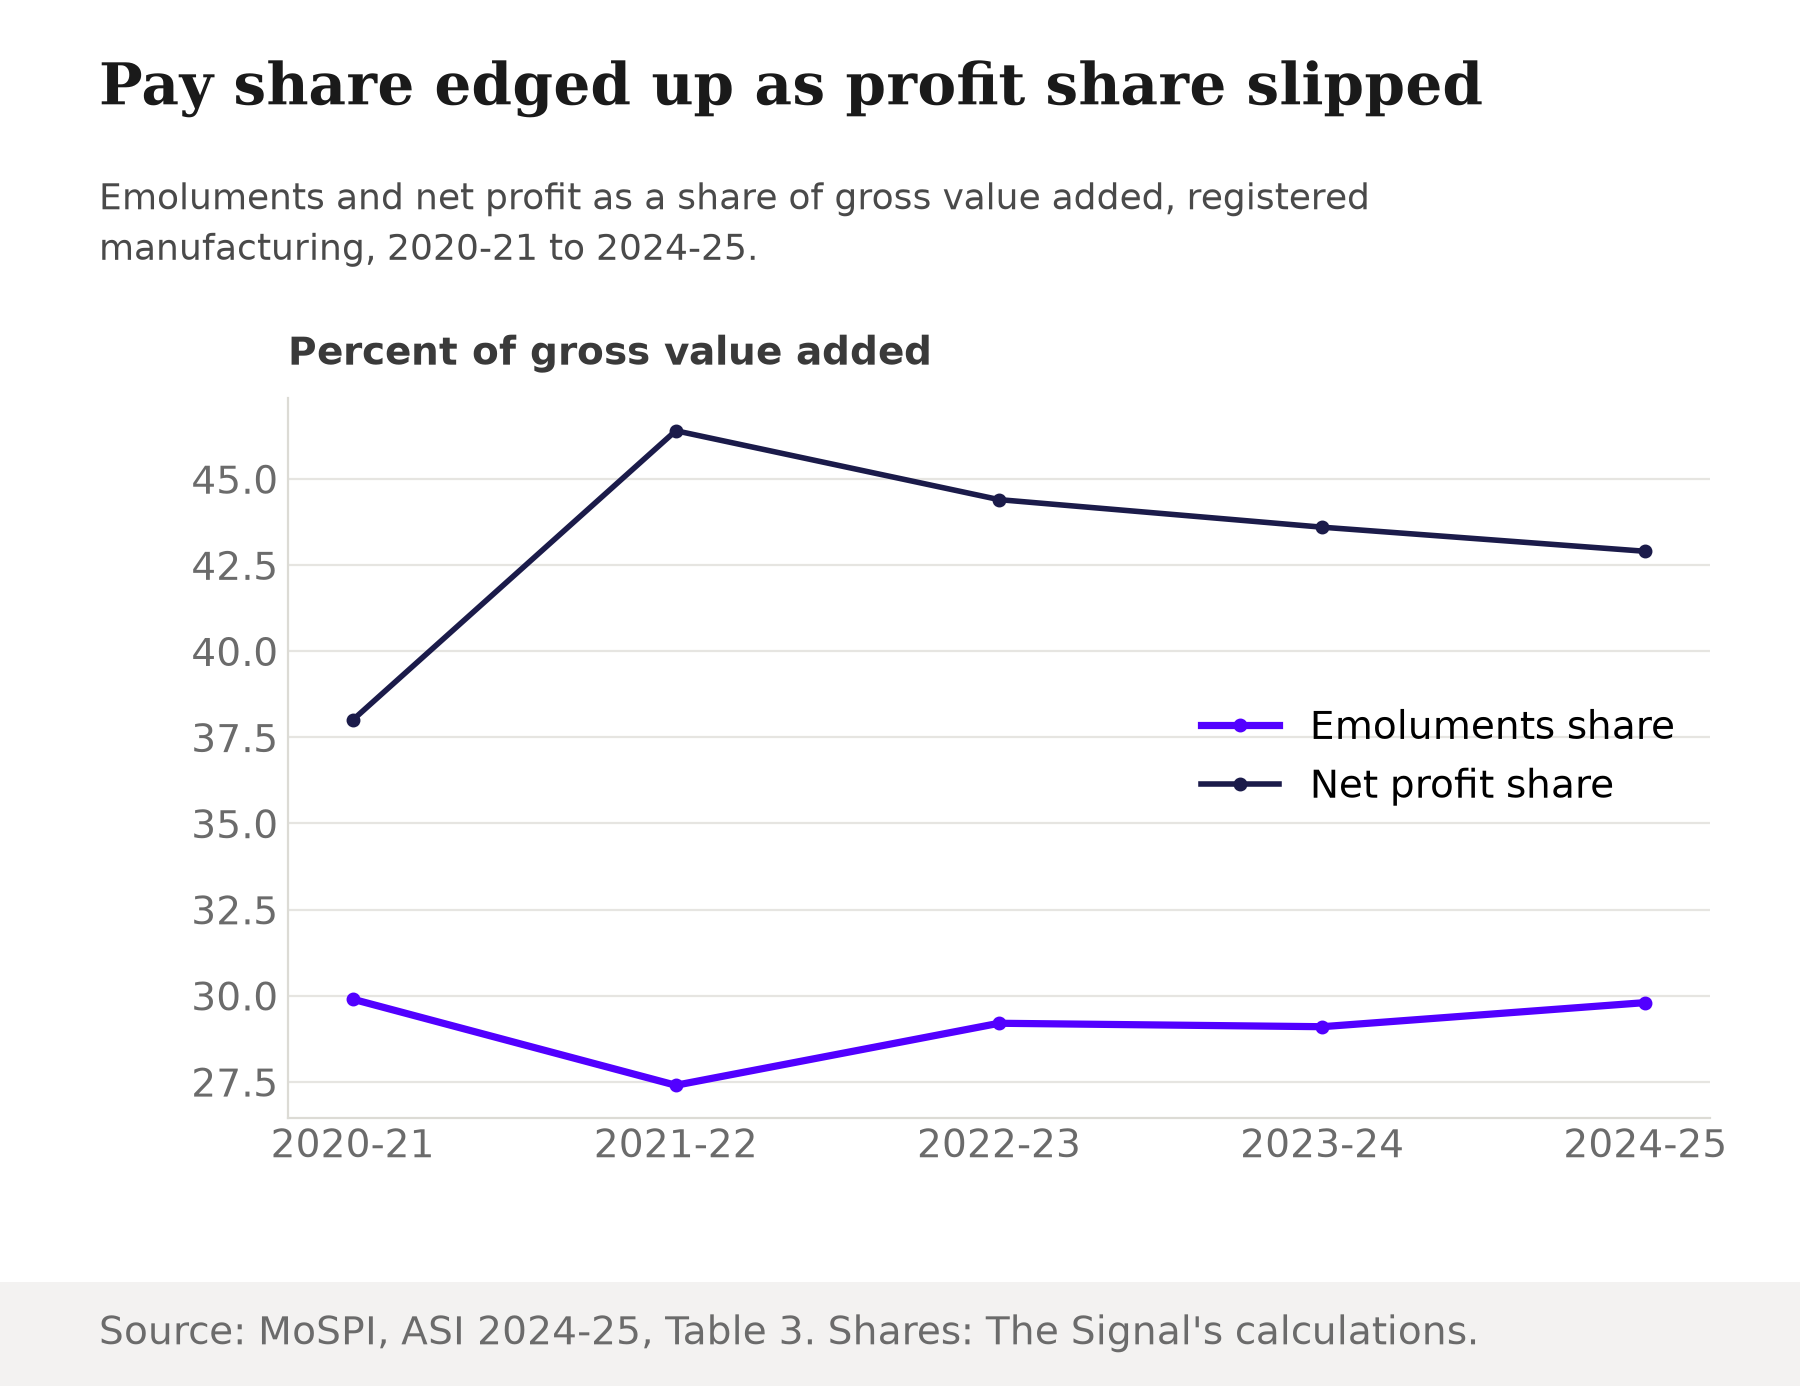
The profit share peaked at about 46.4 percent in 2021-22 and, on the same Table 3 series, has slid three years in a row. The worker share has barely moved. In plain terms, the squeeze since the post-pandemic peak has landed on profit margins, not on pay.
A longer view: more people, only somewhat more value each
Table 3 gives a way to check whether 2024-25 is a blip. In 2020-21, it reports 16,089,700 persons engaged against 20,996,913 in 2024-25, an increase of about 30 percent. Value added per person over that stretch rose from roughly ₹10.0 lakh to roughly ₹12.8 lakh, about 28 percent in current prices. Pay per person rose by a similar margin, from about ₹3.0 lakh to about ₹3.8 lakh.
Wages to workers alone went from ₹22,261,548 lakh in 2020-21 to ₹37,976,781 lakh in 2024-25, while the count of workers (as distinct from all persons engaged) went from 12,594,563 to 16,653,810. That is roughly ₹1.77 lakh per worker rising to roughly ₹2.28 lakh, about 29 percent in nominal terms over four years.
The mix was different a year earlier. In 2023-24, MoSPI reported employment growth of 5.92 percent, a slower pace than 2024-25's 7.19 percent. Hiring sped up in 2024-25 while the growth in value added, 9.59 percent, came in below the 11.89 percent of the year before.
The honest objection
The strongest answer to all this is that rising headcount with slow productivity growth is not a failure. India needs jobs for a young workforce, and a factory sector that absorbs 14 lakh people in a year is doing what the economy asks of it. Productivity per head also depends on what is being made: apparel, food and textiles employ many people at low value added each, and a sector heavy in them will show low output per head.
That is fair, and it may explain why the level is low. It does not explain why growth was faster a year earlier: Table 3 implies value added per person rose about 5.6 percent in 2023-24, against about 2.2 percent in 2024-25. One year of weak growth is not a trend, and a survey that counts persons engaged cannot tell us whether the new hires are in labour-intensive industries or in the same plants as before.
The Signal
Registered manufacturing is not creating jobs too slowly. In 2024-25 it created them quickly, saw profit's share of value added slip while pay's share edged up, and got little extra output per head in return. That is a healthier labour story than the "jobless growth" line and a weaker productivity story than the headline growth rates suggest.
Watch the next survey for one number: value added per person, derived from Table 3. If it stays low while headcount keeps climbing, the sector is buying growth with people. If it recovers, the 2024-25 hiring surge was investment. A factory's job count says how many it employs. Its output per worker says how long it can keep paying them.
Reporting basis: every 2024-25 figure, including persons engaged, emoluments, gross value added, net income, net profit and the Table 3 series from 2020-21, is from the National Statistics Office's press note on the Annual Survey of Industries 2024-25, published by MoSPI on 30 September 2026 (MoSPI press note), and rests on that single origin. The 2023-24 comparison is from MoSPI's results as released through the Press Information Bureau. Figures are in current prices and cover registered manufacturing only. Per-person values, the shares of value added, and the five-year changes are The Signal's calculations from those figures.