RBI released the Supervisory Data Quality Index for scheduled commercial banks for the June 2026 quarter on September 22, 2026, and on the numbers, banks are having their best run in years. The index measures the quality of banks' supervisory-return data on four parameters, accuracy, timeliness, completeness and consistency, to gauge how well a bank adheres to RBI's 2026 Supervisory Returns Directions. The overall score rose to 93.3 in June 2026 from 90.7 in March 2026, and the number of banks scoring above 90, RBI's top data-quality band, jumped to 75 in June 2026 from 54 the previous quarter. Read as a headline, this looks like an industry finally getting its books in order.
Twenty-one more banks cleared RBI's top data-quality band in a single quarter.
It is worth slowing down on what that index actually measures. By RBI's own account, the sDQI exists to assess whether a bank is adhering to the reporting principles in the Reserve Bank of India (Commercial Banks - Supervisory Returns) Directions, 2026: it grades the paperwork a bank sends the regulator, not the bank's own grip on its risk. And a bank found in violation of those Directions can face RBI action, including a penalty under the Banking Regulation Act, 1949. A score here is not just a report card. It is an input into how much supervisory attention a bank draws next, with a penalty attached if the numbers slip too far.
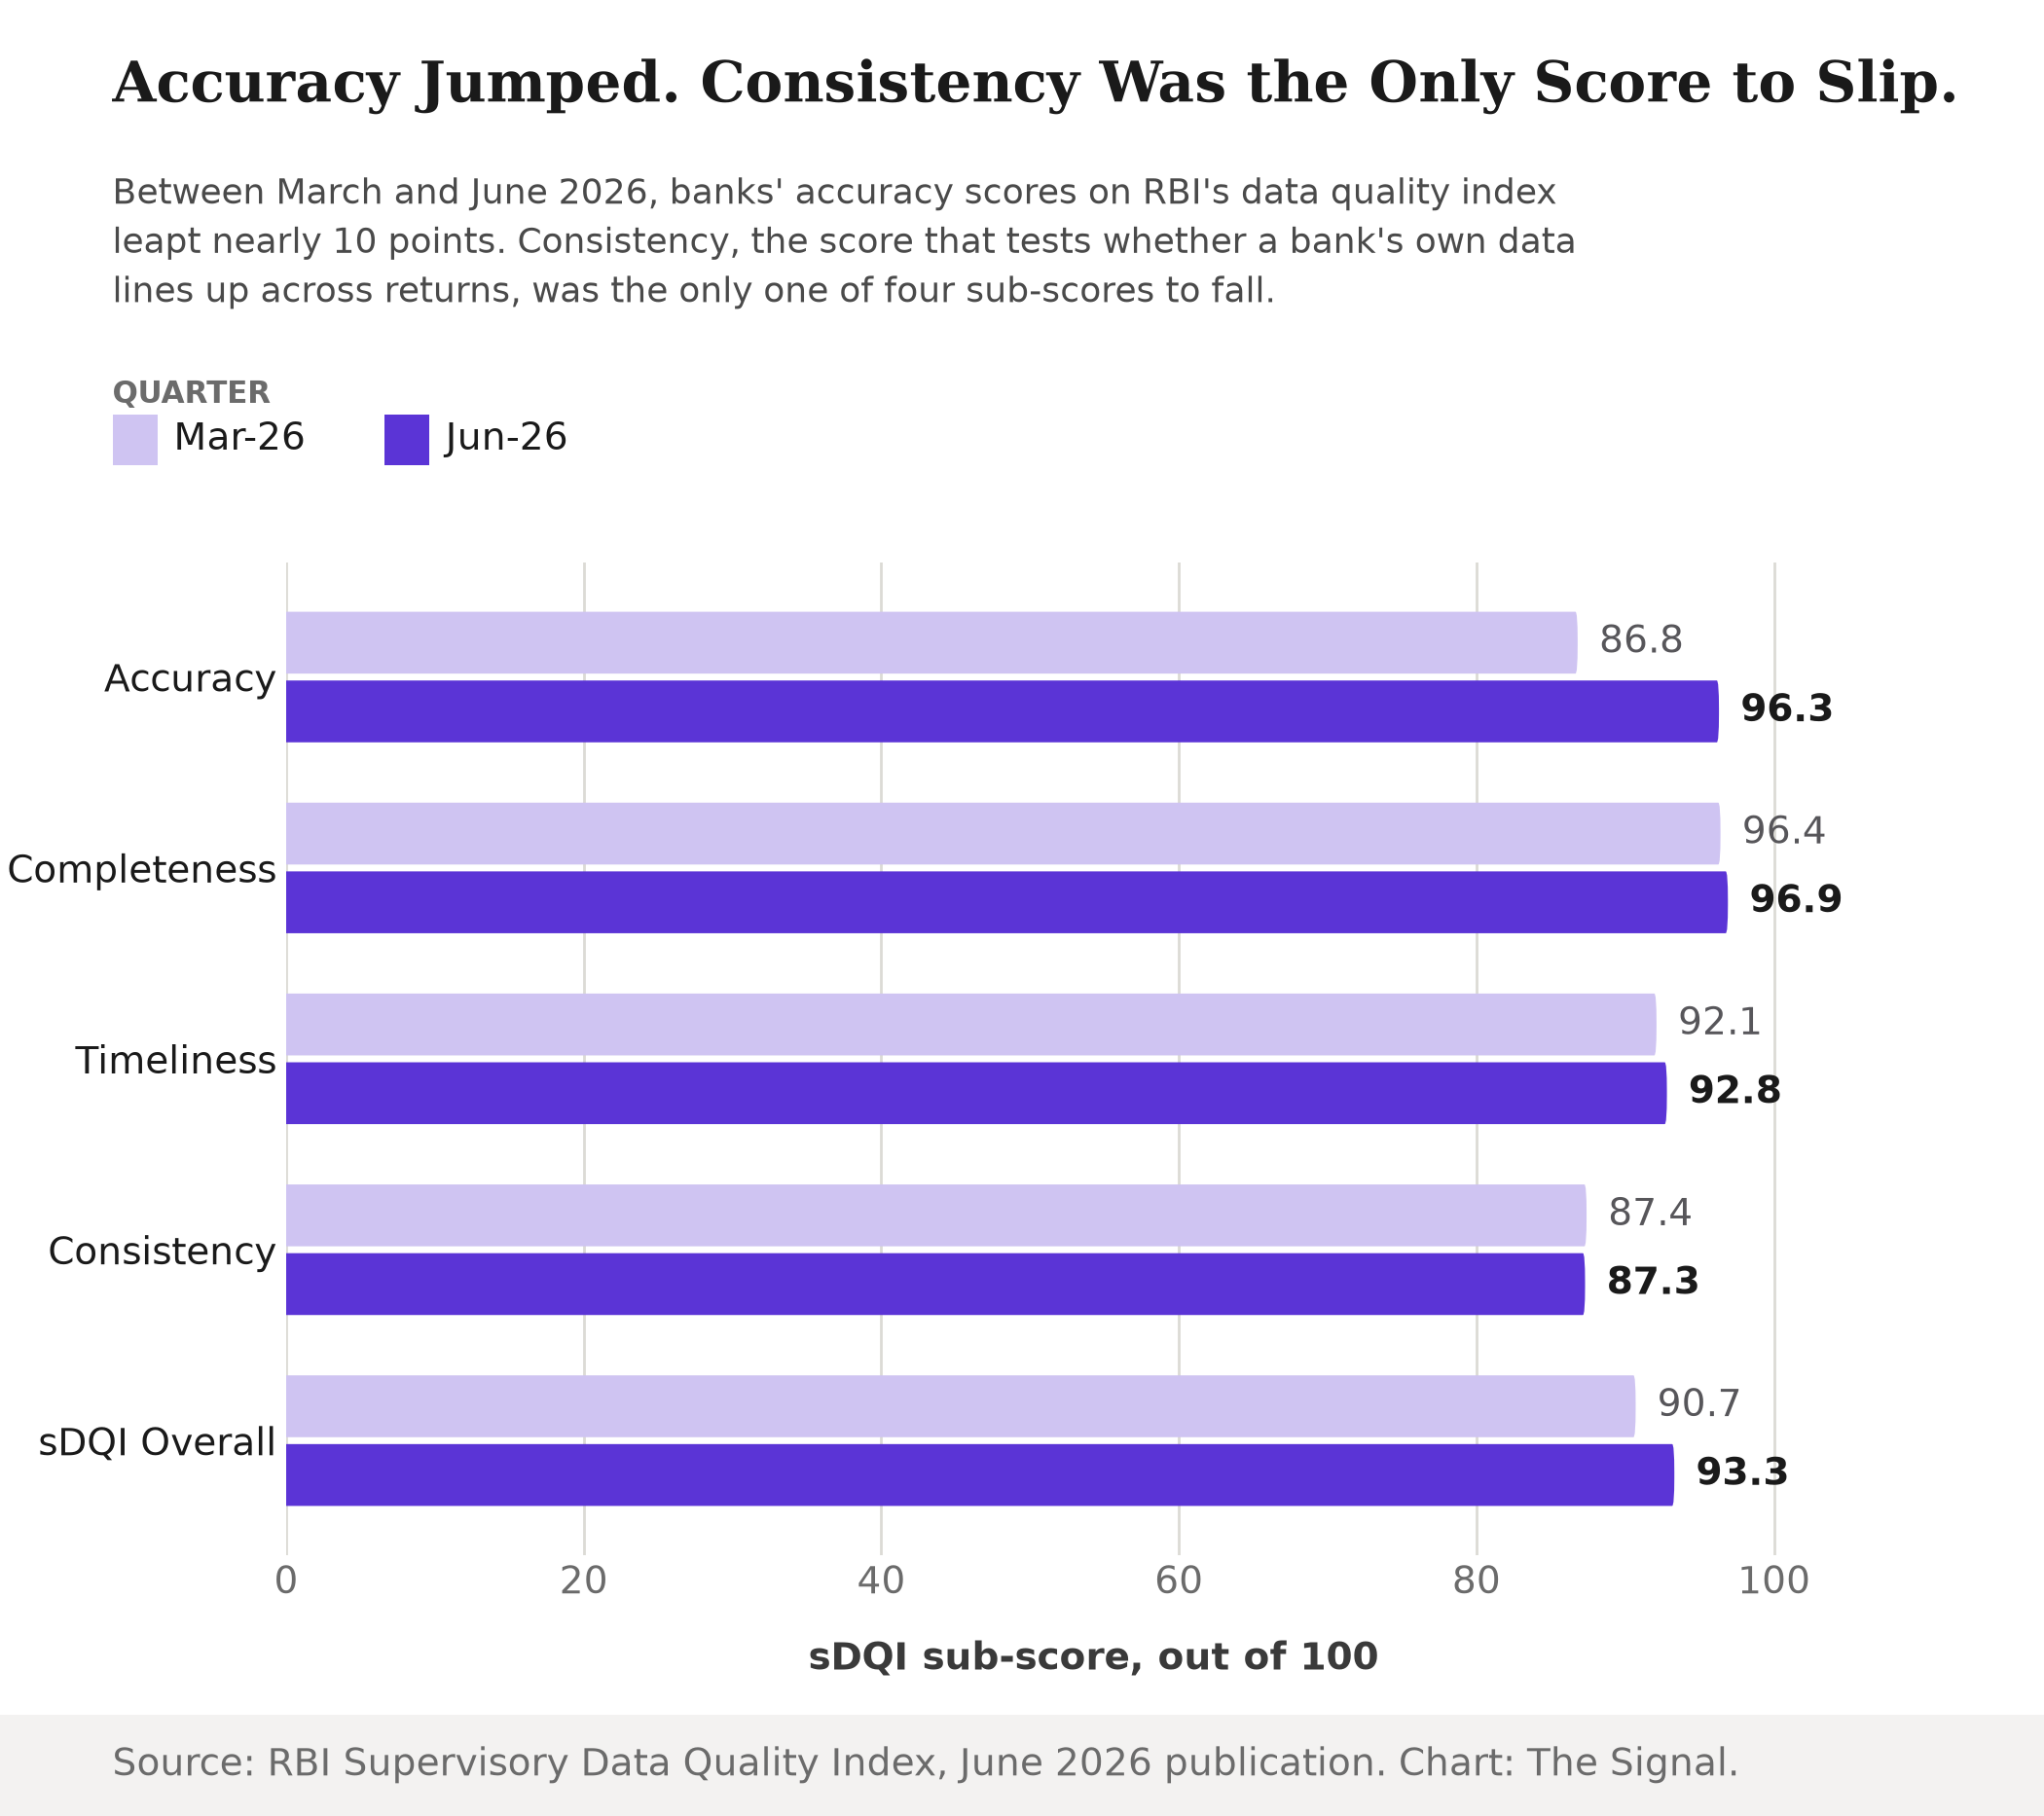
The figure that carries that thesis is 96.3. Between March and June 2026, banks' accuracy sub-score leapt to 96.3 from 86.8, the single biggest move behind the index's rise, while consistency, the sub-score testing whether a bank's own data lines up across its returns, was the only one of the four to fall, easing to 87.3 from 87.4. Banks got sharply better at submitting numbers RBI can verify as accurate. They got marginally worse, not better, at the one dimension closest to genuine internal data integrity.
Why the score is worth chasing
RBI has been explicit that it wants supervision to run increasingly on the data banks feed it. Deputy Governor Swaminathan J said in January 2026 that supervisory technology helps regulators identify patterns early, detect anomalies, and focus attention where it matters most, while stressing that data quality and data governance remain critically important, describing a shift toward technology-neutral, risk-based supervision. Put the two facts together and the incentive is plain: a bank whose returns are clean gives RBI's own systems less to flag, and a bank whose returns are messy gives them more. The sDQI covers 87 scheduled commercial banks across their key supervisory returns, including the Risk Based Supervision Return, so the incentive to stay clean touches nearly the whole system at once, every quarter.
The stampede to 90
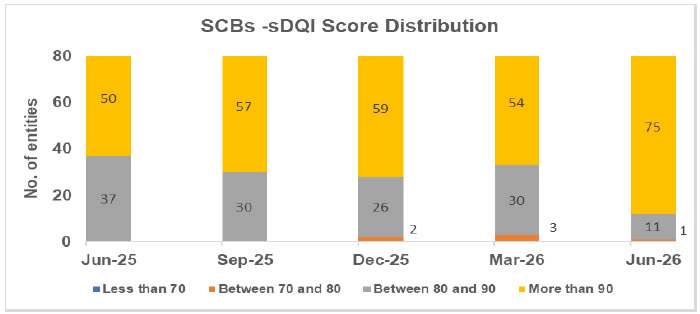
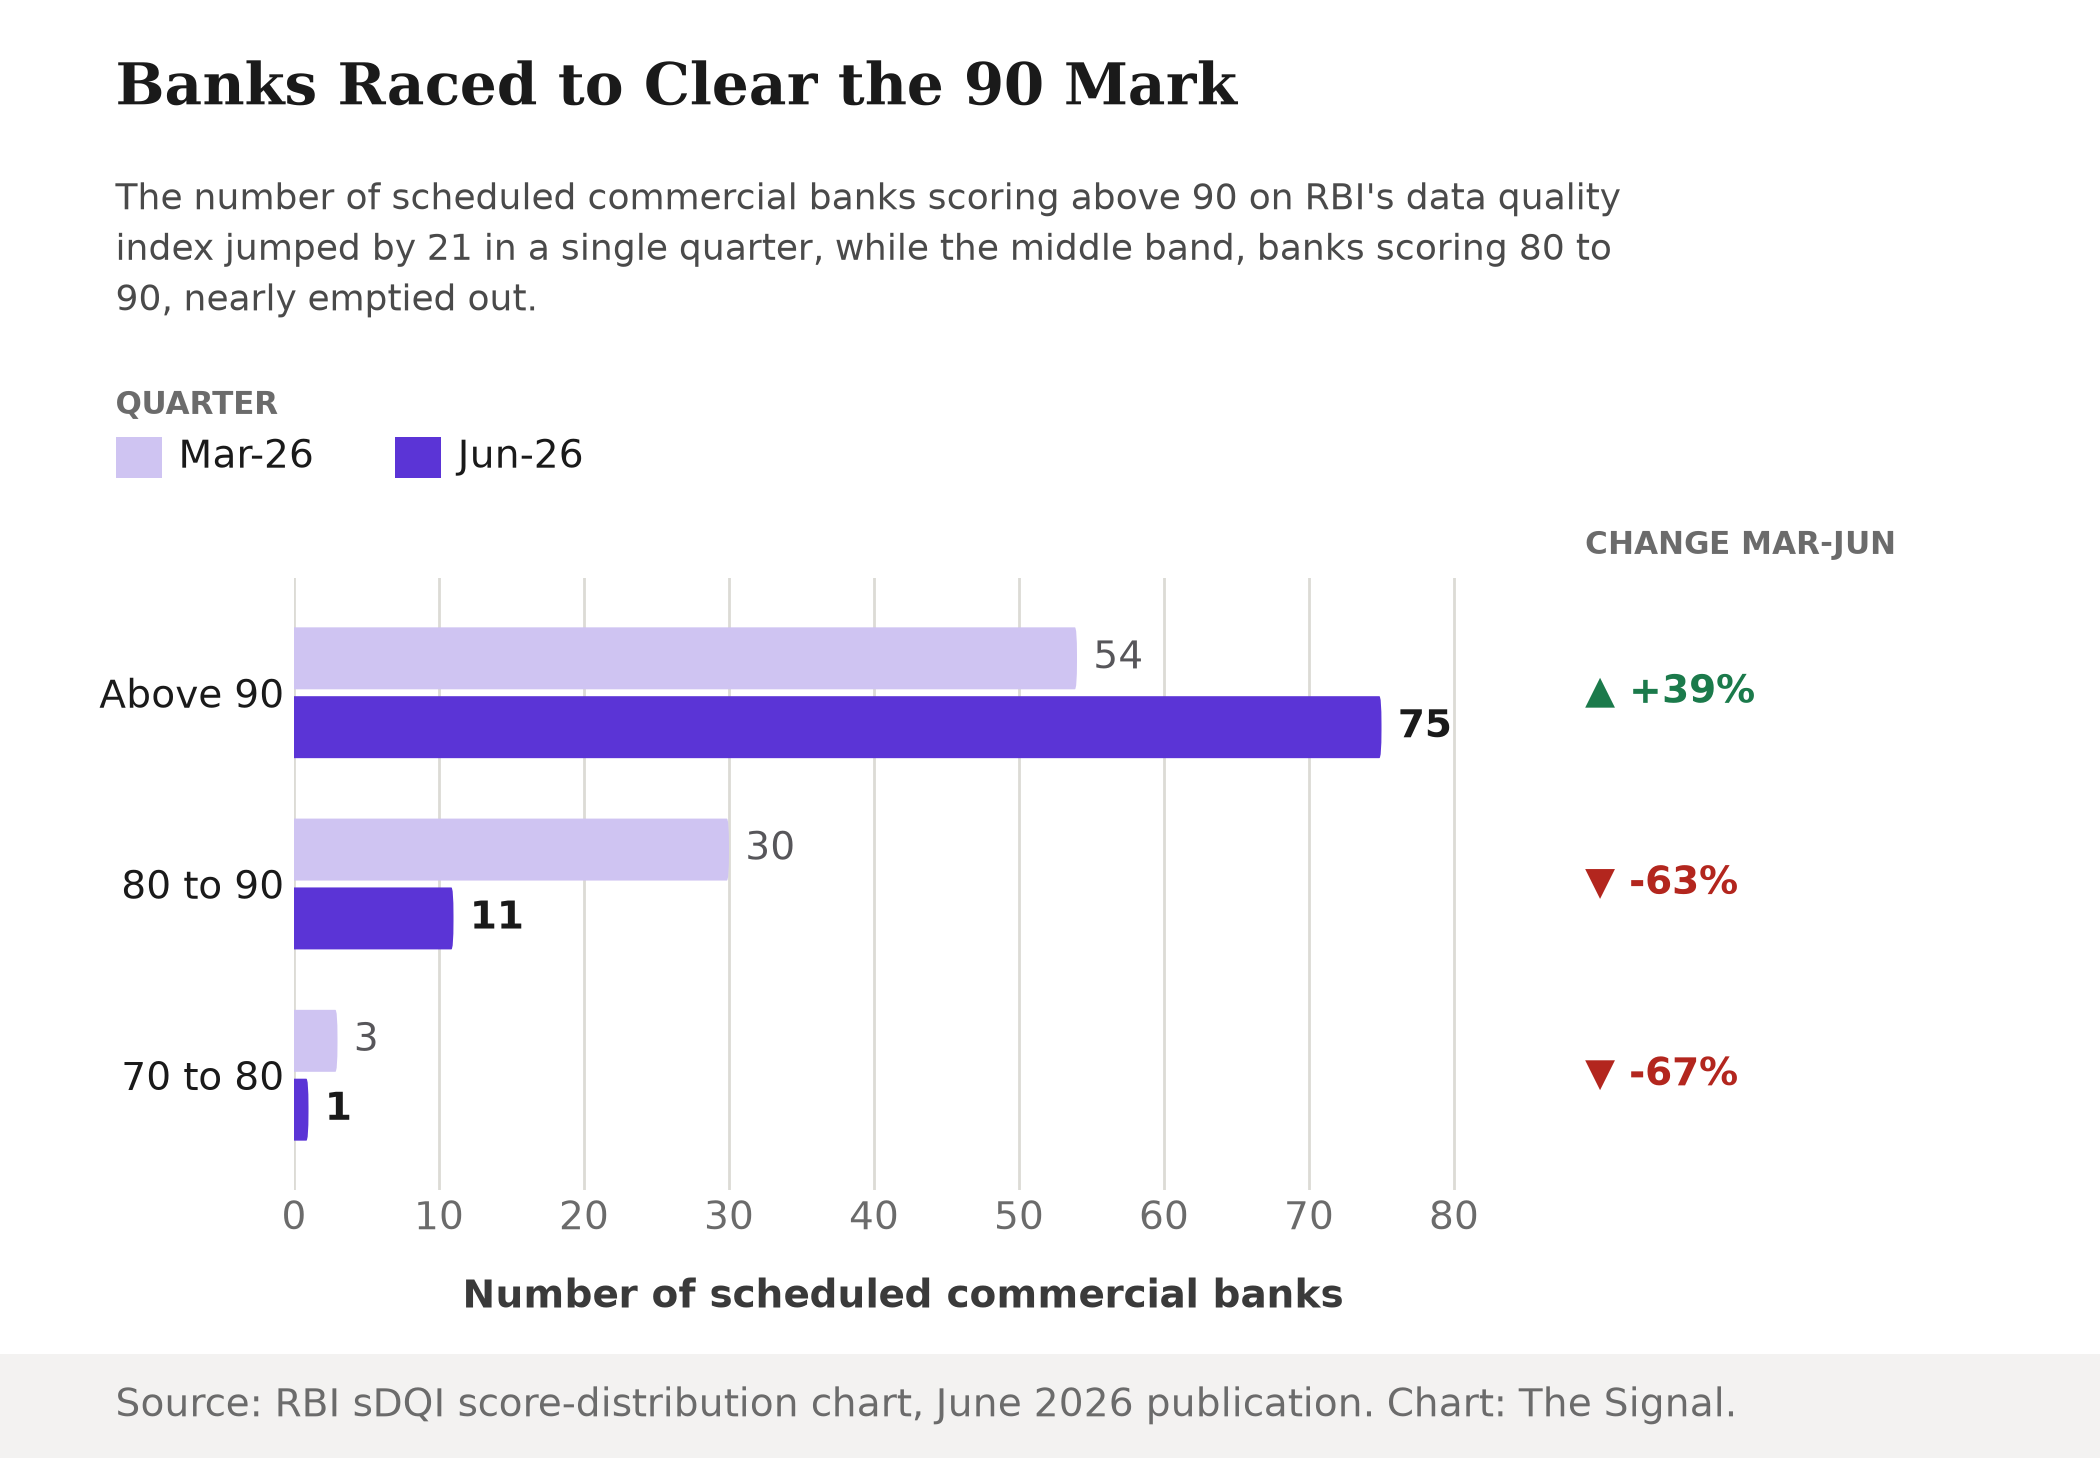
That incentive shows up most clearly in how banks are distributed across the scale, not just in the average. The middle tier, banks scoring between 80 and 90, shrank from 30 banks in March 2026 to just 11 in June, while the top tier, above 90, grew from 54 to 75. That is not a system drifting upward together. It is banks clustering just above a specific line, the line RBI has made the least scrutinised place to sit.
The score's climb from 88.6 to 90.7 took two years. Its next 2.6 points took one quarter.
| Quarter | sDQI score | Change from prior print |
|---|---|---|
| March 2024 | 88.6 | - |
| March 2025 | 89.3 | +0.7 |
| June 2025 | 89.9 | +0.6 |
| September 2025 | 90.7 | +0.8 |
| December 2025 | 90.9 | +0.2 |
| March 2026 | 90.7 | -0.2 |
| June 2026 | 93.3 | +2.6 |
Source: RBI's Supervisory Data Quality Index press releases and publications, March 2025, September 2025, March 2026 and June 2026. Table: The Signal.
Nine quarters of RBI's published scores show the index typically moving by only a few tenths of a point a quarter, and even easing once, to 90.7 in March 2026 from 90.9 the quarter before. By our calculation, the rise from 88.6 in March 2024 to 90.7 in March 2026 added up to 2.1 points over six straight quarters. June 2026 alone added 2.6, more than that entire two-year climb, in a single print.
The honest objection
The strongest case against reading this as scrutiny-avoidance is that RBI itself treats bad data as a real risk, not just a paperwork problem. In its July 2026 draft Guidance on Regulatory Expectations for Data Governance, RBI warned that weaknesses in data governance can create broader financial, operational, compliance and reputational risk for banks. On that reading, banks racing to fix their numbers are racing to fix a genuine vulnerability, and the sDQI just happens to be the yardstick.
That case is real, but it does not fit the shape of the improvement. If banks were rebuilding their data discipline end to end, consistency, the score that checks whether the same numbers agree across different returns, should have moved with the rest. Instead it was the one sub-score that slipped even as accuracy jumped nearly ten points and the overall index posted its sharpest gain in at least nine quarters. And the weak tail has not disappeared: three banks were still scoring below 80 as recently as March 2026, a state no bank was in as of September 2025, even as the system-wide average kept climbing. A genuine fix to data governance should lift the sub-score that tests coherence and should narrow the tail, not just average over it. What the data shows instead is a system getting very good, very fast, at the specific metric RBI grades.
The Signal
The sDQI is doing exactly what a supervisory index is meant to do: changing behavior. The honest question is which behavior it is changing. RBI's own account of why the index exists, to grade adherence to its Supervisory Returns Directions, with a penalty attached for banks that fall short, makes it a compliance instrument first. The banks jumping fastest are the ones with the reporting infrastructure to move an accuracy score ten points in a single quarter, and that kind of infrastructure costs money. The banks still stuck below 80 as of March 2026 are not becoming less exposed as supervision tightens around a Directions regime with real penalties. They are becoming more exposed, with worse numbers to show for it. Watch the consistency sub-score and the size of the bottom tail over the next few prints. If consistency starts closing the gap with accuracy, the cleanup is reaching banks' actual books. If it keeps lagging while the top band keeps swelling, the index is measuring who can pass a test, not who understands their own risk.
Reporting basis: the definition and stated purpose of the sDQI, and the scores and sub-scores for June 2026 and March 2026, are from RBI's own press release and publication for those quarters. The score-distribution figures by band are from RBI's published sDQI score-distribution chart for June 2026. Historical scores for March 2024, March 2025, June 2025, September 2025 and December 2025 are from RBI's press releases and publications for those respective quarters. The Supervisory Returns Directions, 2026, including their penalty provision and the 87-bank coverage of the sDQI, are from RBI's own Directions document. RBI's July 2026 draft Guidance on Regulatory Expectations for Data Governance is from RBI's press release announcing it. Deputy Governor Swaminathan J's remarks are from a January 2026 speech reprinted by the Bank for International Settlements. The two-year, six-quarter sum of prior gains, and its comparison against the June 2026 quarter's gain, are The Signal's calculations from RBI's published scores.