India's trade numbers with China, released this month, read like a turnaround. In the five months from April to August of the current fiscal year, exports to China rose 38.71 percent to $9.61 billion from $6.93 billion a year earlier, the sharpest jump among India's major markets, Commerce Secretary Rajesh Agrawal said. Engineering goods contributed 20.73 percent of that growth, electronic goods 15.4 percent, petroleum products 13.55 percent, organic and inorganic chemicals 10.53 percent, and iron ore 9.97 percent, according to The Tribune's report of his remarks. Widen the lens and the same months show India's exports to the four core BRICS economies, China, Russia, Brazil and South Africa, rising 34 percent to $19.9 billion, with China alone up 39 percent to $9.6 billion and the bloc's share of India's total exports climbing to 9.2 percent from 8.1 percent a year earlier, Deccan Chronicle reported, citing Commerce Ministry data. Read only the top line and it looks like Indian manufacturing is finally selling into China at scale.
It is worth slowing down on that. In the fiscal year that ended in March 2026, India's trade deficit with China widened to a record $112.16 billion, as $131.63 billion of imports dwarfed just $19.47 billion of exports, the widest gap India runs with any single trading partner, the Embassy of India in Beijing states, citing Department of Commerce data. A record deficit is not what a genuine rebalancing looks like. And the freshest numbers do not show the gap closing either: the Commerce Ministry's own quick trade estimates put India's April-August 2026-27 import growth from China at 27.01 percent, alongside that 38.71 percent export growth, in the same PIB release.
The number that matters is the base, not the rate. Exports growing faster than imports sounds like convergence, but with imports from China nearly seven times the size of exports in FY2025-26 ($131.63 billion against $19.47 billion, per the Embassy of India, Beijing), a 27.01 percent rise on the larger number still adds far more in dollars than a 38.71 percent rise on the smaller one, per the Commerce Ministry's growth rates for April-August 2026-27 (our calculation, combining that base year with those growth rates). The percentages flatter the export side. The deficit does not move.
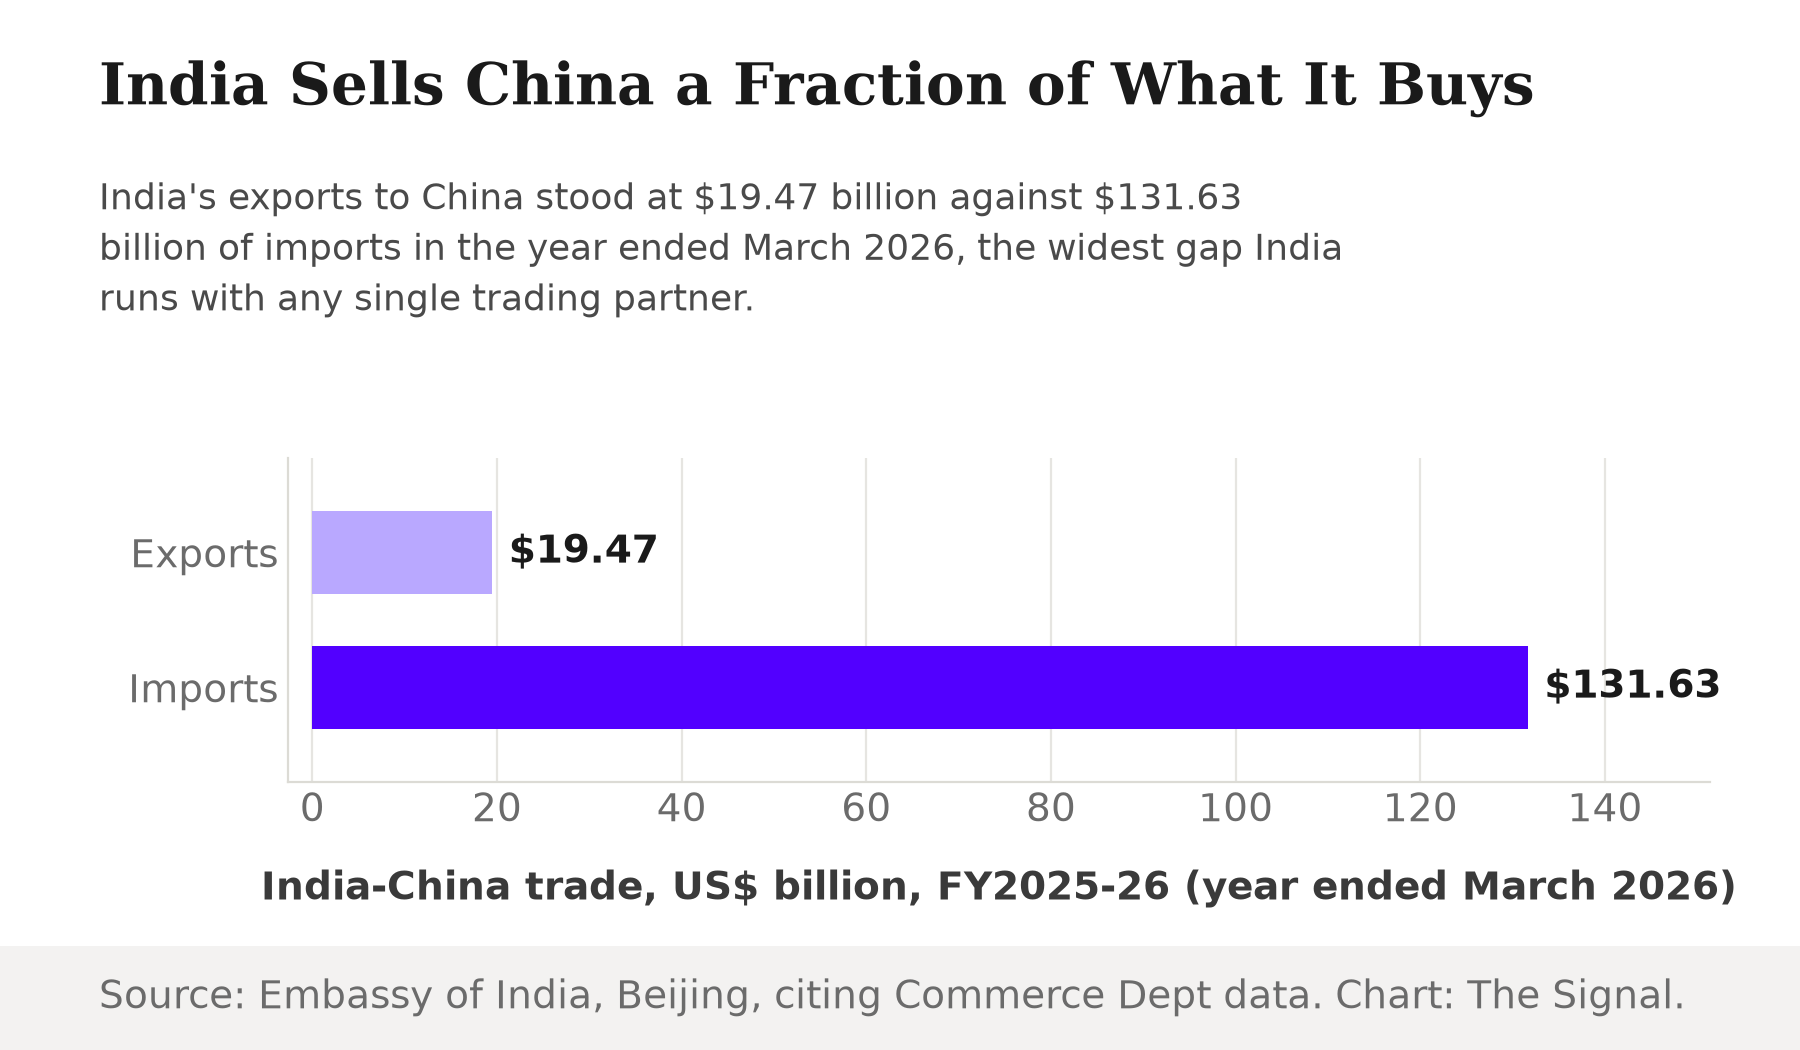
Source: Embassy of India, Beijing, citing Department of Commerce data. Chart: The Signal.
What is actually driving the export number
Engineering and electronics goods did most of the work behind the April-August surge, per Commerce Secretary Rajesh Agrawal's breakdown of the growth.
| Product category | Share of export growth to China |
|---|---|
| Engineering goods | 20.73% |
| Electronic goods | 15.4% |
| Petroleum products | 13.55% |
| Organic and inorganic chemicals | 10.53% |
| Iron ore | 9.97% |
Source: Commerce Secretary Rajesh Agrawal, cited in The Tribune, April-August 2026-27.
Inside engineering, the growth came from machinery and parts, auto components and hand tools, a Bloomberg-sourced report carried by KNN India states, putting the sector's rise at around 21 percent for the five months. Electronics tell a sharper story. India's electronics exports to China tripled to $3.18 billion in the fiscal year ended March 2026, driven by printed circuit board assemblies, smartphones, display modules and telecom equipment, and kept climbing more than 15 percent further in April-August 2026-27, a Bloomberg News report carried by ThePrint states. That is a real manufacturing story: India is assembling and shipping finished electronics goods to China, not just raw commodities.
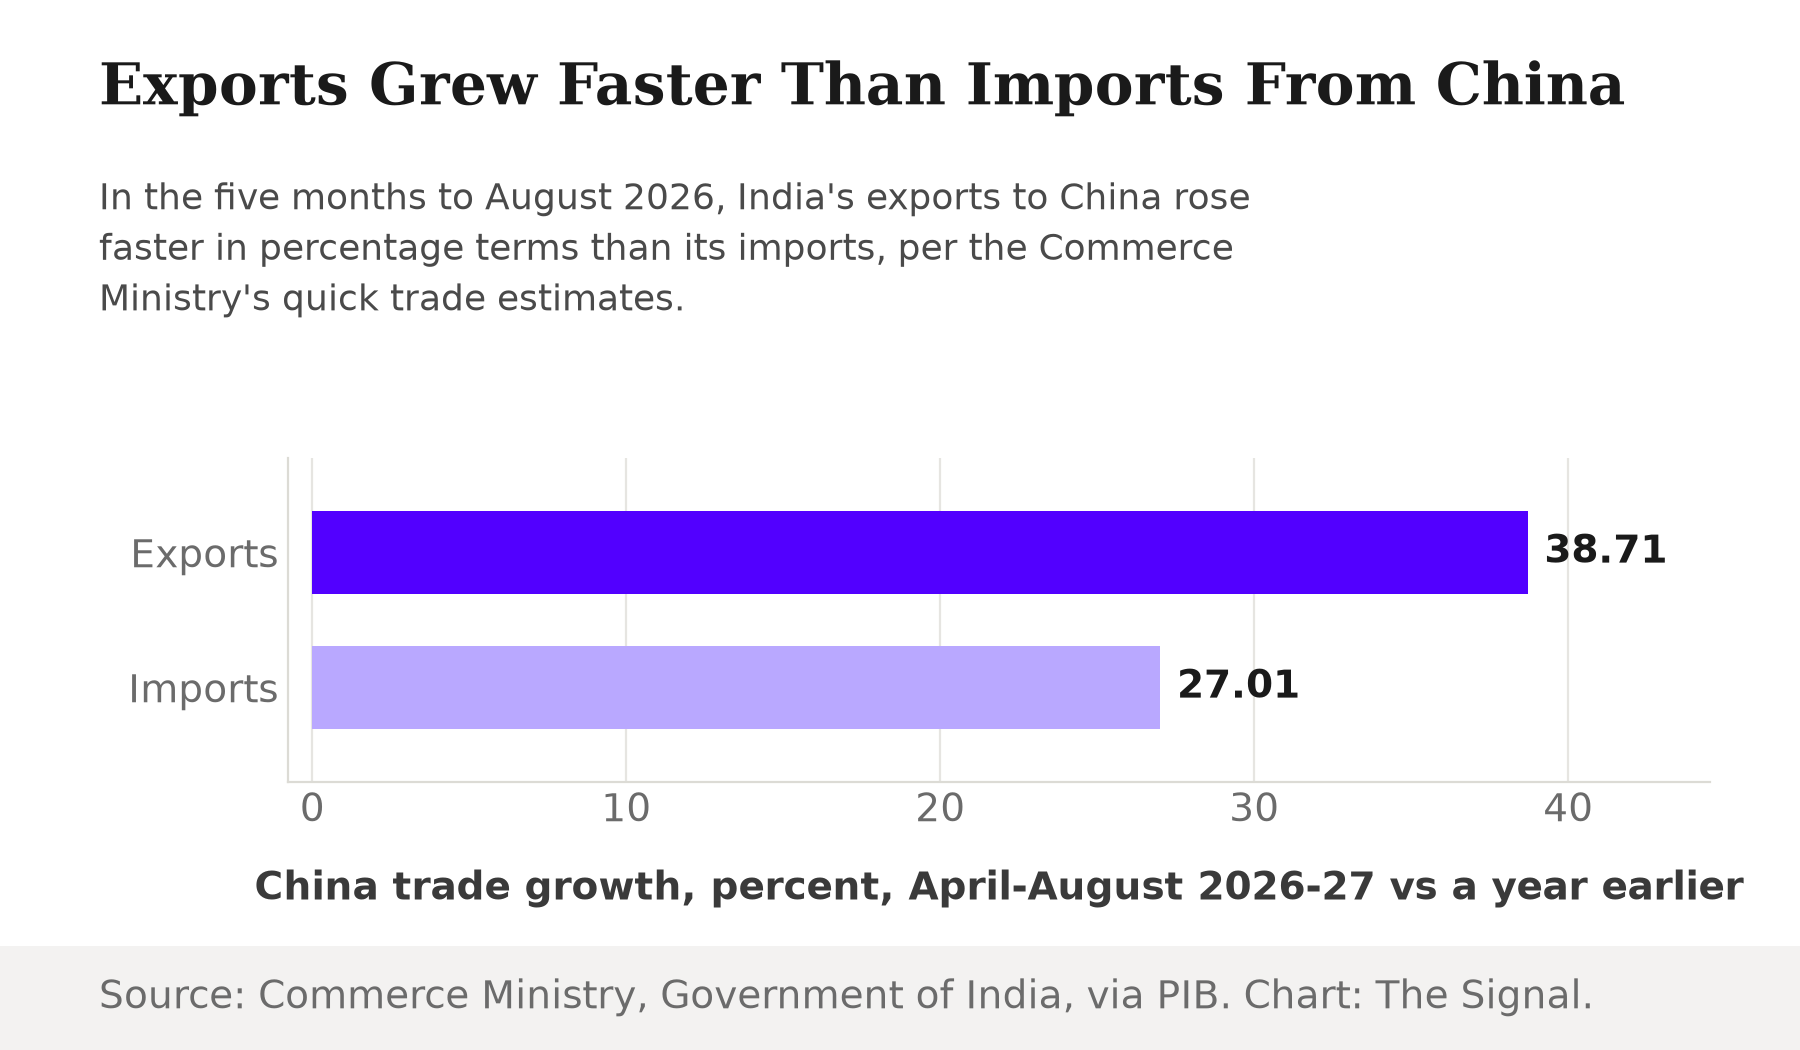
Source: Ministry of Commerce and Industry, DGCIS quick estimates, via PIB. Chart: The Signal.
The deficit that keeps widening
The category doing the exporting, electronics, is the same one where India's dependence on China has been getting worse, not better. The trade deficit in electronics and electrical machinery, HS Chapter 85, reached $43.1 billion in the fiscal year ended March 2026, roughly double the approximately $20 billion recorded in FY2018-19, which "points to a structural trade deficit rather than one driven by cyclical changes in imports," a Koan Advisory Group and Institute of Chinese Studies report found, reported by ThePrint. The dependence is also spreading across more of the electronics supply chain: China supplied over 80 percent of India's imports across 71 electronics product lines in the fiscal year ended March 2026, up from just 44 such product lines in FY2018-19, with the concentration sitting in core components rather than finished devices, a Koan Advisory Group-Institute of Chinese Studies study reported by Free Press Journal finds.
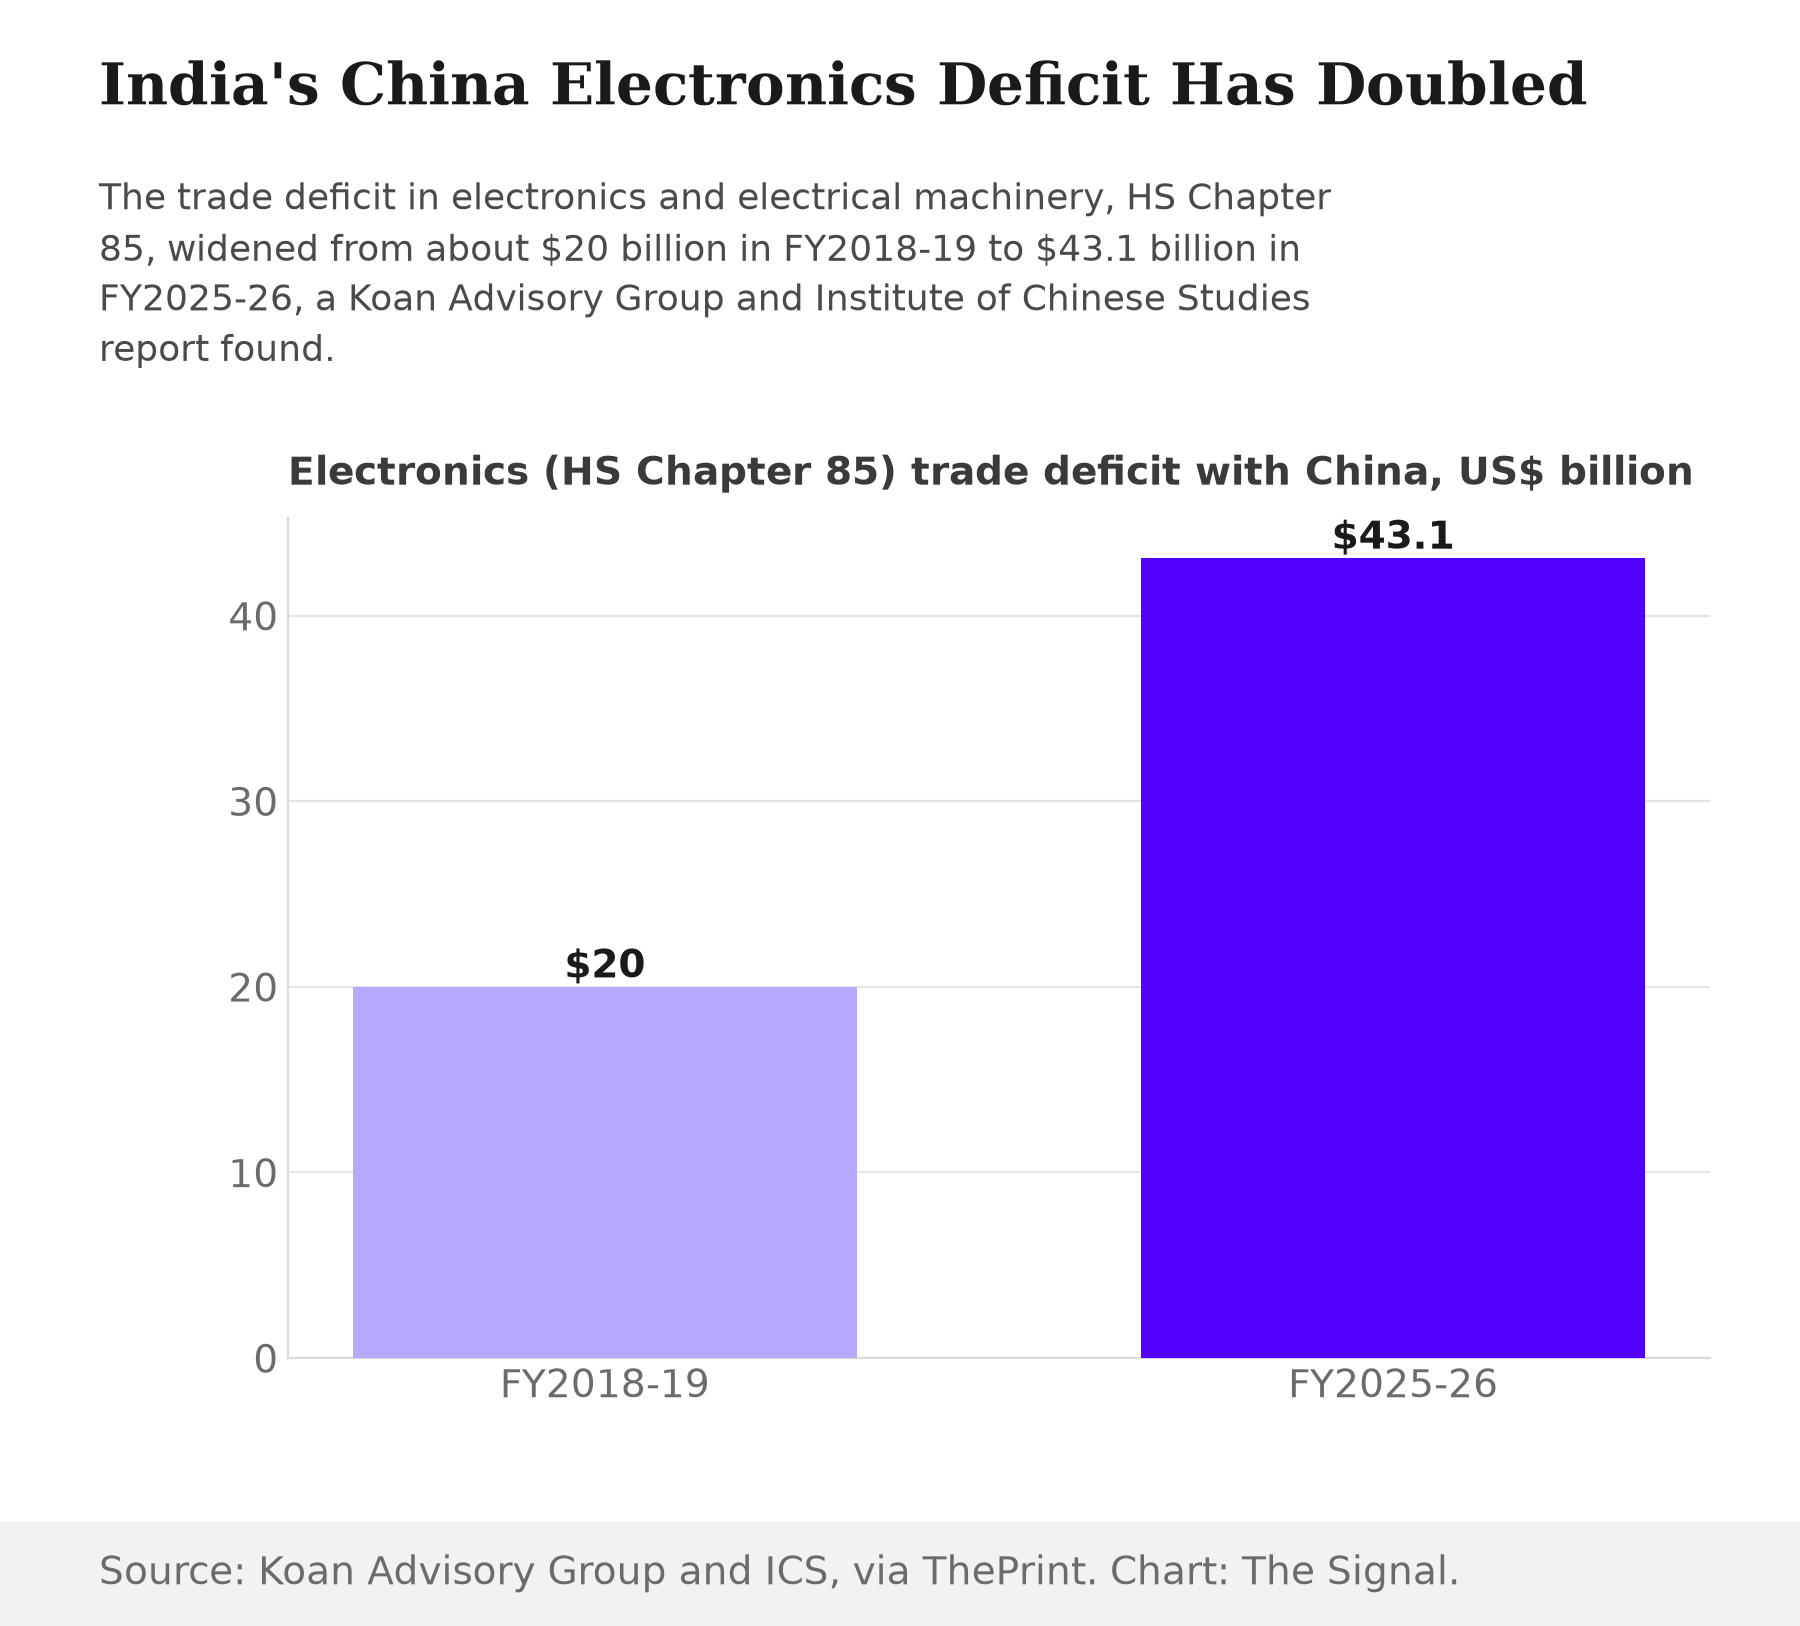
Source: Koan Advisory Group and Institute of Chinese Studies, via ThePrint. Chart: The Signal.
Put the two facts next to each other. India is shipping more finished electronics to China than ever. India is also more reliant on Chinese-supplied electronics components than it was seven years ago, across a widening range of product lines. Both are true in the same fiscal year, in the same broad product category.
That is not a coincidence of timing, it is the same input-output structure showing up twice. In OECD Trade in Value Added terms, which trace where the components inside a country's exports actually originate, India's ICT-and-electronics sector carries both the highest foreign value-added content of any export industry, 41.8 percent in 2022, and the highest share of imported intermediates used in production for export, 42.9 percent, OECD's Trade in Value Added country note for India shows. China supplies more of that foreign content than any other country, accounting for 13.6 percent of the value embedded in India's imports overall, ahead of the European Union at 12.1 percent and ASEAN at 10.9 percent. The category generating India's sharpest export gains to China is, mechanically, the category most built from parts sourced abroad, and China is the single largest source of those parts.
The honest objection
The strongest case against reading this as dependence is that the growth itself looks like capability, not pass-through. Engineering exports, machinery and parts, auto components, hand tools, are not the kind of goods that get built by relabeling someone else's components; they imply actual manufacturing capacity coming online. And the arithmetic genuinely favors India at the margin: exports to China grew faster than imports from China in percentage terms in April-August 2026-27, 38.71 percent against 27.01 percent, per the Commerce Ministry's own release. If that gap in growth rates holds up for several years, the deficit would eventually narrow on its own.
This pattern is also not unique to India, and the comparison cuts against the capability reading. Vietnam is the economy most often cited for assembling goods from imported components and re-exporting them, and it shows a far more advanced version of the same structure: the foreign content of Vietnam's exports reached 48 percent in 2020, versus an OECD average of 26.7 percent, imported intermediates accounted for 84.3 percent of its ICT-and-electronics exports, and China supplied 30.4 percent of Vietnam's gross imports and 25 percent in value-added terms, roughly double China's equivalent share of India's imports, OECD's Trade in Value Added country note for Viet Nam shows. If India's electronics export growth to China is early-stage assembly-led trade, Vietnam's trajectory is what the fuller-blown version of that same pattern looks like, not evidence that assembly-led growth eventually escapes its input dependence.
That case is real, but it only accounts for a slower widening, well short of a structural fix. The FY2025-26 deficit was not just large, it was a record, $112.16 billion, per the Embassy of India in Beijing, reached in the same year electronics exports were tripling. And the part of the deficit tied most directly to the electronics category doing the exporting is the part a Koan Advisory Group and Institute of Chinese Studies report explicitly called structural rather than cyclical, doubling to $43.1 billion since FY2018-19 while the count of import-dependent product lines rose from 44 to 71. A few months of a faster export growth rate, off a base one seventh the size of imports, is not yet evidence that the structure is changing.
The Signal
India's exports to China are not fake. Engineering goods, electronics, petroleum and chemicals are moving in real volumes, and the Commerce Ministry's own quick trade estimates show that growth outpacing import growth for the five months to August 2026. But an export boom and a shrinking deficit are two different claims, and only the first one is true so far. The deficit that actually measures dependence, on electronics components specifically, hit a record in FY2025-26 and has been called structural by the researchers who track it closely. Watch what happens to the electronics deficit specifically, not the headline export number, over the next full fiscal year. If the $43.1 billion HS Chapter 85 gap starts shrinking, decoupling is underway. If it keeps widening while the export figures keep making headlines, India is getting better at assembly and no less dependent on the country it is assembling for.
Reporting basis: the April-August 2026-27 export and import growth figures, and the top-5 destination and source rankings, are from the Ministry of Commerce and Industry's DGCIS quick trade estimates, via a PIB press release. The FY2025-26 annual deficit and the $131.63 billion import and $19.47 billion export totals are from the Embassy of India, Beijing, citing Department of Commerce data. The product-category breakdown of the export growth is per Commerce Secretary Rajesh Agrawal's remarks, as reported by The Tribune. The electronics export figures (the tripling to $3.18 billion in FY2025-26 and the further rise in April-August) and the engineering export breakdown are from Bloomberg News wire copy, carried respectively by ThePrint and KNN India. The structural electronics trade deficit figures and the 71-product-line import dependence finding are both from a joint Koan Advisory Group and Institute of Chinese Studies report, as reported respectively by ThePrint and Free Press Journal, and rest on that one study as their underlying source. The BRICS export-share figures are from Deccan Chronicle, citing Commerce Ministry data. The comparison of import growth in dollar terms against export growth in dollar terms, given the size of the underlying bases, is The Signal's own calculation from those figures. The foreign value-added and imported-intermediate figures for India's ICT-and-electronics sector, and China's share of value added embedded in India's imports, are from the OECD's Trade in Value Added country note for India. The comparable Vietnam figures are from the OECD's Trade in Value Added country note for Viet Nam.