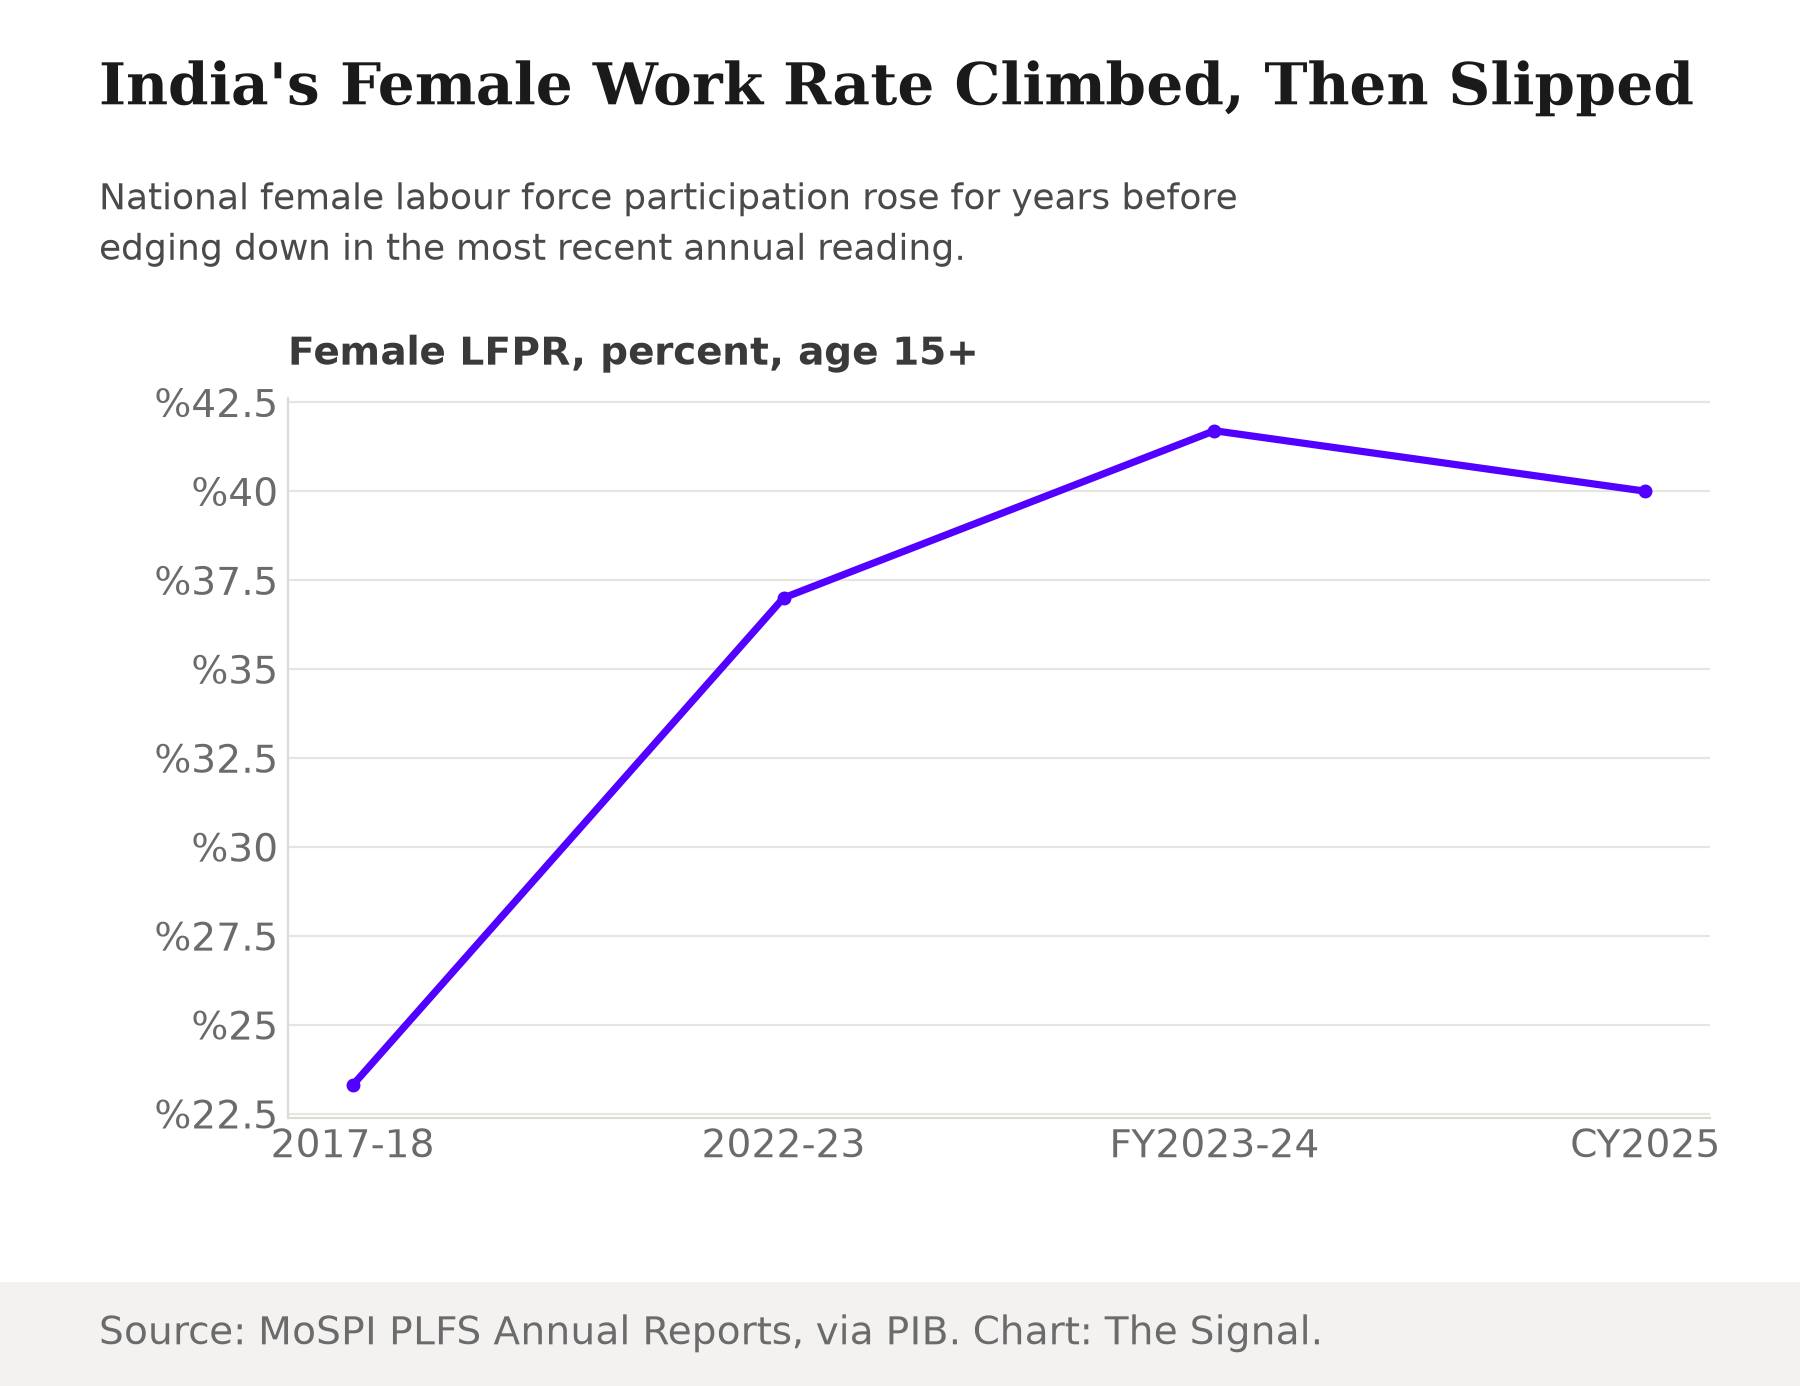
On 18 September 2026, MoSPI's National Statistical Office published India's first-ever district-level labour market bulletin, breaking the country's jobs data down by district instead of stopping at the state or national line. Its headline finding reads like a continuation of an already good story: around 57.8% of the districts covered recorded a female labour force participation rate (LFPR) of 40% or above in 2025. That fits the trend the national figures have told for years. Female LFPR rose from 23.3% in 2017-18 to 37.0% in 2022-23, climbed further to 41.7% in the year to June 2024, and in calendar year 2025 stood at 40.0%, against a male LFPR of 79.1%. Read only that line and the story is simple: a decade of attention to women's work has pulled millions of Indian women into the labour force, and most districts are now clearing a meaningful bar.
It is worth slowing down on that. A national average is, by definition, a blend, and this is the first release that lets anyone see what is actually being blended. Strip the headline share away and look at the extremes NSO itself published: across states, the single district with the highest female LFPR ranges from Hamirpur in Himachal Pradesh at 80.9% down to East Delhi at 18.9%, with Siwan in Bihar at 24.7%, a gap of more than 62 percentage points between the best-performing district in the strongest state and the best-performing district in the weakest. That is not a comparison of a rich state against a poor one. It is a comparison of each state's own top performer, the district each state would point to first.
The National Number Is an Average of Two Very Different Indias
The bulletin's own framing is that a majority of districts have crossed a threshold. The reverse framing is just as true and gets said less often: more than four in ten of the districts NSO covered, 42.2%, have not reached the 40% female LFPR mark the bulletin treats as a milestone. (The release does not spell out the exact universe behind that 57.8% figure the way it does for its district rankings, which are explicitly drawn from the 100 most populous districts; the two are not necessarily identical.)
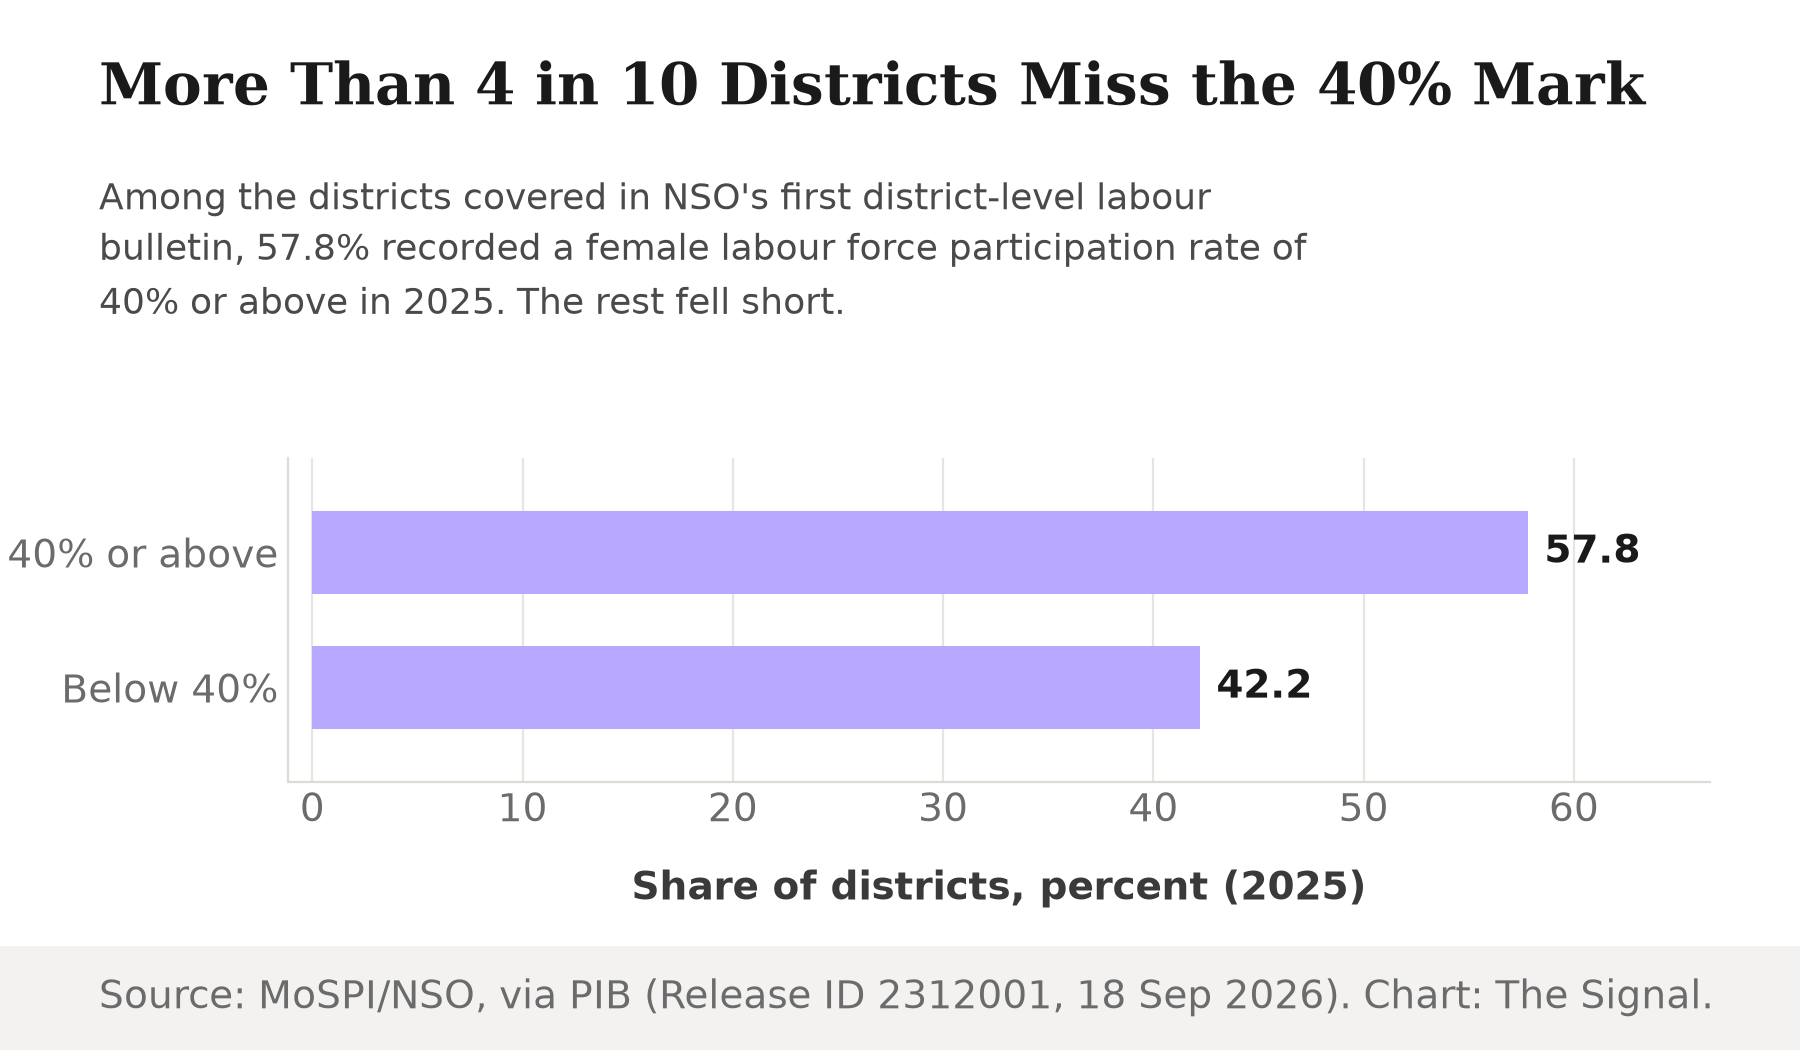
A "most districts cleared 40%" framing and a "more than four in ten missed it" framing both describe the same NSO release. Neither is wrong. What the split shows is that the milestone framing flattens a real and large minority into a footnote.
Where Overall Work Is Already Highest, and Lowest
The same release also ranks overall work rates, not split by sex, among its 100 most populous districts, and the pattern rhymes. Surat in Gujarat recorded the highest overall LFPR and worker population ratio among those 100 districts, at 68.6% and 67.8% respectively, while Darbhanga in Bihar recorded the lowest of both. Araria in Bihar and Salem in Tamil Nadu followed close behind Surat on overall LFPR, at 68.0% and 67.8%.
Among the 100 most populous districts NSO ranked, the top overall work rates cluster tightly near 68%, whichever state they sit in.
| District | State | Overall LFPR |
|---|---|---|
| Surat | Gujarat | 68.6% |
| Araria | Bihar | 68.0% |
| Salem | Tamil Nadu | 67.8% |
Source: MoSPI, National Statistical Office, via PIB, 2025.
Bihar supplies both a top-three district, Araria, and the release's single lowest-ranked district, Darbhanga, inside the same state. That alone argues against reading any state's average as a stand-in for its districts.
Surat's own district administration explains part of the mechanism behind its top ranking: Surat is a textile and diamond industrial hub, with roughly three-quarters of the world's diamonds cut and polished there. A district built around large-scale factory and workshop employment is a different kind of local economy than one built around family farms, and that difference shows up directly in who counts as working.
A Rising Line, Not a Straight One
The national trend behind all of this has been genuinely upward, but not in a straight line. Female LFPR climbed from 23.3% in 2017-18 to 37.0% in 2022-23 and further to 41.7% in the year to June 2024, before the most recent official reading put it at 40.0% for calendar year 2025, below that prior peak. Because the FY2023-24 figure covers a rolling year to June and the newest figure covers a calendar year, the small dip is not necessarily a reversal of the broader climb. It is a reminder that even the national number the 40% threshold echoes has moved by a percentage point or two between successive official readings, before the district data ever gets involved.
Best of State Still Means Worlds Apart
Which brings the piece back to the sharpest figure in the release. Looking only at each state's own highest female LFPR district, the leaders run from Hamirpur, Himachal Pradesh at 80.9% down to East Delhi at 18.9% and Siwan, Bihar at 24.7%, a spread of more than 62 percentage points among districts that are each, within their own state, the best available evidence of what is possible.
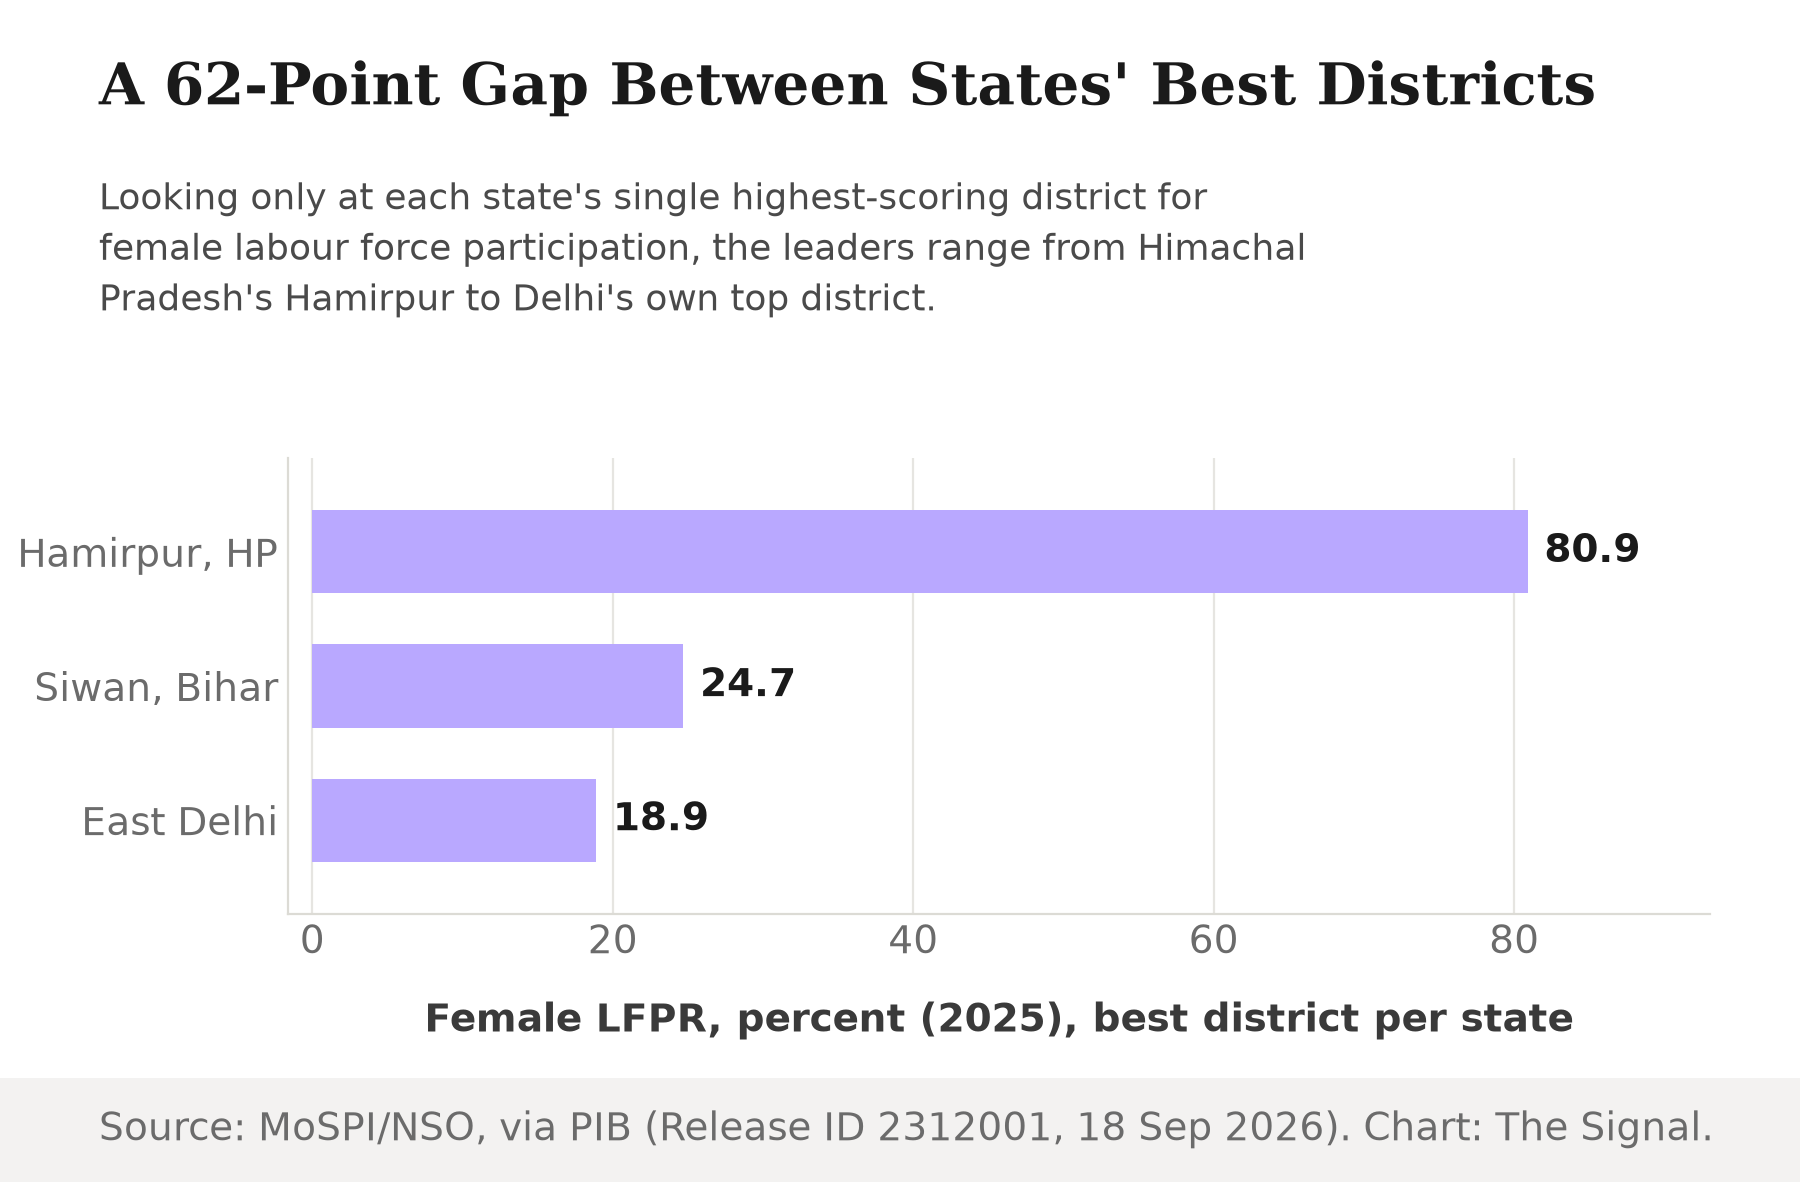
Hamirpur's 80.9% is Himachal Pradesh's own answer to the question of where female work is highest in the state. In Delhi, that same answer is East Delhi at 18.9%, more than four times lower. A national or even a state-level target calibrated to the 40% milestone treats these as the same kind of place. The district data say they plainly are not.
Part of why Hamirpur sits so high is visible in its own district administration's numbers: of Hamirpur's 2011 Census population of 454,768, some 423,338, or 93.1%, lived in rural areas, against barely 31,430 in towns. A district that rural, in a hill state where family landholdings and informal farm work are the norm, records "working" for women very differently than a dense metropolitan district built on formal urban employment does. That is not proof of a single cause behind the 62-point gap, but it is a concrete, sourced difference between the kind of place Hamirpur is and the kind of place East Delhi is, rather than just a gap between two numbers.
The Honest Objection
The strongest case against making too much of this is that MoSPI's own PLFS-based figures may themselves run hot next to independent international benchmarks, which would undercut the premise that 40% is a meaningful national baseline to measure districts against in the first place. World Bank data, drawing on the ILO's modelled estimate, put India's female labour force participation rate at 32.4% in 2025, well below MoSPI's own 40.0% figure for the same year. If the national anchor itself is uncertain by nearly 8 points depending on whose methodology is used, why trust a 40% district threshold at all.
That case is real but it answers a different question. The World Bank's ILO-modelled series and MoSPI's PLFS survey define and measure labour force status differently, a methodology divergence rather than a contradiction over the same fact. What the district bulletin measures is internal to PLFS: the same survey, the same definitions, applied district by district instead of stopping at the state line. Whatever the true national level is on some other yardstick, the gap between Hamirpur and East Delhi is a comparison PLFS makes with itself, and that comparison does not depend on resolving the international benchmarking debate.
| Female LFPR estimate, 2025 | Source | Value |
|---|---|---|
| PLFS Annual Report, national | MoSPI | 40.0% |
| Modelled ILO estimate | World Bank | 32.4% |
Source: MoSPI PLFS Annual Report 2025, via PIB; World Bank World Development Indicators.
The Signal
A rising national female work-rate figure is real progress and this bulletin does not undo it. What it does is retire the idea that the national figure describes any actual place. That threshold was never a place; it was a line drawn through Hamirpur and East Delhi at once. The district data now make it possible to ask a sharper question than whether the national number is rising: which specific districts, not which states, are still stuck below the bar their neighbours have already cleared, and whether spending built around a state or national target actually reaches them. NSO has published district-level numbers exactly once. Whether it does so again on a regular cadence will decide whether this becomes a tool for finding the East Delhis of Indian labour policy, or a one-off curiosity the next national update quietly buries.
Reporting basis: the district-level share crossing the female LFPR threshold, the highest and lowest overall LFPR and WPR among the most populous districts, and the state-wise highest female LFPR districts are all from MoSPI's National Statistical Office release of 18 September 2026, as published across three linked Press Information Bureau pages covering that same release. The national female LFPR trend draws on three separate official readings: the Economic Survey 2023-24, MoSPI's PLFS Annual Report for July 2023-June 2024, and MoSPI's PLFS Annual Report 2025, each via PIB. The competing international estimate is World Bank data drawing on the ILO's modelled estimate. The percentage-point gaps between districts, the share of districts still below the 40% mark, the four-times comparison between Hamirpur and East Delhi, and the gap between the two national estimates are all The Signal's calculations from those published figures.