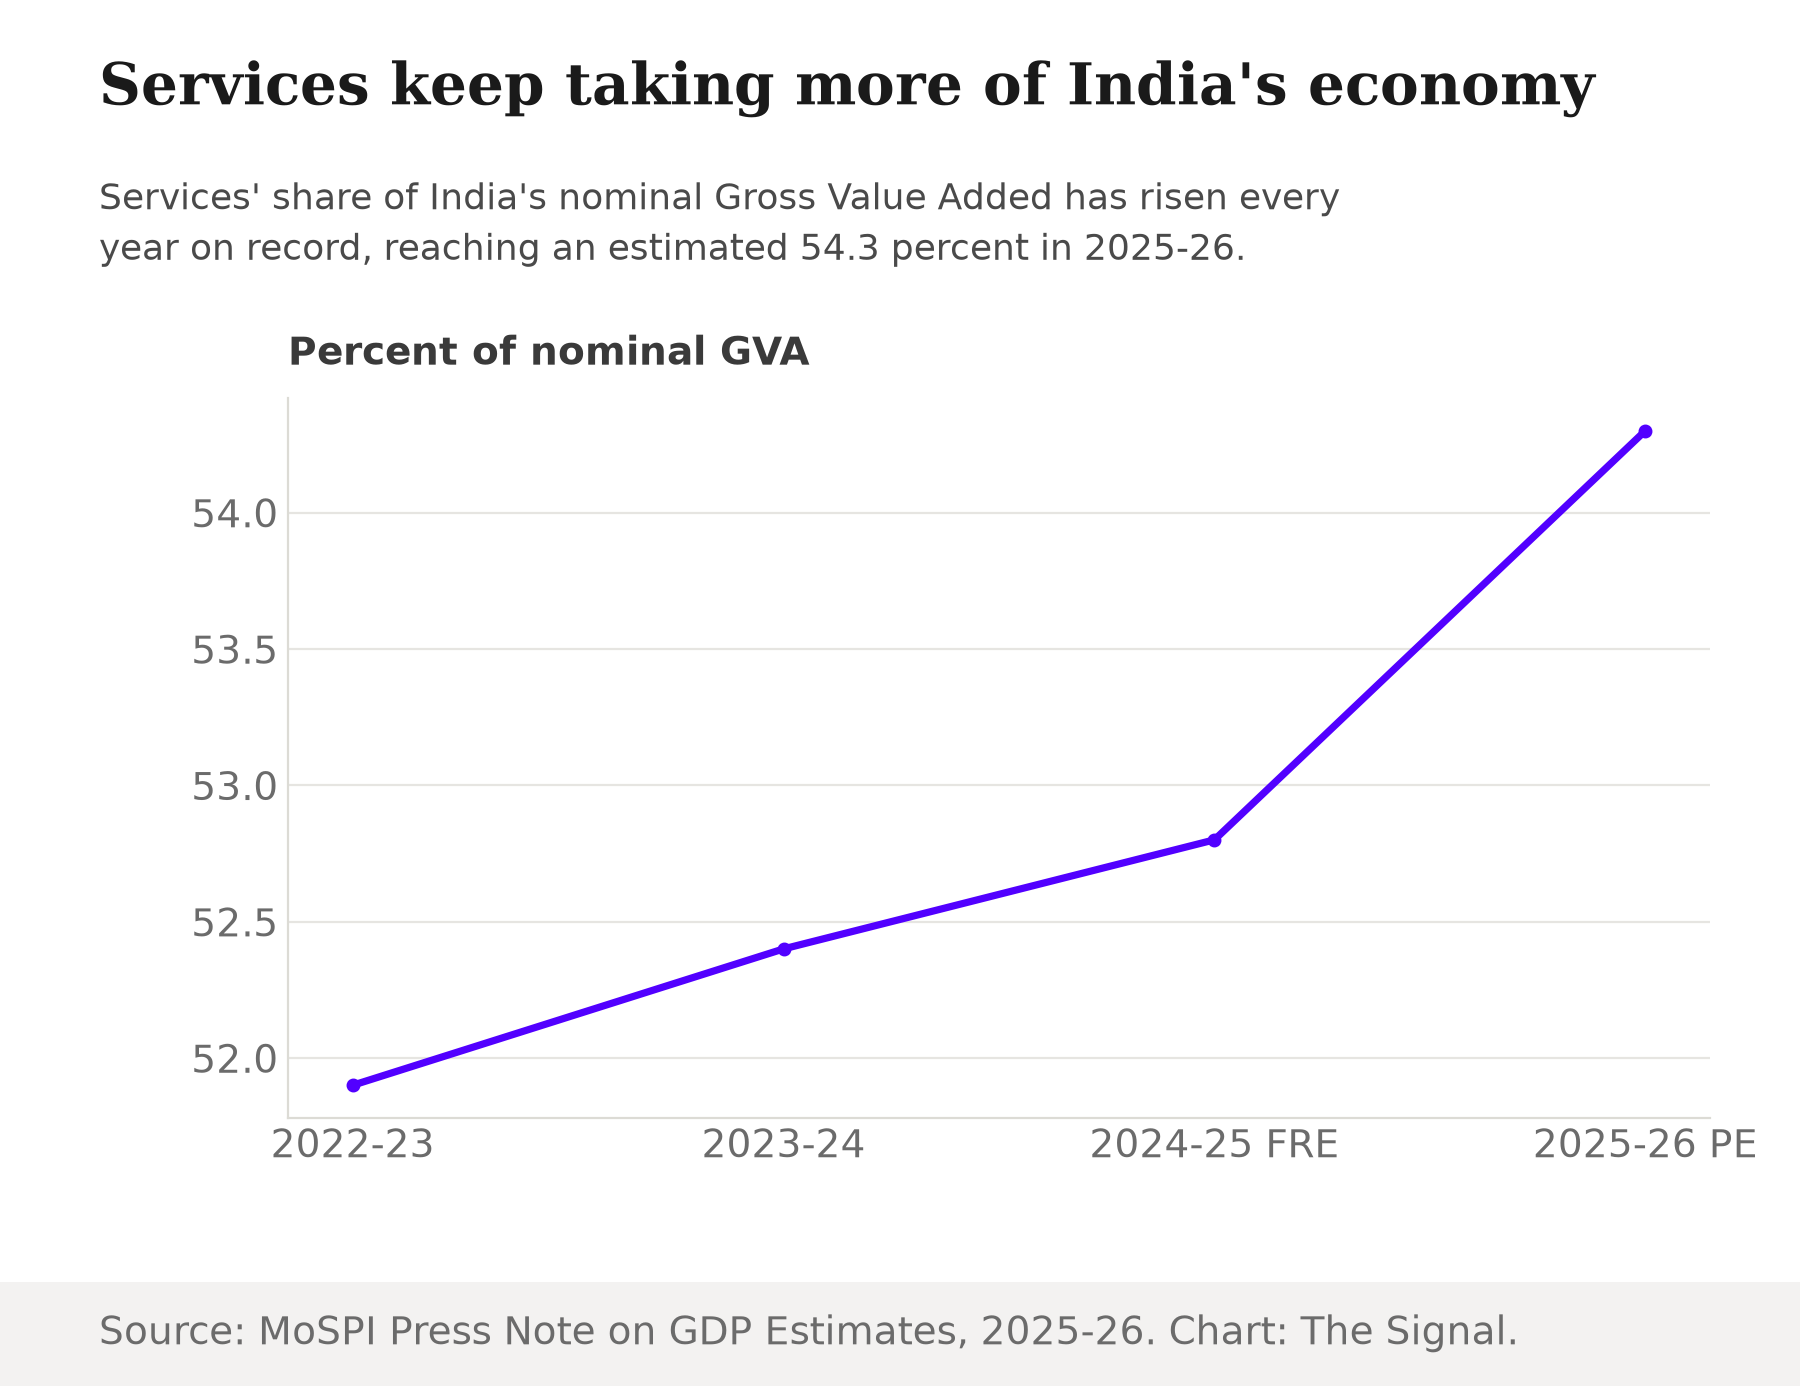
On 14 July 2026, MoSPI released India's first-ever trial Index of Services Production (ISP), covering 19 services sub-sectors for April 2026, according to a Press Information Bureau release. The natural reading is that India has finally built a monthly production gauge for the sector that dominates its economy. Services have made up more than half of India's Gross Value Added every year since 2013-14, the Technical Advisory Committee on ISP notes in its report to MoSPI. By MoSPI's latest provisional estimates, services now account for 54.3 percent of nominal GVA in 2025-26, up from 51.9 percent just three years earlier in 2022-23, the ministry's GDP press note shows.
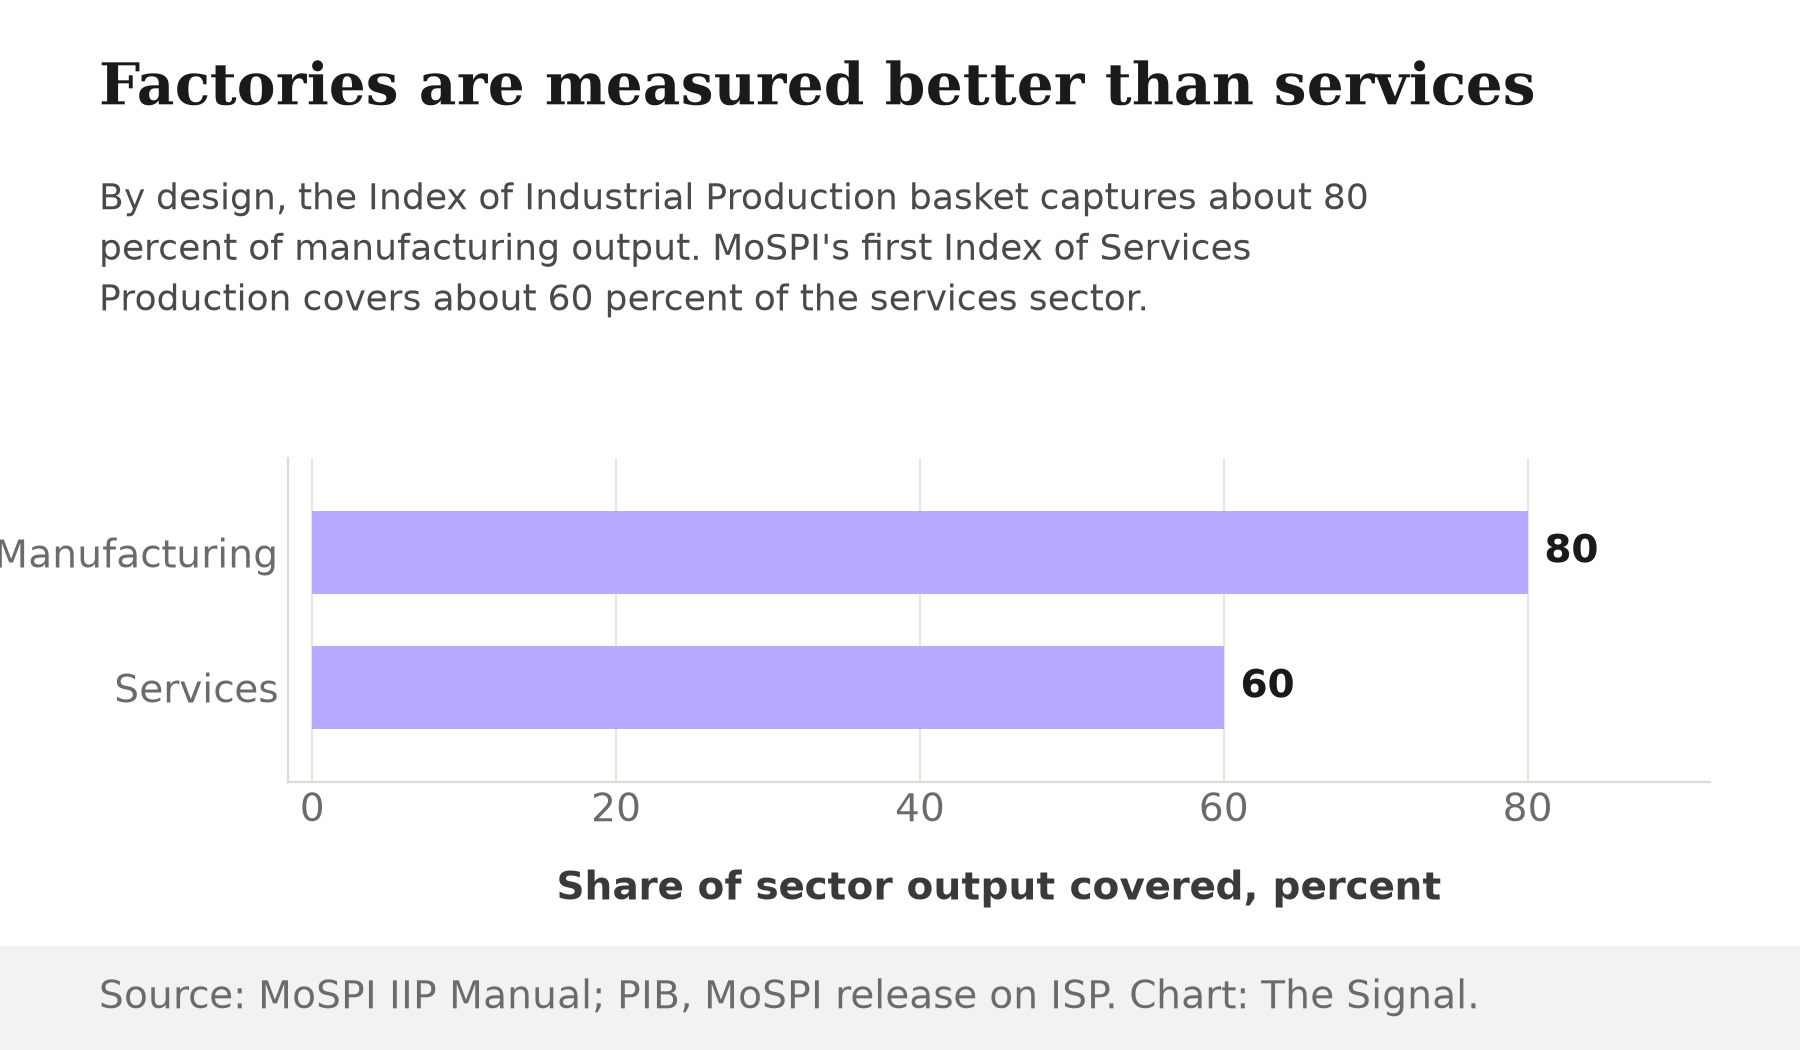
For a sector that size, a dedicated production index sounds overdue, and it is. But it is worth slowing down on what "dedicated" actually means here. Those 19 sub-sectors in the first release cover about 60 percent of the services sector, MoSPI's own release states.
MoSPI's new gauge for India's largest sector covers just three-fifths of it.
The other two-fifths, the majority of the economy's majority sector, still has no monthly production reading at all.
What the index still can't see
The gap is not scattered noise across small sub-sectors. It is concentrated in categories MoSPI chose to leave out: public administration and defence, most financial services outside banking and insurance, personal services, private households that employ staff, and health and education services the government itself provides, along with gambling and betting, a PIB-published FAQ booklet on the index states. Government-run health, education, administration and defence are among the largest categories of government spending, not niche activities, and they sit entirely outside the index's monthly view.
Built for a narrower net than the factory index
The contrast sharpens against the tool India already had for the other half of the economy. MoSPI's decades-old Index of Industrial Production selects its item basket so that the contribution to national output of everything in the basket runs to about 80 percent of manufacturing output, and it excludes services from its scope by definition, the IIP's own methodology manual states.
Manufacturing's older index was built to cover more of manufacturing than the new index covers of services.
| Index | Sector tracked | Built from | Design coverage |
|---|---|---|---|
| Index of Industrial Production | Manufacturing (services excluded by definition) | Physical output data from surveyed factories | About 80 percent of manufacturing output |
| Index of Services Production, first release | Services (19 of many sub-sectors) | Administrative and GST records | About 60 percent of the services sector |
Source: MoSPI's IIP Manual; PIB, MoSPI's first ISP release; News on AIR, on the index's administrative-data basis.
The new index leans entirely on administrative data, including inputs from government ministries and GST records, which MoSPI's Secretary said was chosen so no additional compliance burden falls on businesses, according to All India Radio's News on AIR. It is a reasonable trade-off, and also the reason the index can only reach as far as the administrative data already collected, not as far as the sector actually extends.
Forty candidates, nineteen made the cut
The 60 percent figure is not an accident of haste. Before settling on that scope, MoSPI's April 2026 Approach Paper had already screened more than 40 services sub-sectors for usable output data and suitable price deflators, the ministry's press release on the paper says. Fewer than half of the sub-sectors screened had data clean enough to make the first release.
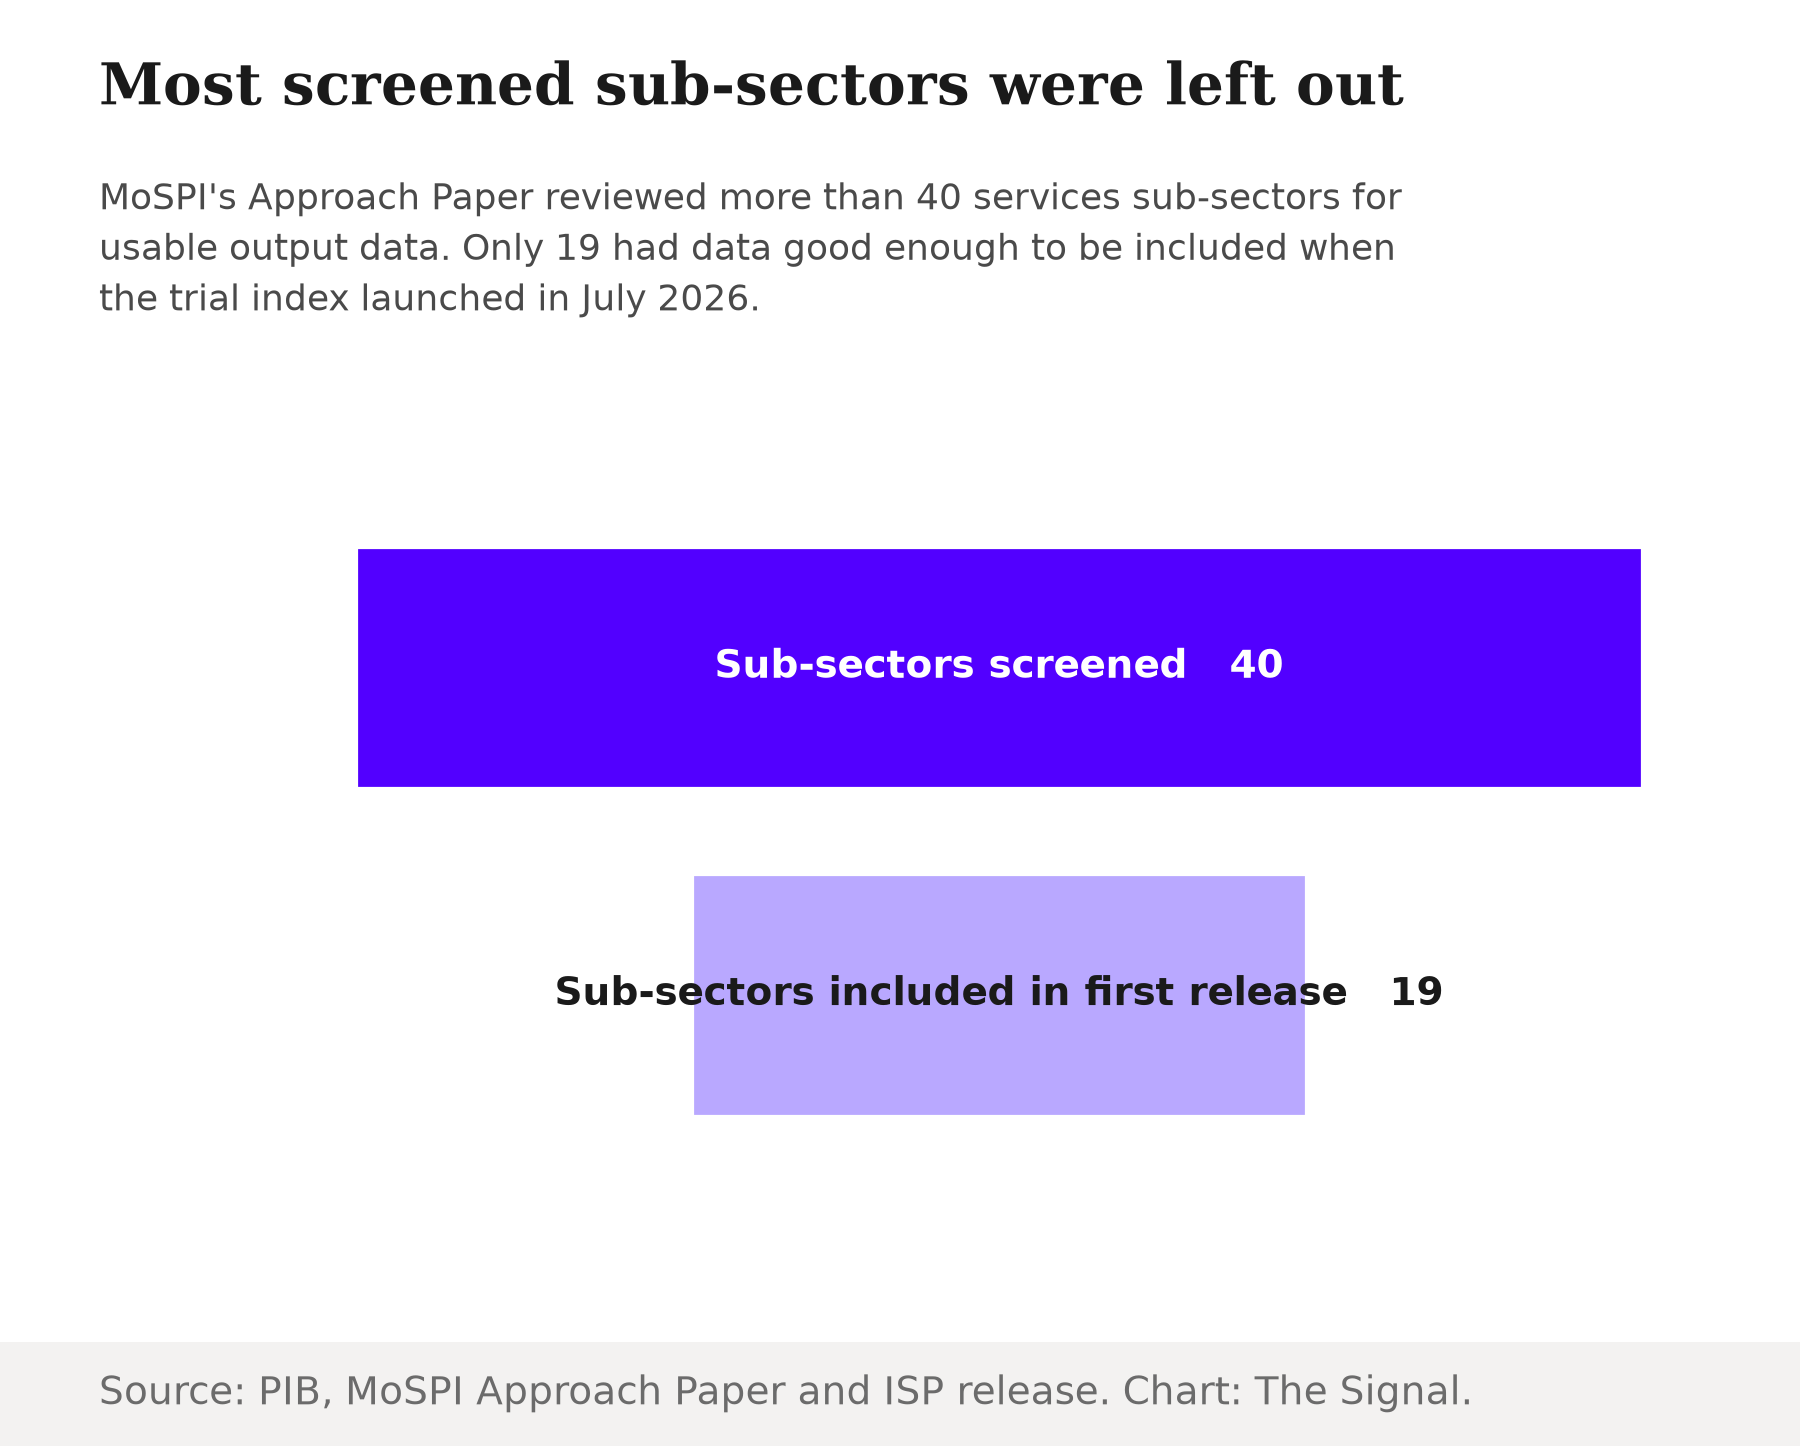
That screening process is also why the missing 40 percent is not a footnote. It is the visible edge of a genuine measurement problem: large parts of India's biggest sector simply do not generate the kind of clean, monthly, GST-traceable output data that the rest of the index runs on.
The scale sitting outside the frame
The sector's global reach makes the blind spot harder to shrug off. India's services exports were estimated at $103.41 billion for April-June 2026-27, up 6.16 percent year-on-year, as the government targets a 10 percent share of world services trade by 2047, a PIB backgrounder on the index notes. That is not a rounding error waiting for a future release. It is a large, actively growing part of the economy, measured abroad by the dollar and only partially at home.
The honest objection
The strongest case for patience is that MoSPI never claimed the index was finished. Its own Secretary and India's Chief Economic Adviser cautioned that the ISP, built entirely from administrative and GST data, is an experimental output indicator that should not be equated with the Gross Value Added figures used in GDP estimation, per News on AIR's reporting. On that reading, 60 percent from a standing start, clearly labelled experimental, is a defensible first release, not a failure. Starting with the 19 sub-sectors that already had usable administrative data is sound sequencing, not a design flaw.
That case holds up as methodology. It does not shrink the excluded 40 percent. The sub-sectors left out are not a random residual; they are concentrated in public administration and defence, non-bank finance, and government-run health and education, excluded because they were hardest to measure this way, not because they matter least. Until the index grows past its first 19 sub-sectors, that share of the economy is still inferred through the same lagged, proxy-based methods that predate the ISP, even as the sector's GDP share and its exports keep growing.
The Signal
The ISP's launch is real progress: India now has a monthly, sub-sector production reading for most of a sector that previously had none at all. But "most" is doing real work in that sentence, and MoSPI's own caution that the index should not be read as a GVA substitute is a reason to take the coverage gap seriously rather than wave it away. Watch what happens at the next release. If the sub-sector list grows past 19 and starts pulling in the government-run categories currently excluded, the index is closing the gap it opened. Should the count stay stuck at 19 while services keep taking a larger share of the economy, the blind spot stops shrinking. It simply turns into a fixed and growing fraction of a bigger number. A production index is only as good as what it declines to count.
Reporting basis: the ISP's launch date, sub-sector count and 60 percent coverage figure are from MoSPI's first release, via the Press Information Bureau. The list of excluded services sub-sectors is from a PIB-published FAQ booklet issued by MoSPI. Services' long-run share of Gross Value Added since 2013-14 is from the Report of the Technical Advisory Committee on ISP, and the 2022-23 through 2025-26 GVA share figures are from MoSPI's Press Note on Provisional Estimates of Annual GDP, both MoSPI publications via the National Statistics Office. The screening of more than 40 sub-sectors is from MoSPI's Approach Paper press release. The IIP's 80 percent design-coverage figure and its exclusion of services are from MoSPI's own IIP methodology manual. The services-export figures and the 2047 target are from a PIB backgrounder on the index. The MoSPI Secretary's and Chief Economic Adviser's caution against equating the ISP with GVA is as reported by All India Radio's News on AIR. No figures in this piece are The Signal's own calculations; all are as published by MoSPI or the Press Information Bureau.