India's merchandise trade numbers for July 2026 read like a warning. Goods exports came to $44.24 billion against imports of $76.22 billion, a monthly deficit of $31.98 billion, and the Commerce Ministry's release shows the cumulative deficit for April to July of this fiscal year has widened to $118.60 billion, up from $96.66 billion over the same four months a year earlier. Read only that release and the story is straightforward: India is buying far more from the world than it sells, and the gap is getting bigger.
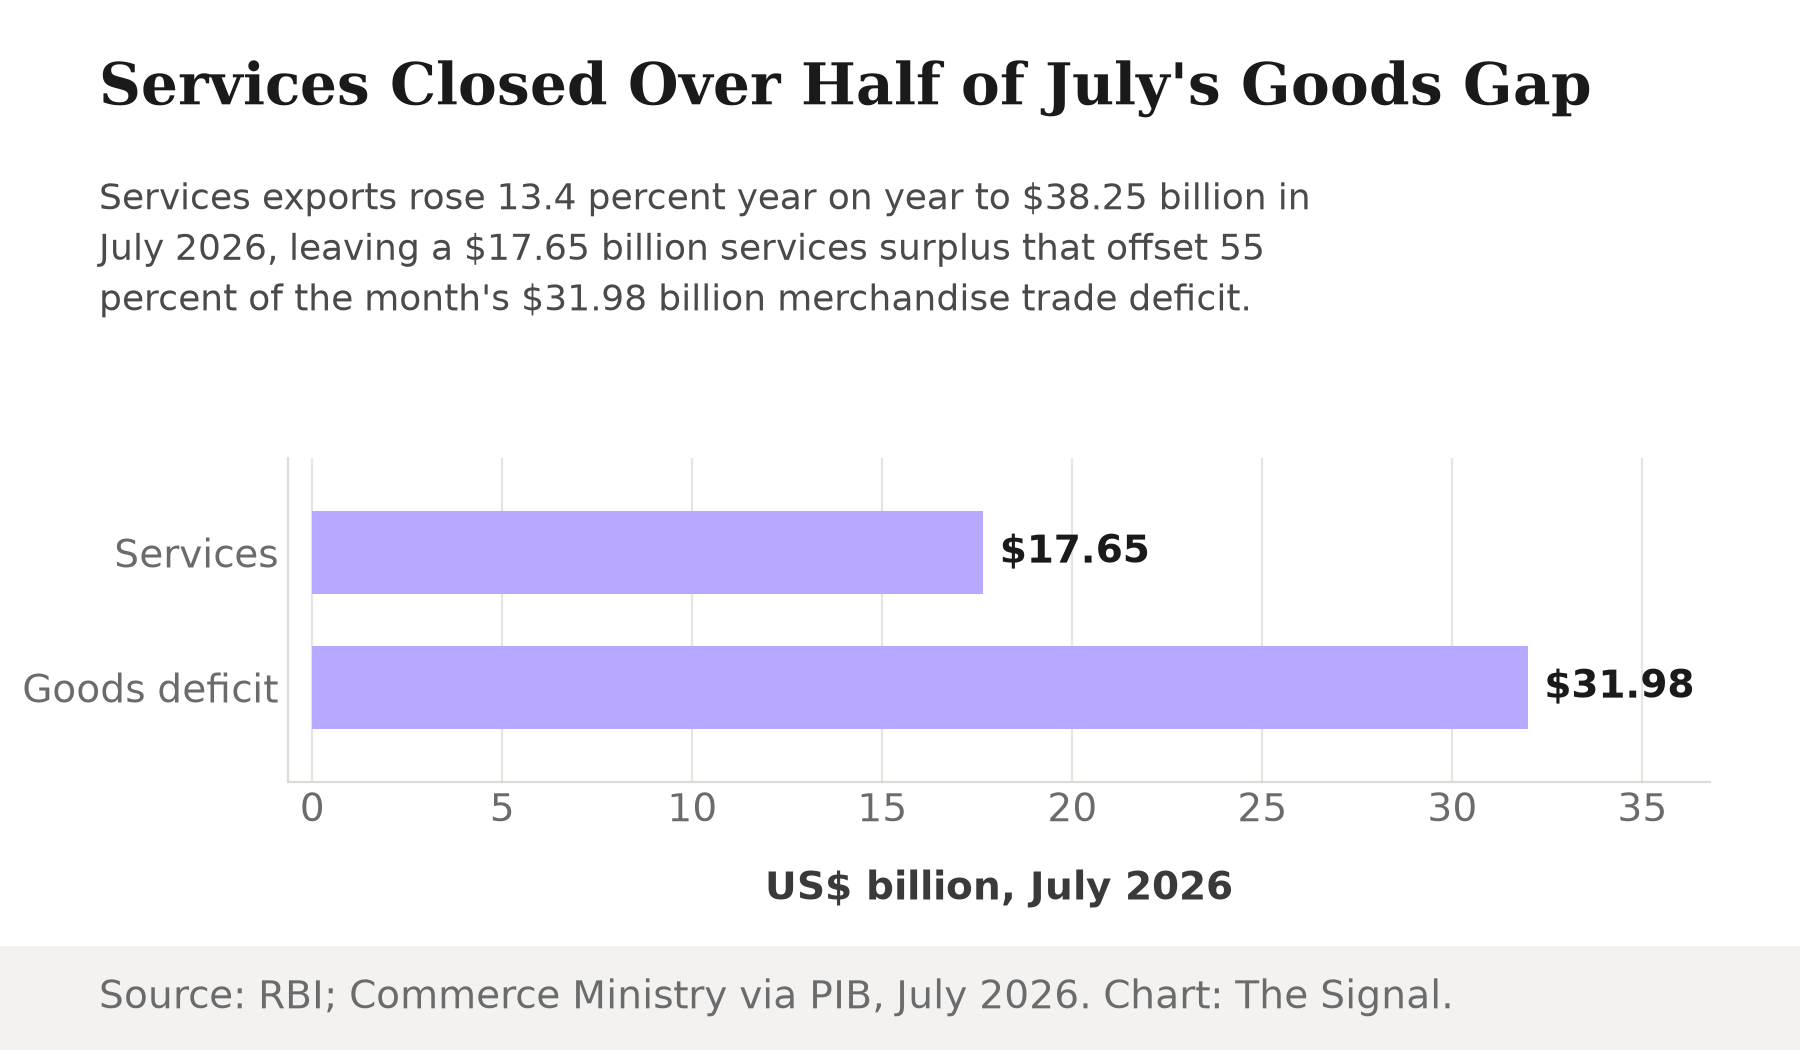
That is a real number, and it is worth taking seriously. But it is also only half of what actually determines India's external position. The same month, the Reserve Bank of India's services trade data show exports of $38.25 billion against imports of $20.61 billion, a services surplus of roughly $17.65 billion, up 13.4 percent year on year on the export side alone. Put the two releases side by side and July's goods deficit was not $31.98 billion in isolation. It was $31.98 billion against a $17.65 billion services cushion sitting right next to it, covering 55 percent of the gap in a single month.
Services closed over half of July's goods deficit, in one month alone.
The quarter that shows the mechanism at work
The clearest picture of how this works comes from the RBI's quarterly balance-of-payments release, which reports the current account, not just the trade account. In Q1 2026-27, April to June 2026, India's current account deficit widened to $4.2 billion, or 0.5 percent of GDP, from $3.4 billion (0.4 percent of GDP) a year earlier. That $0.8 billion move looks almost flat. It happened while the merchandise trade deficit for the same quarter rose to $86.1 billion from $68.9 billion a year earlier, a jump of $17.2 billion.
A goods deficit that grew by $17.2 billion should, on its own, have pushed the current account deficit up by a similar amount. It did not, because net services receipts rose to $51.6 billion in the quarter from $47.9 billion a year earlier, and remittances rose to $42.9 billion from $33.2 billion, together absorbing $13.4 billion of the widening goods gap. A third, quieter line did more of the remaining work than the release's headline table shows: India's net outgo on the primary income account, mostly investment income payments owed abroad, narrowed to $10.5 billion in the quarter from $13.3 billion a year earlier, a $2.8 billion lighter drag than the year before. Add the three offsets together: $3.7 billion from services, $9.7 billion from remittances, and $2.8 billion from a narrower investment-income outgo. Together they cover $16.2 billion of the $17.2 billion increase in the goods deficit, against a current account deficit that actually widened by just $0.8 billion.
India's current account deficit barely moved. Its trade gaps did not.
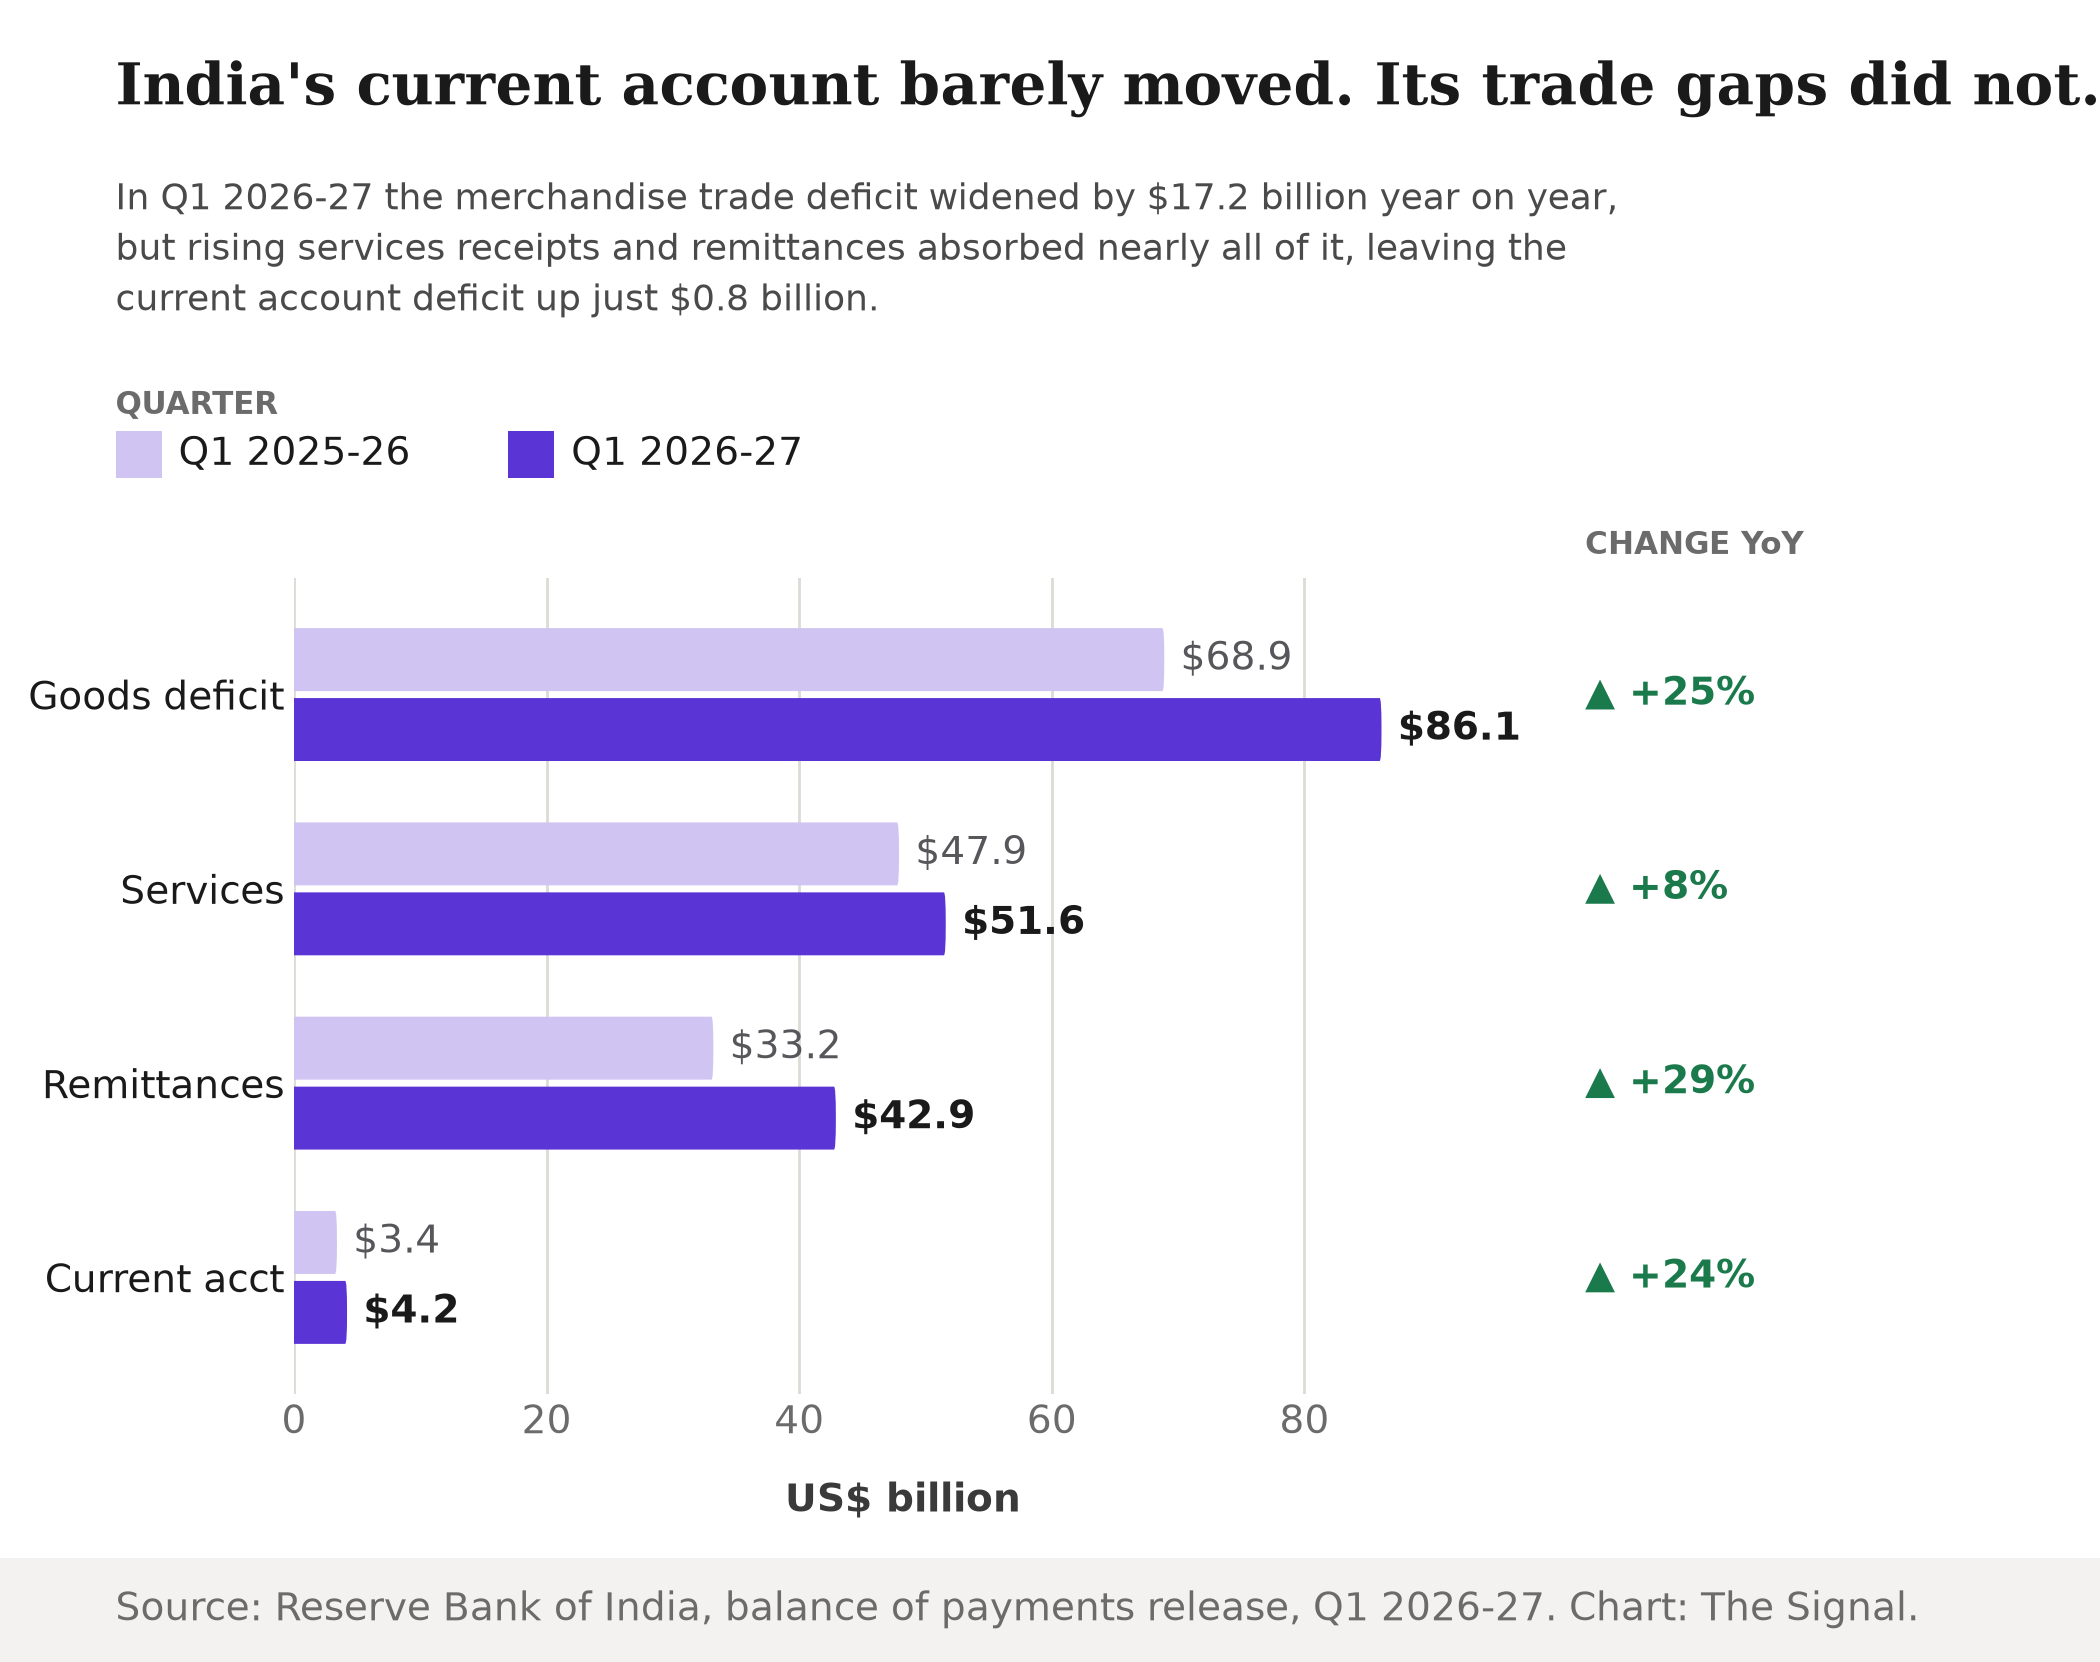
The RBI's release does not net these lines against each other into the current account figure for the reader, and a roughly $1 billion residual is left over even after services, remittances and the primary income account are added in, likely other current-transfer items the release's summary table does not itemize separately, plus rounding. What the numbers do show, using only the lines the release does report, is that services, remittances and a narrower investment-income outgo together were responsible for nearly all of why a much larger goods gap did not translate into a much larger current account deficit.
This is not a one-quarter fluke
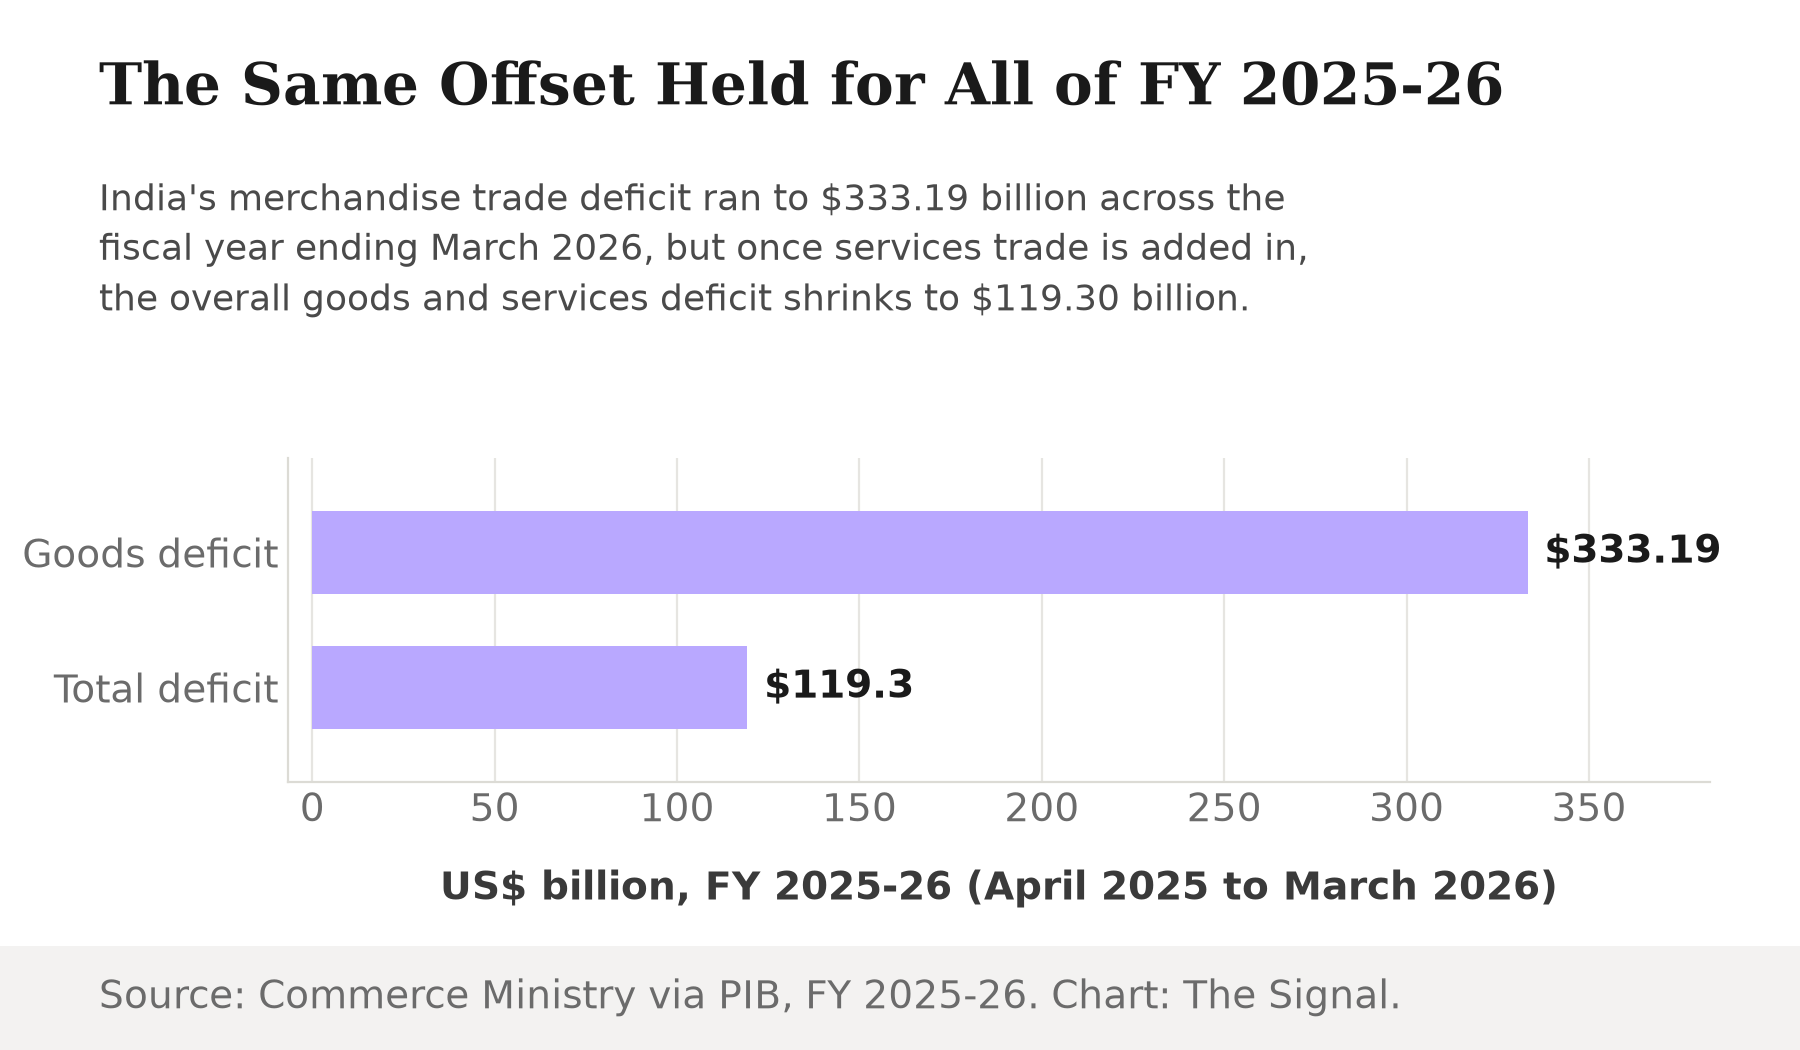
The same pattern held across the entire fiscal year that ended in March 2026. Over FY 2025-26, India's merchandise trade deficit ran to $333.19 billion, but the overall trade deficit including services was $119.30 billion, a gap that closes because services exports for the year reached $418.31 billion, nearly matching merchandise exports of $441.78 billion. India's services sector is exporting at close to the same scale as its factories and refineries combined, and that scale is what keeps the overall trade picture from looking as lopsided as the goods numbers alone suggest.
The same offset held for the full fiscal year, not just one quarter.
That consistency matters. A single strong month could be a fluke of shipment timing or a currency swing. A pattern that holds across a full fiscal year and then repeats in the following quarter is a structural feature of how India trades with the world, not a one-off.
The tariff backdrop this is playing out against
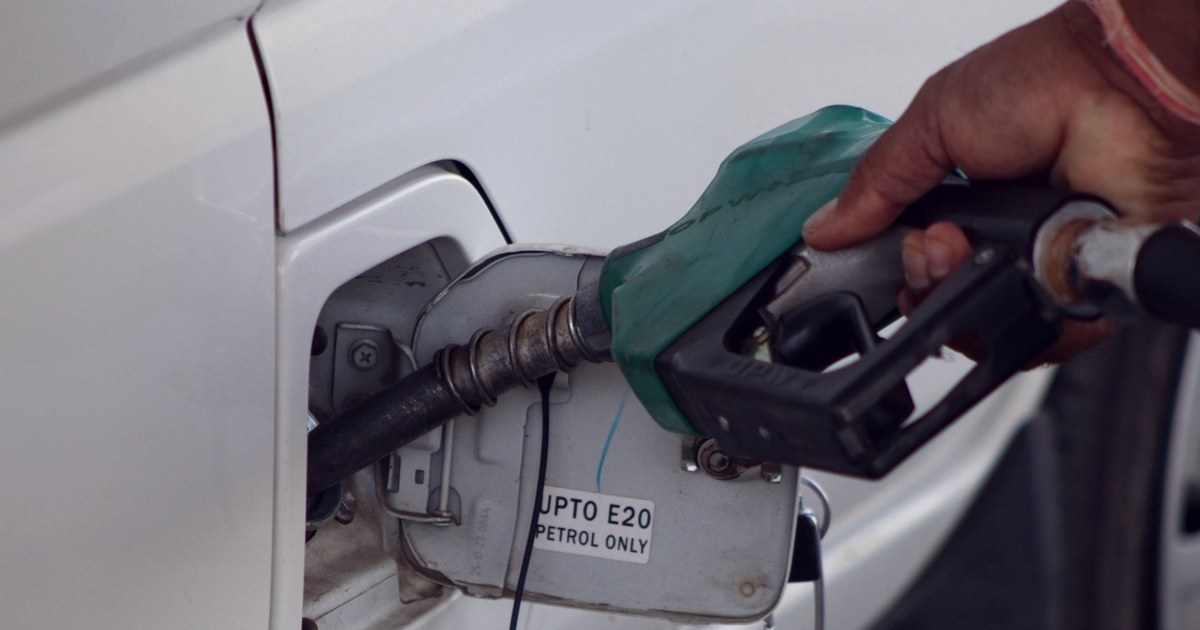
Any read of India's July merchandise numbers has to sit alongside the fact that trade friction with the United States, India's largest single export market, eased earlier this year. In February 2026, the United States lowered its reciprocal tariff on Indian goods from a combined 50 percent, a 25 percent reciprocal tariff plus a separate 25 percent penalty tied to Russian oil purchases, down to 18 percent, under a bilateral trade deal. That rollback removed a major overhang for Indian exporters heading into the second half of 2026. It does not, on its own, explain why July's merchandise deficit still widened both on the month and cumulatively for the fiscal year to date; a lower tariff on Indian goods sold into the US affects competitiveness on the export side of the ledger, not the import side where July's widening actually came from. Electronic goods imports rose 46 percent year-on-year to $14.37 billion in July, and crude oil imports rose 18 percent to $18.31 billion, per Commerce Ministry data, and together the two categories accounted for well over half of July's roughly $11.4 billion increase in total imports. Neither has much to do with the US tariff schedule: electronics demand reflects domestic consumption and supply-chain buildout, and crude oil is priced and shipped on global markets regardless of what Washington charges on Indian exports. Energy prices and domestic electronics demand widened July's import bill, not anything happening at the US border.
The honest objection
The strongest case against reading too much into the services offset is that it is not infinite, and the trend line on the goods side is not flattering. The cumulative merchandise deficit for April to July 2026-27 has already reached $118.60 billion, up from $96.66 billion in the same four months a year earlier, a widening of nearly $22 billion in just a third of a fiscal year. If the goods deficit keeps growing at that pace while services growth merely tracks its own recent rate, the arithmetic eventually stops working: a $17 billion-a-month services surplus cannot indefinitely outrun a goods deficit that is compounding faster than it is.
That case is real and worth watching. But it is an argument about a future risk, not about what has already happened. Every release in hand, July's monthly print, the Q1 balance of payments, and the full FY 2025-26 year, shows the same offset holding, not eroding. In each of these windows, the services surplus rose in step with the widening goods deficit.
The Signal
The headline trade number every month will keep being the merchandise deficit, because it is the bigger, more volatile figure and it moves the exchange-rate conversation. But it is not the number that determines how exposed India's external position actually is. That number is the current account deficit, and in the most recent quarter it moved by less than a billion dollars while the goods gap moved by more than seventeen. The mechanism behind that gap is not a mystery: services exports and remittances, both rising faster in percentage terms than the merchandise deficit itself, are doing the absorbing. Watch what happens if that relationship breaks, if the goods deficit keeps compounding at its current-year pace while services growth cools. Until then, the country running a record goods deficit and the country whose current account barely moved are, this year, the same country.
Reporting basis: India's July 2026 services trade figures are from the Reserve Bank of India's monthly release on international trade in services. July 2026 merchandise trade figures and the cumulative April-July 2026-27 deficit are from the Ministry of Commerce and Industry's monthly trade release, via the Press Information Bureau. The Q1 2026-27 current account deficit, merchandise trade deficit, net services receipts and remittances figures are all from the RBI's balance-of-payments release for that quarter. The Q1 2026-27 primary income account figures are as reported by The Tribune, citing that same RBI release. The FY 2025-26 annual services and merchandise export figures and trade deficits are from the Commerce Ministry's annual trade release, via PIB. The February 2026 US tariff reduction is per a White House fact sheet on the bilateral trade deal. July 2026 electronics and crude oil import figures are as reported by Tarun Bharat, citing Commerce Ministry data. The $17.2 billion and $0.8 billion year-on-year changes, the 55 percent July offset share, the $13.4 billion combined Q1 offset from services and remittances alone, the $16.2 billion combined Q1 offset from services, remittances and the narrower primary-income outgo, and the "well over half" of July's import growth from electronics and crude oil, are The Signal's calculations from those figures.