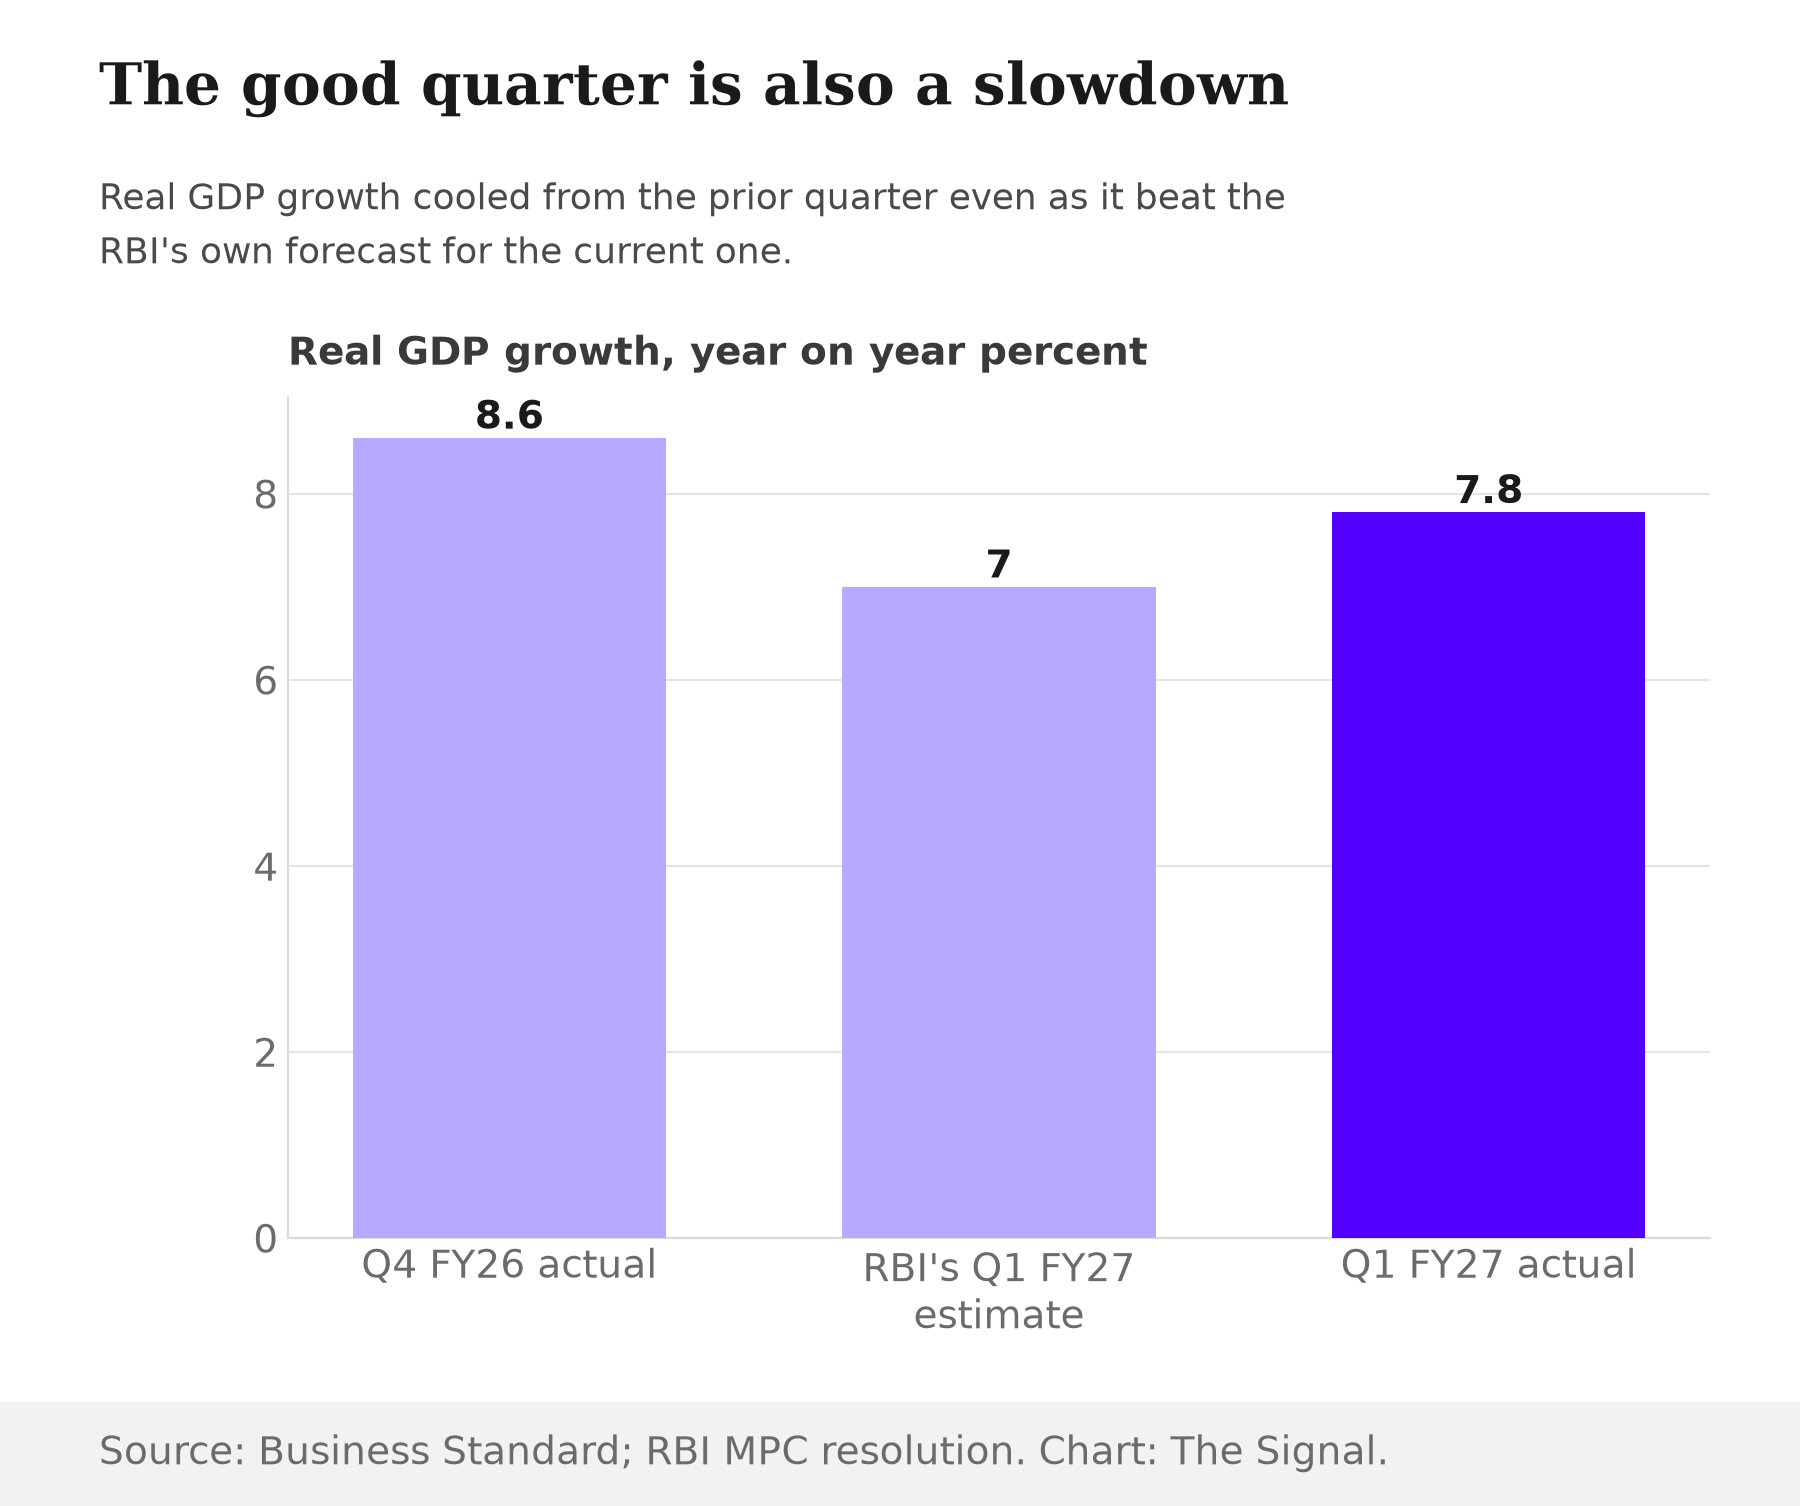
India's real GDP grew 7.8% year on year in the June quarter of FY27, from April to June 2026, Business Standard reported, citing National Statistics Office data. That number also cleared the Reserve Bank of India's own estimate for the quarter. The RBI's August 2026 Monetary Policy Committee resolution had projected the full FY27 year at 6.7%, with the June quarter specifically pegged at 7.0%: the actual print beat that estimate by 0.8 percentage points. Coming as attention returns to NITI Aayog's Vision for Viksit Bharat @2047, which sets India's target at a $30 trillion economy with per-capita income of $18,000 by 2047, the quarter has been read as evidence the country is broadly on pace.
It is worth slowing down on that read. The same National Statistics Office data that beat the RBI's forecast also showed growth decelerating, not accelerating: 7.8% in the June quarter followed 8.6% in the preceding March quarter of FY26. A quarter can beat a forecast and still be slower than the one before it. Beating a central bank's estimate is a different test from clearing a 21-year target, and it is the second test that Viksit Bharat actually has to pass.
The gap in per-capita terms
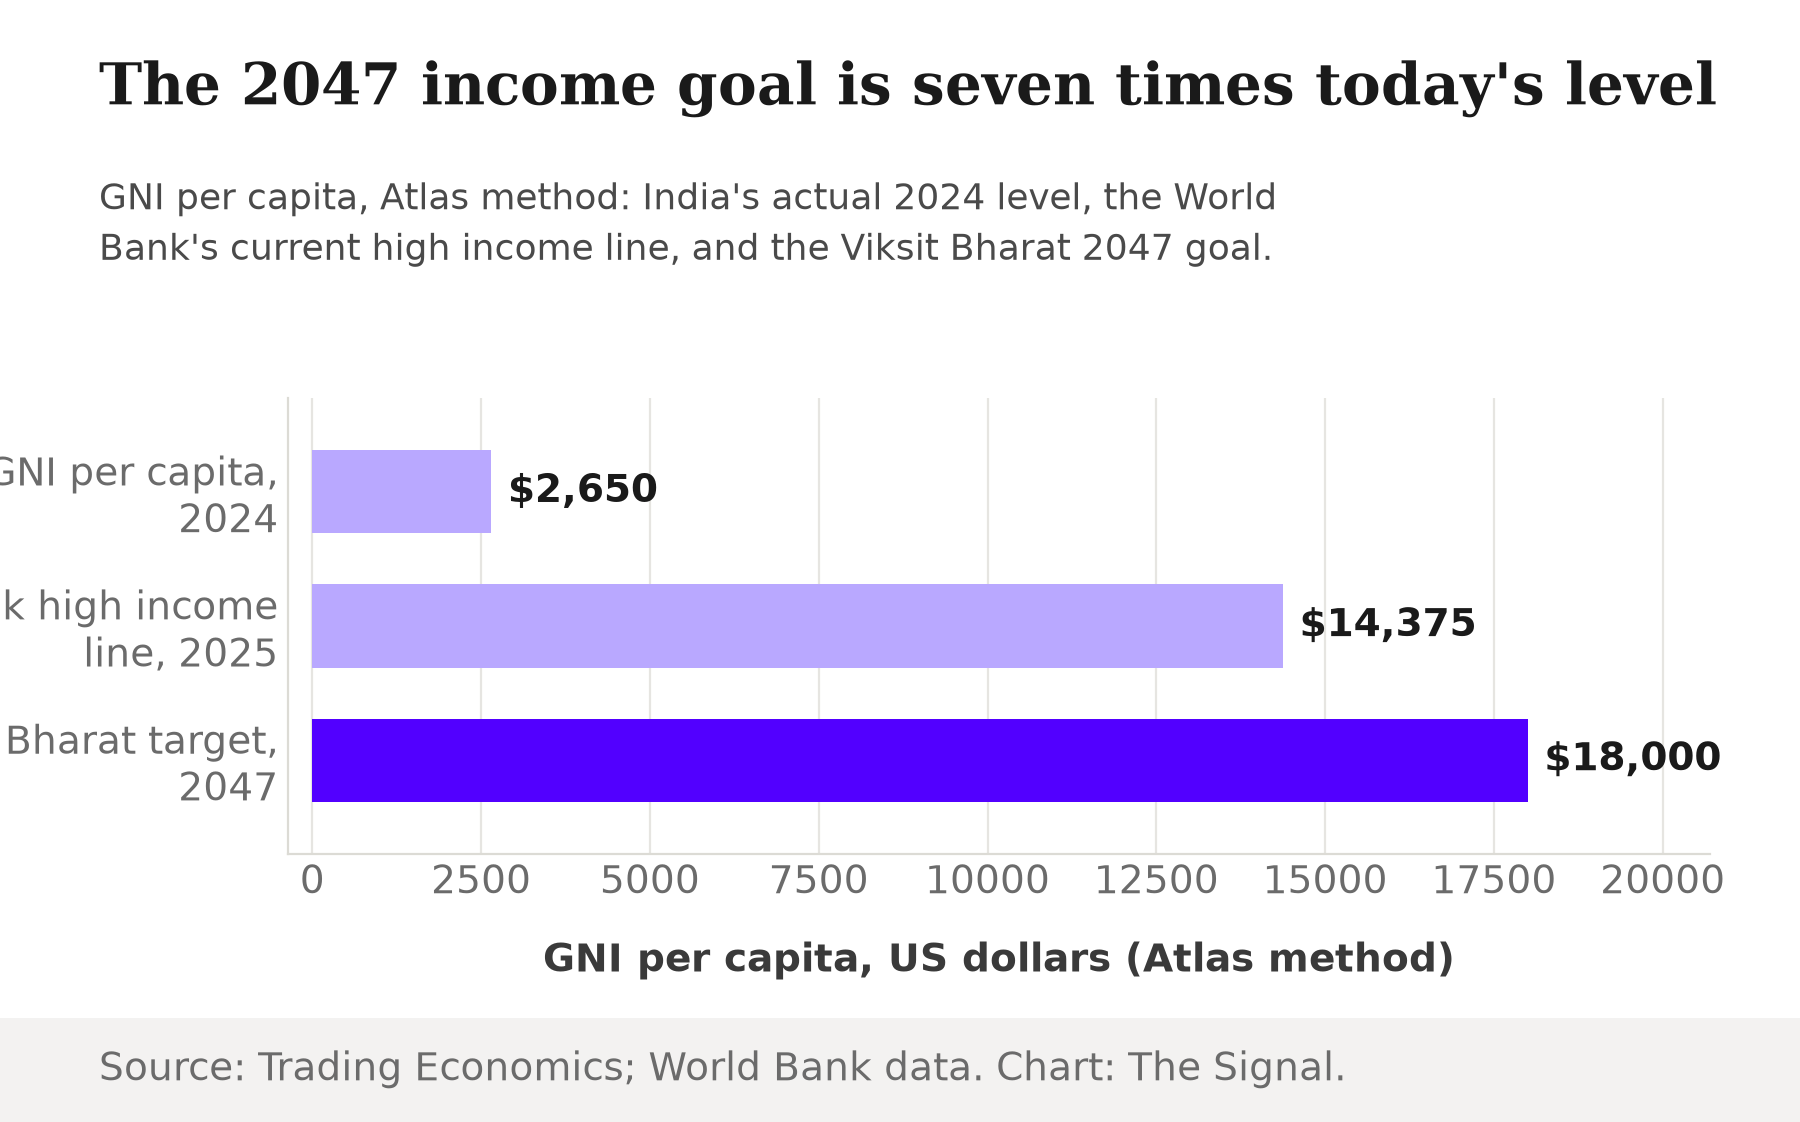
India's GNI per capita, on the World Bank's Atlas method, was $2,650 in 2024, Trading Economics reports, compiling World Bank development-indicator data, and the Viksit Bharat target of $18,000 per capita by 2047 is roughly 6.8 times that level. That target is not an arbitrary round number: it is built to clear the world's own line for a high-income economy. The World Bank's current threshold for a high-income economy is a GNI per capita above $14,375, based on 2025 data, so Viksit Bharat's $18,000 goal sits roughly 25% above that bar, not just at it.
What compounding that gap actually requires
Turning a 6.8-times gap into a plan means fixing a timeline. NITI Aayog's own approach paper says reaching the target needs sustained growth of 7 to 10% a year over the next 20 to 30 years, which reads like a wide, forgiving range. In dollar terms alone, the economy has to grow almost eightfold in size, from $3.956 trillion in 2025 to NITI Aayog's $30 trillion target.
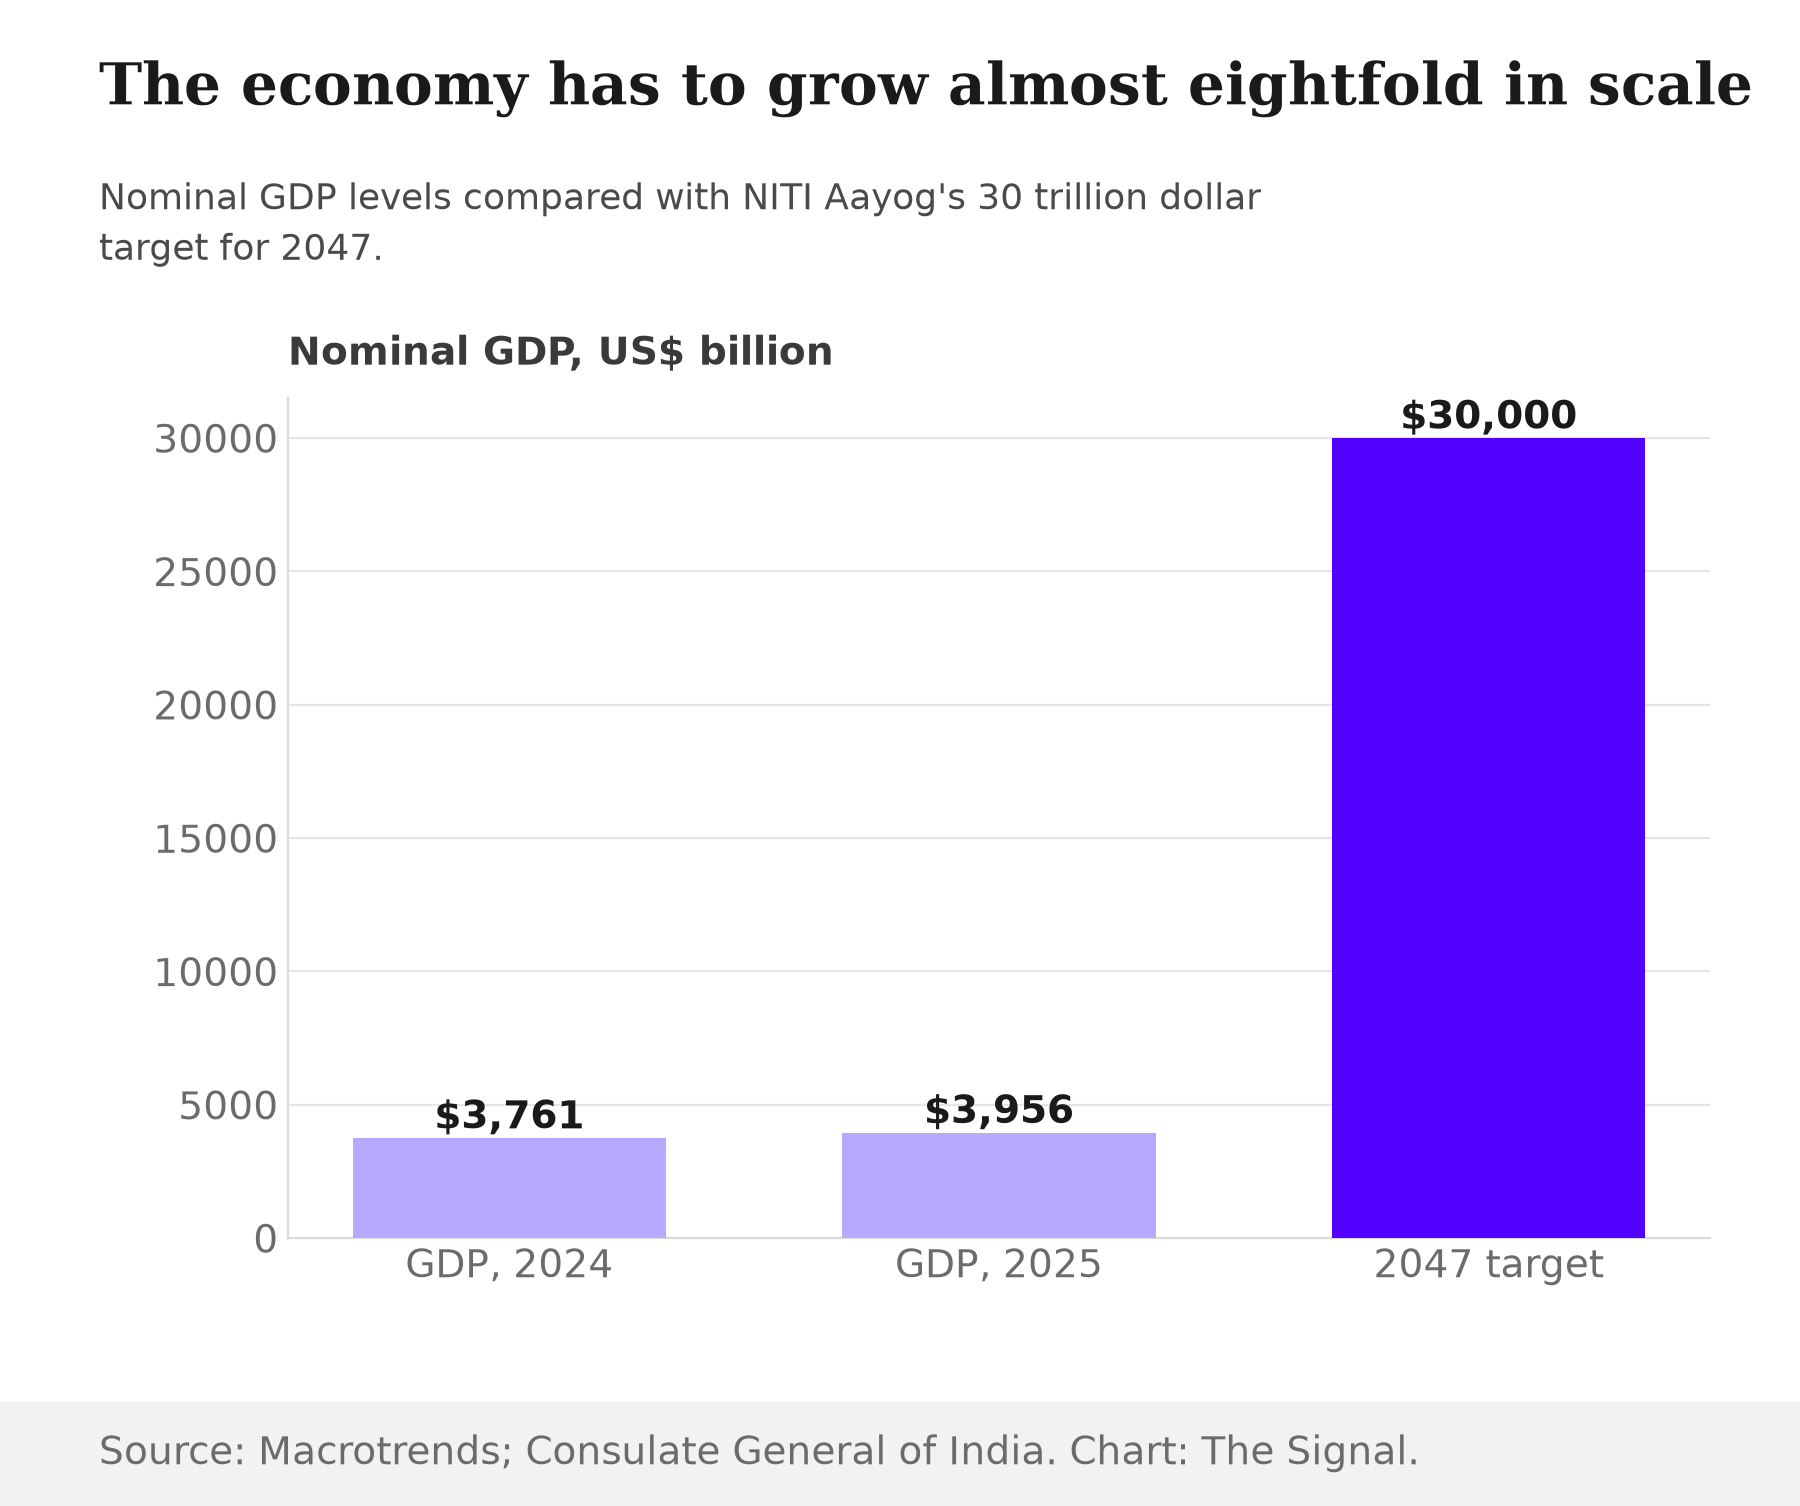
The arithmetic behind that jump is less forgiving than the 7-to-10% range suggests. Compounding $3.956 trillion into $30 trillion over the 22 years to 2047 needs real GDP growth averaging about 9.6% a year, our calculation from those two figures. Run the same test on income per person: compounding $2,650 in per-capita terms into $18,000 over the 23 years to 2047 needs about 8.7% a year; add back India's population growth of roughly 0.89% a year in 2024, since per-capita income typically grows slower than aggregate GDP by close to the population growth rate, and the two independent paths converge on nearly the same number, about 9.6%.
That is not the middle of NITI Aayog's own 7-to-10% band. It sits close to the top of it.
| Measure | Latest figure | 2047 target | Years remaining | Required annual growth |
|---|---|---|---|---|
| Nominal GDP | $3.956 trillion (2025) | $30 trillion | 22 | About 9.6%* |
| GNI per capita, Atlas method | $2,650 (2024) | $18,000 | 23 | About 8.7%* per person |
Figures: Macrotrends, compiling World Bank data; NITI Aayog's Vision for Viksit Bharat @2047, via the Consulate General of India, New York; Trading Economics, compiling World Bank data. Required growth rates are The Signal's calculations from those figures.
The historical base rate
That pace is rare by any standard. Since 1950, only 13 economies worldwide have sustained average GDP growth of 7% a year or more for 25 years or longer, a 2008 World Bank Commission on Growth and Development study found. The closest precedent among them is China: its GDP growth has averaged more than 9% a year for the roughly 46 years since 1978, when its reform and opening-up era began, according to the World Bank. That pace is nearer the 9.6% India's target needs than any economy on record has managed, but still short of it, and sustained for more than double the 21 years India has left. India's own recent record sits well short of even that: its economy grew at an average of just 6.1% a year over the most recent completed decade, FY2015-16 through FY2024-25, Reserve Bank of India Governor Sanjay Malhotra said in April 2026, citing National Statistical Office data. India's Q1 FY27 print of 7.8% would, on its own, sit just inside the 13-economy club's 7% threshold. The 9.6% pace the 2047 target actually needs is a full two percentage points above even that historic floor, and it has to be sustained for 21 more years, not the 25 that already qualified those 13 economies. Only China has come close to that bar, and India's own last decade fell 3.5 points short of it.
The honest objection
The strongest pushback is that a straight-line compounding rate undersells what a large, catching-up economy can do once conditions align. Q1 FY27's actual 7.8% print already beat the RBI's own 7.0% estimate for the quarter by 0.8 percentage points, showing growth can run meaningfully ahead of the central bank's own model when trade and investment cooperate. If India could repeat that scale of outperformance against the RBI's baseline path across most of the next two decades, the aggregate could plausibly approach the pace Viksit Bharat needs.
That case is real, but it is close to the bet the historical record warns against. The 13 economies that sustained even the lower, 7% bound for 25 years since 1950 did not do it by beating their own central bank's forecast quarter after quarter; they simply grew fast, on average, for a long time, without needing to run almost two points above that already-rare floor. Needing sustained outperformance above trend, not just one good quarter above a forecast, is a materially higher bar than 7.8% demonstrates.
The Signal
The 7.8% print is a genuinely good number: it beat the RBI's own estimate, and a weaker quarter would have been a real setback for both growth and confidence. But a good quarter and an on-track 21-year target are different claims, and treating one as proof of the other is the easier, more comfortable story to tell. Viksit Bharat's own paper puts the required pace at 7 to 10% a year; the arithmetic behind its own $30 trillion and $18,000 numbers pins the actual requirement near the top of that band, not the middle, and above every quarter India has posted in this data. Watch what comes next, not what already came. If growth accelerates from here rather than merely beating a lowered forecast, the target stays alive. The 2047 goal will need revising long before the calendar forces the question if 7.8% turns out to be closer to a ceiling than a floor.
Reporting basis: the Q1 FY27 and Q4 FY26 GDP growth figures are from the National Statistics Office, as reported by Business Standard; the RBI's growth projections are from its own August 2026 Monetary Policy Committee resolution. The Viksit Bharat @2047 target figures are from NITI Aayog's approach paper, as summarised in the Consulate General of India, New York's business newsletter. The World Bank's high-income threshold is from its Data Help Desk; India's GNI per capita and population growth rate are Trading Economics' compilations of World Bank development indicators, including its population series; India's GDP levels for 2024 and 2025 are from Macrotrends' compilation of World Bank data. The historical base rate is from a 2008 World Bank Commission on Growth and Development study of economies since 1950; China's post-1978 growth average is from the World Bank's country overview of China. India's own decadal growth average is from RBI Governor Sanjay Malhotra's April 2026 speech, published by the Bank for International Settlements, citing National Statistical Office data. The required compound annual growth rates, the per-capita and GDP multiples, and the comparison against that historical base rate are The Signal's calculations from those figures.