Every state government in India is chasing the same trophy right now: an electronics cluster, an auto-component park, a semiconductor line, anything that signals a claim on the country's manufacturing future. The federal government's Production Linked Incentive schemes sit at the center of that pitch, and the headline numbers are large. The PLI schemes across 14 sectors have drawn cumulative investment of more than Rs 2.16 lakh crore, generated production and sales of over Rs 20.41 lakh crore, and created more than 14.39 lakh jobs as of 31 December 2025. Read only that line and the story writes itself: India is industrializing, state by state, and the incentives are working.
It is worth slowing down on that. The ministry running the scheme states plainly that it does not centrally maintain a state-wise breakdown of that investment. Nobody, including the government paying for it, can point to a map and say where the Rs 2.16 lakh crore actually landed. And in the state that built more of India's industrial base than almost any other, the direction of travel already looks like the opposite of a boom. Manufacturing made up 21.5% of Maharashtra's nominal Gross State Value Added in 2011-12; by 2023-24 that had fallen to 14.5%, and the broader industry aggregate of mining, manufacturing, utilities and construction slid from 35.8% to 25.0% of the state economy over the same period. That is a fall of nearly a third in manufacturing's own weight inside the state that industrialized India first.
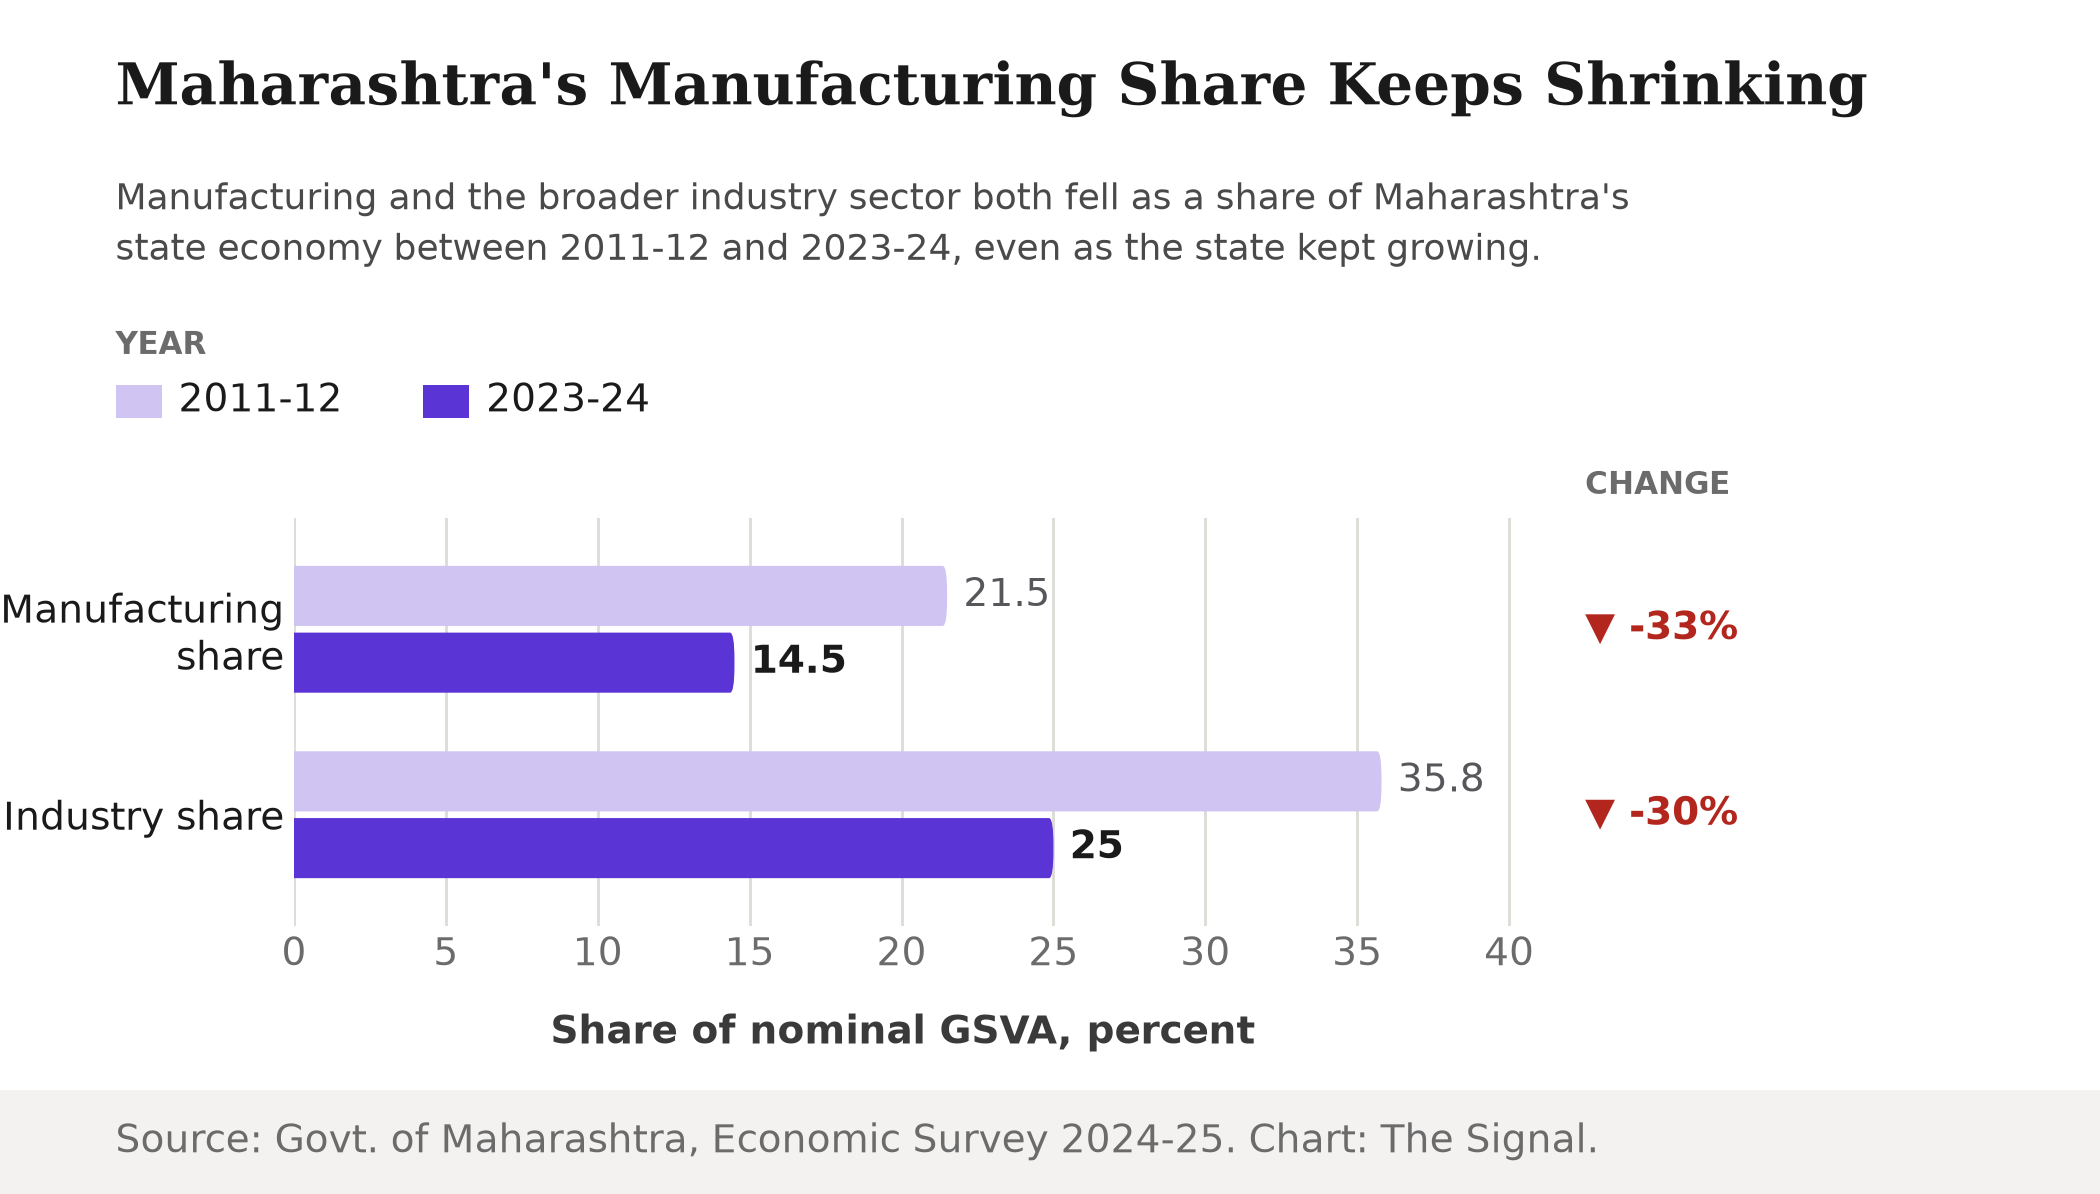
Source: Maharashtra Economic Survey 2024-25. Chart: The Signal.
Shrinking Share, Not Shrinking Output
This is not a story of a factory floor going empty. In real, inflation-adjusted terms, Maharashtra's manufacturing output still grew, from Rs 2.46 lakh crore to Rs 3.79 lakh crore between 2011-12 and 2023-24, a rise of 54%, while the state's total real economy grew 88% over the same period. Manufacturing kept expanding in absolute terms; it simply could not keep pace with everything else Maharashtra was building around it, finance, real estate, IT services, retail. Spread evenly across the twelve years, that 54% rise works out to manufacturing growing about 3.7% a year in real terms, our calculation from the state's own figures, a pace closer to background economic drift than to an industrial engine.
The States Where Manufacturing Is Not Falling Behind
Maharashtra's pattern is not India's pattern. In Gujarat, manufacturing was the fastest-growing of the state's major sectors between 2013-14 and 2022-23, expanding 8.8% a year in real terms, ahead of services at 6.9% and agriculture at 6.3%. Tamil Nadu shows a milder version of the same order: manufacturing grew 6.9% a year over the same nine years, a touch ahead of services at 5.8% and roughly level with agriculture at 6.6%. In both states, manufacturing is not the sector losing ground to services. It is close to leading the pack.
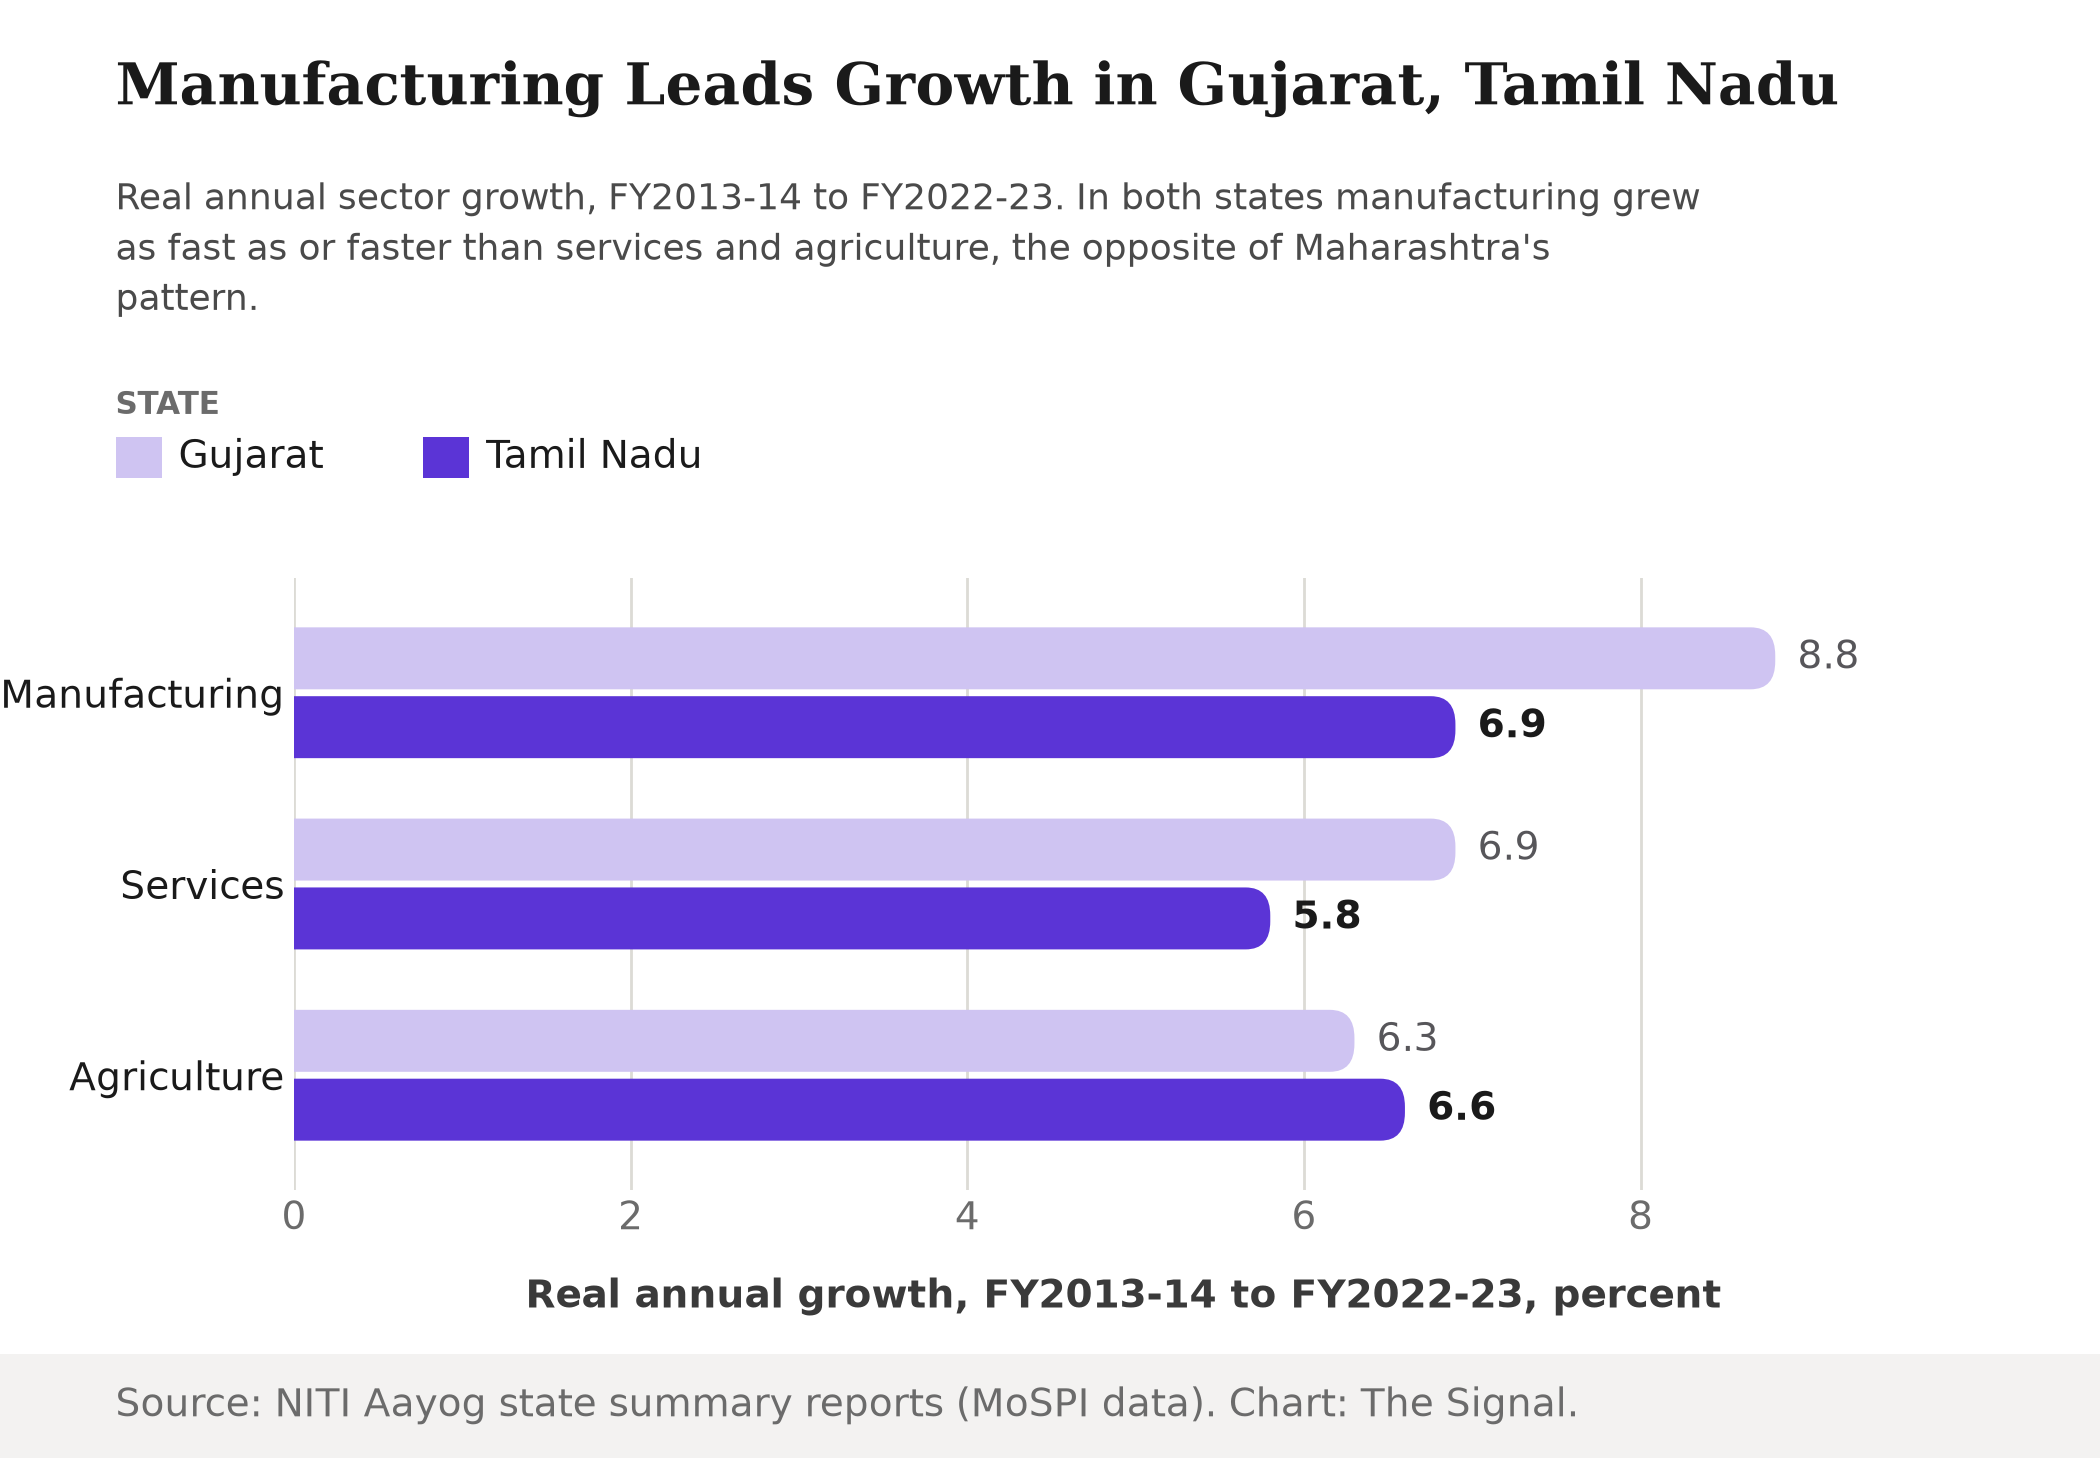
Source: NITI Aayog state economic summary reports, Gujarat and Tamil Nadu. Chart: The Signal.
The periods do not line up exactly. Maharashtra's figures run 2011-12 through 2023-24, twelve years; Gujarat's and Tamil Nadu's run 2013-14 through 2022-23, nine years, as NITI Aayog reports them. But a roughly 3.7% pace against 8.8% and 6.9% is too wide a gap to be an artifact of two extra years on either end of the window. Something structural is pulling manufacturing toward Gujarat and Tamil Nadu, and away from the state that used to be synonymous with Indian industry.
The National Number Agrees With Maharashtra
Zoom out and the national data reads closer to Maharashtra's experience than to Gujarat's or Tamil Nadu's. Manufacturing's share of India's nominal Gross Value Added slipped from 14.3% in FY2022-23 to 13.9% in FY2024-25, and manufacturing's real GVA growth of 4.5% in FY2024-25 was the slowest of the three components that make up the secondary sector, trailing construction's 9.4% and electricity and utilities' 5.9%.
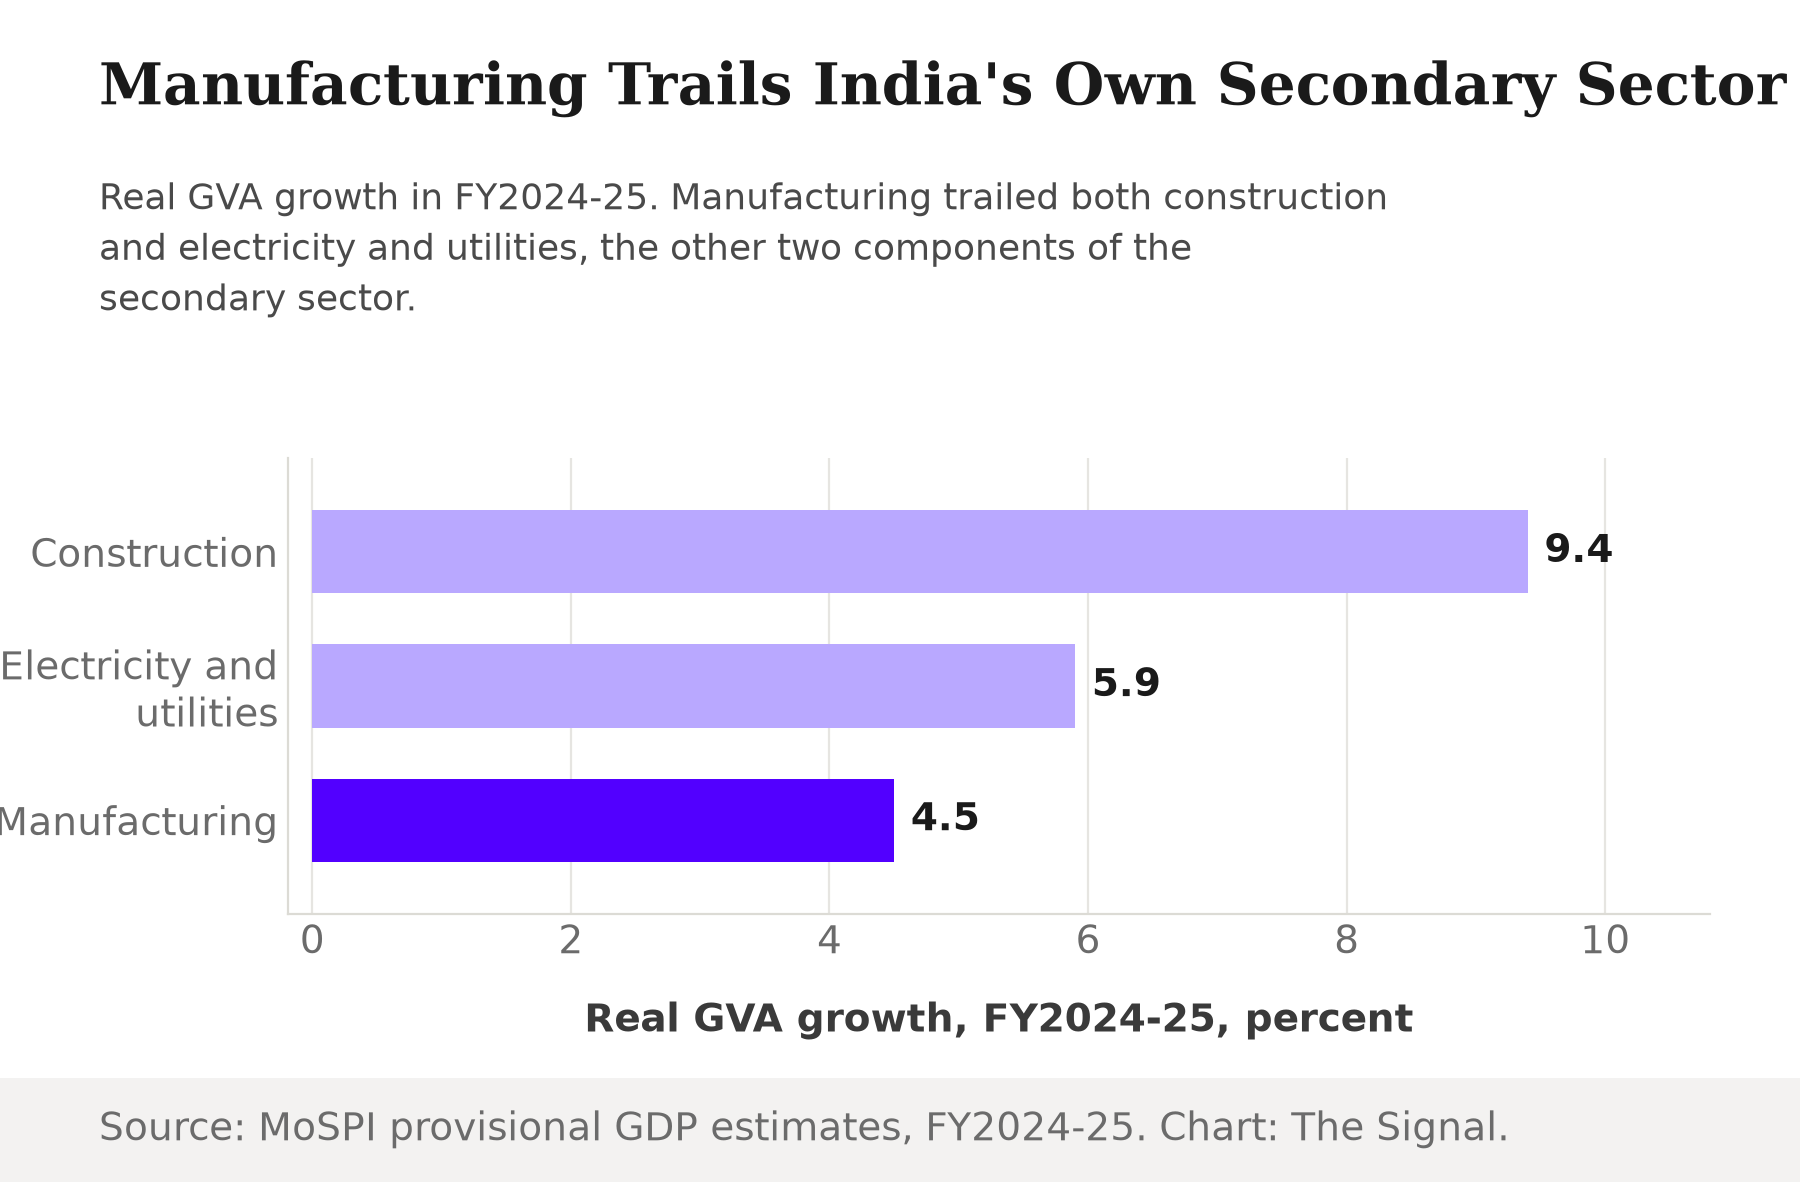
Source: MoSPI provisional GDP estimates, FY2024-25. Chart: The Signal.
That is an uncomfortable pairing with the PLI pitch. The scheme exists to pull manufacturing's weight in the economy up. The national accounts, for the year just reported, still show it drifting down.
Incentives Without a Map
Even inside the PLI numbers, the picture is lopsided rather than broad-based. Under the electronics sector, about Rs 15,554 crore of incentives have been disbursed; under automobiles and auto components, about Rs 2,377.56 crore, roughly a sixth as much, with cumulative PLI-linked exports of over Rs 8.3 lakh crore as of December 2025. Whatever capacity the scheme is building, it is concentrated in a handful of the 14 sectors it covers, not spread evenly across them, and there is no public record of which states are hosting that concentration.
The PLI scheme's own numbers, cumulative as of 31 December 2025
| Metric | Value |
|---|---|
| Investment | Rs 2.16 lakh crore |
| Production and sales | Rs 20.41 lakh crore |
| Employment generated | 14.39 lakh people |
| Exports | Rs 8.3 lakh crore |
| Electronics sector incentives disbursed | Rs 15,554 crore |
| Automobiles and auto components incentives disbursed | Rs 2,377.56 crore |
Source: Ministry of Commerce and Industry, via Press Information Bureau releases.
The honest objection
The strongest case against reading any of this as manufacturing losing ground is that national and Maharashtra-specific averages can hide a real reallocation already under way. The two sectors receiving the most PLI incentive money, electronics and autos, are heavily concentrated in exactly the states where the state-level data shows manufacturing accelerating: Gujarat's chemicals and auto corridor, Tamil Nadu's electronics and auto clusters. On this reading, the national share slip and Maharashtra's decline are simply the mirror image of Gujarat's and Tamil Nadu's gain, a redistribution the aggregate numbers cannot show and the state numbers already do.
That case is plausible, and the direction fits the state data cited here. But it stops at plausible. The government itself states there is no centrally maintained state-wise breakdown of PLI investment, so the claim that PLI money specifically explains Gujarat's and Tamil Nadu's faster manufacturing growth, rather than older industrial infrastructure, cheaper power, or port access, cannot be checked against the same evidence used to make it. A scheme that cannot show its own geography is not proof of where the shift is happening. It is only consistent with it.
The Signal
Manufacturing is not vanishing from India's economy. It is moving, both across sectors within states and across states, and the country's flagship manufacturing incentive program cannot yet show which of those moves it is actually funding. Maharashtra's twelve-year retreat and Gujarat's and Tamil Nadu's faster manufacturing growth are not two separate stories; they are the same reallocation, seen from opposite ends. What to watch next is not whether the PLI headline numbers keep growing, they will, but whether the ministry running the scheme ever publishes the state-wise table that would let anyone outside government test the story it is currently allowed to tell on faith.
Reporting basis: Maharashtra's Gross State Value Added figures, both nominal and at constant 2011-12 prices, are from the state's Directorate of Economics and Statistics, as published in the Economic Survey 2024-25. Gujarat's and Tamil Nadu's sector growth rates are from NITI Aayog's state economic summary reports, which compile Ministry of Statistics and Programme Implementation data. National GVA figures are from the National Statistics Office's provisional estimates for FY2024-25. The Production Linked Incentive figures, both the aggregate scheme totals and the sector-wise disbursement numbers, are from two Ministry of Commerce and Industry press releases via the Press Information Bureau. Maharashtra's annualized manufacturing growth rate is The Signal's calculation from those figures.