NOAA's Climate Prediction Center now gives a "very strong" El Nino greater than 90% odds of persisting through the Northern Hemisphere fall and winter of 2026-27, with a 69% chance that the October-December 2026 season alone produces a historic event exceeding every El Nino on record back to 1950. India's own forecasters have already priced a version of that risk into the 2026 monsoon. The India Meteorological Department's updated Southwest Monsoon 2026 forecast put seasonal June-September rainfall at 90% of the Long Period Average as ENSO conditions shifted toward El Nino. The World Meteorological Organization's July update forecasts below-normal rainfall as more likely across the Indian subcontinent as the event strengthens rapidly toward a peak expected between November 2026 and February 2027. Read only that far, and the story is the one India tells almost every El Nino year: a weaker monsoon, a hit to the kharif crop sown in June and harvested in autumn, a bad news cycle that fades by winter.
It is worth slowing down on that read. What makes an El Nino costly to India is not really its peak strength. It is its clock. A typical event crests by early winter and has decayed well before the rabi season, the wheat and other winter crops sown after the monsoon and harvested in spring, ever feels it. For 2026-27, what matters is not the forecast's headline strength, but whether it is still running strong when rabi wheat needs it not to be.
The number that separates a one-season shock from a two-season one
Source: NOAA Climate Prediction Center, Oceanic Nino Index (ONI v6). Chart: The Signal.
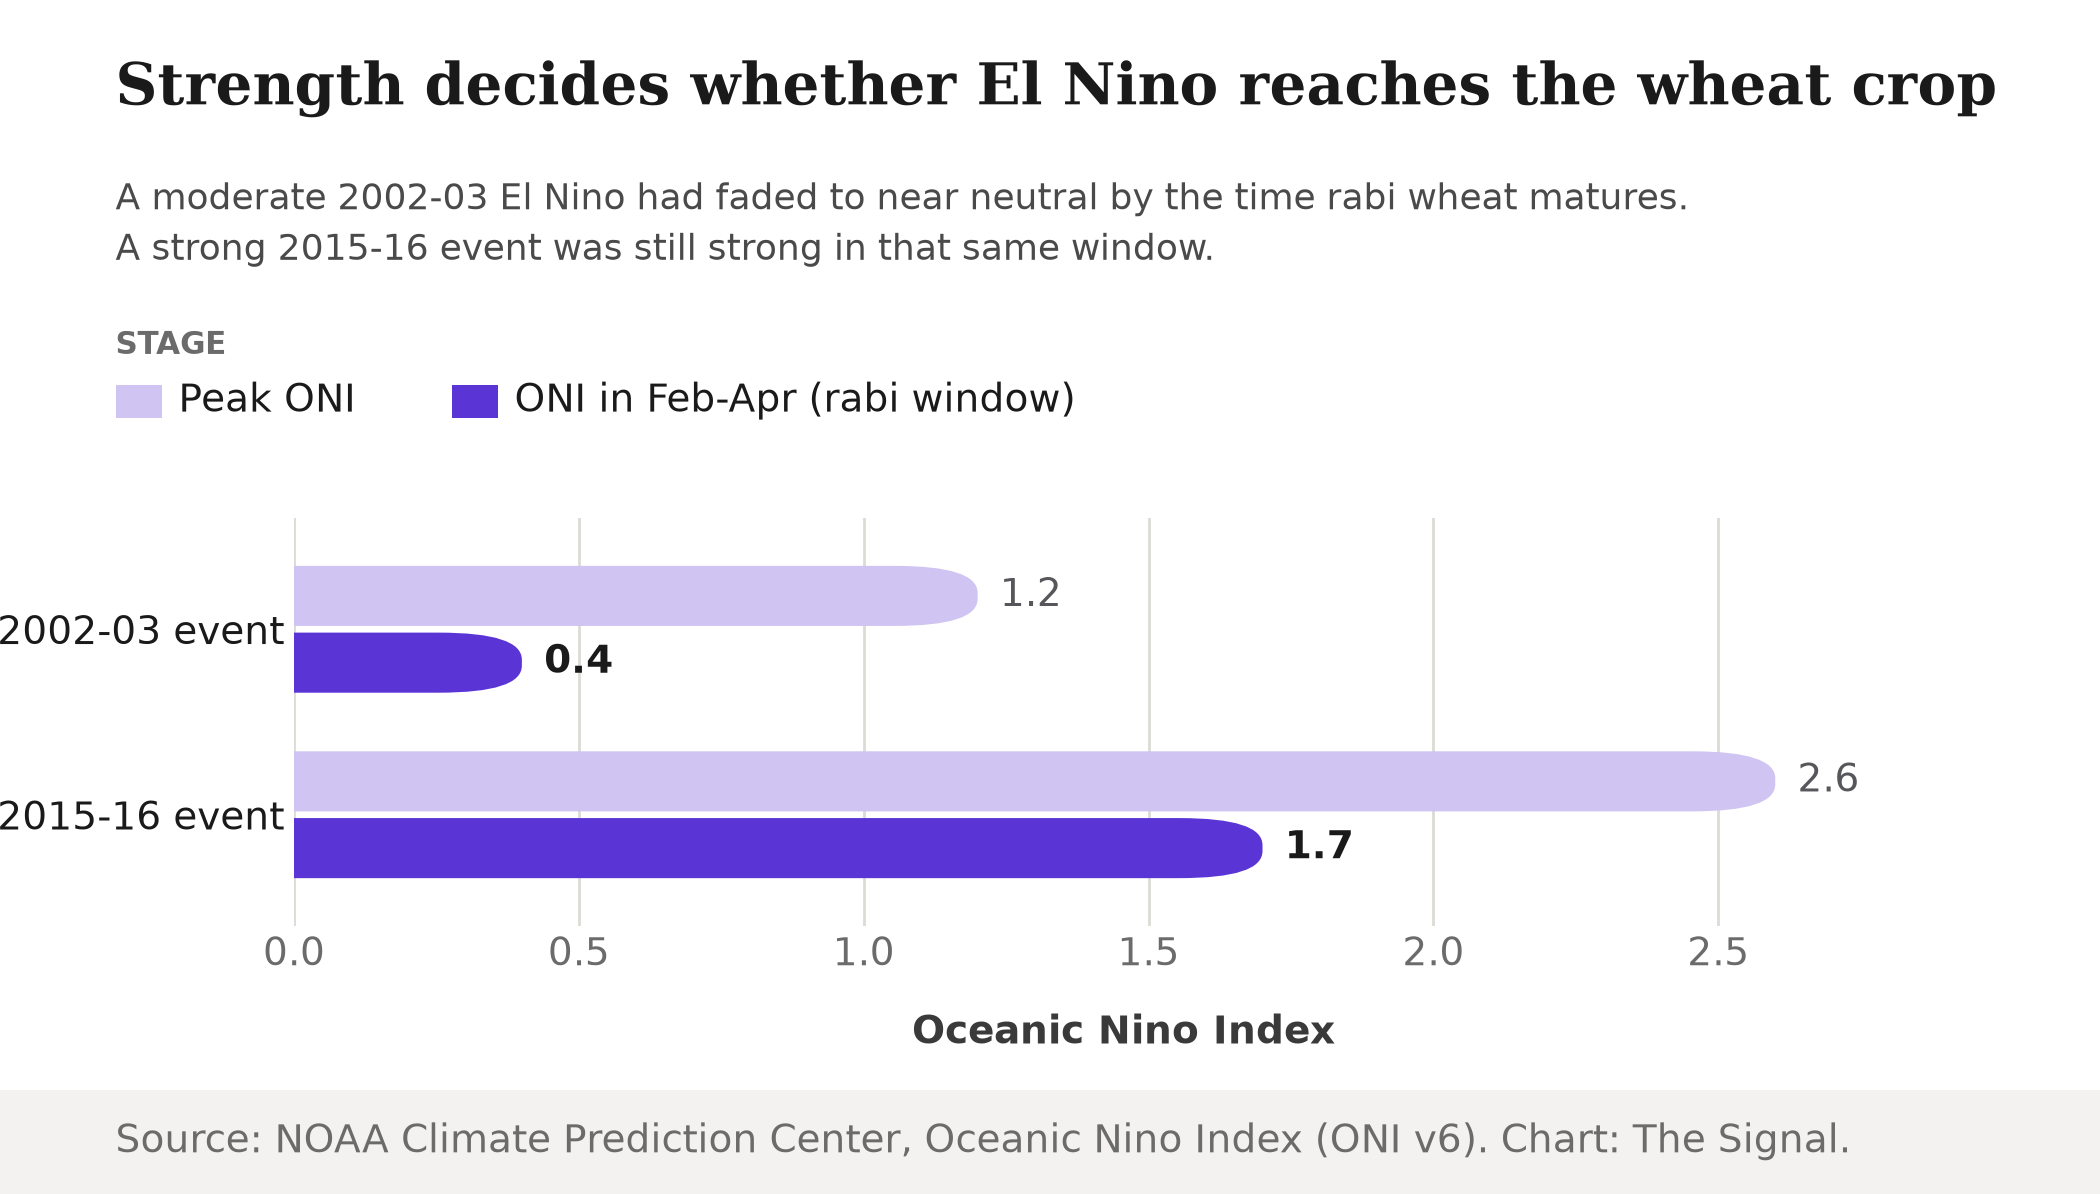
That is the whole difference in one comparison. A moderate event can spend itself on the monsoon and be gone before wheat is even sown. Strength changes that: an event still running months later can keep pressing on the crop right through the window that decides the size of the grain.
Why the growing season, not the rain gauge, is the risk to wheat
The mechanism runs through temperature more than rainfall. Rabi wheat fills its grain in February and March; run those months warmer than normal and yield drops before a single ear is threshed. A 2023 review in Frontiers in Plant Science, citing Gibson and Paulsen's original research, found wheat productivity falls 3 to 5% for every 1 degree Celsius rise in temperature during this period. A monsoon-season El Nino has typically already exited the calendar by February, so this mechanism never engages. A persistent one has not exited, and the ONI numbers above show what "persistent" looked like the one time this decade it actually happened.
What the last double-hit year cost
Source: MOSPI, First Revised Estimates of National Income. Chart: The Signal.
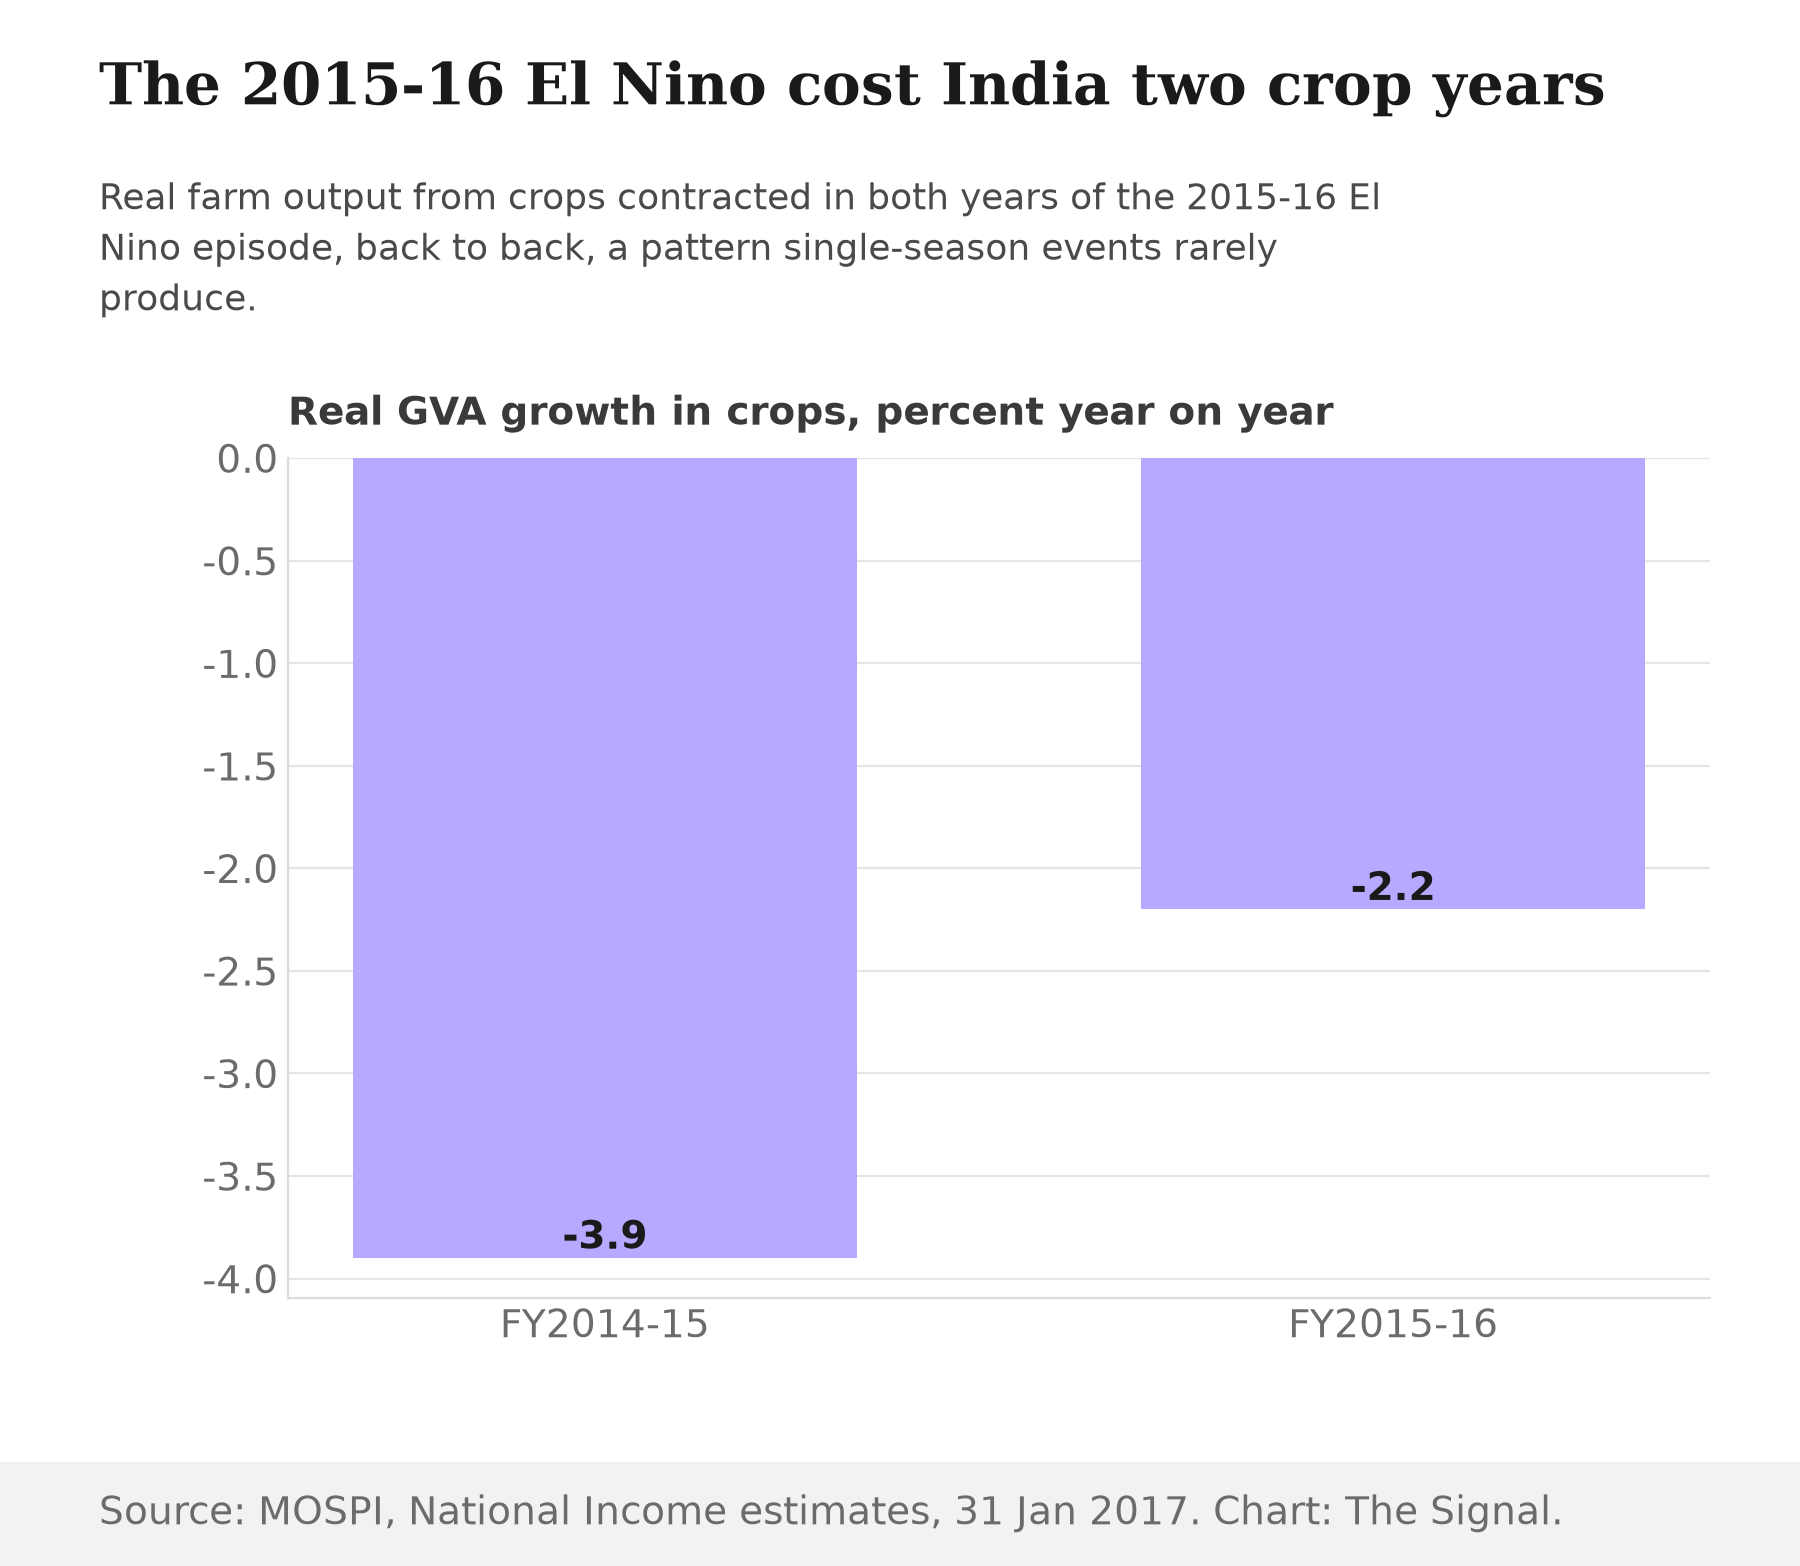
Two straight years of contracting crop output is not the signature of a single bad monsoon: a lone weak kharif year typically dents one year's number and the next year recovers. Back-to-back declines point to both harvests missing at once. As India emerged from those two years, MOSPI's Consumer Price Index release put food inflation, the Consumer Food Price Index for Combined India, at 6.32% year-on-year in April 2016, the bill a double-hit year left sitting in grocery prices.
The honest objection
The strongest case against reading 2026-27 as a repeat of 2015-16 is that a strong forecast is not the same as a strong outcome. NOAA's own record shows even the 2002-03 event, which peaked at a real if moderate 1.2 on the ONI, had decayed to near neutral within about four months of that peak. El Nino forecasts issued in August routinely overstate how strong an event looks by the following February, and this one could weaken the same way well before rabi wheat needs it to. A single strong season, however dramatic the August headline, does not by itself guarantee a second.
That case would be more comfortable if the 2026-27 forecast were merely strong. It is not. NOAA puts the chance of a very strong event persisting through the 2026-27 winter above 90%, and assigns a 69% probability that the October-December 2026 season alone exceeds every El Nino since 1950 for its own three-month window, a magnitude that starts this event far closer to 2015-16's peak of 2.6 than to 2002-03's 1.2. Starting higher does not guarantee staying strong into February. But the only two data points India has of this since 1950 run the same direction: the event that started stronger is the one that was still strong when it mattered for wheat.
The Signal
The number to watch in the 2026-27 rabi season is not the monsoon deficit everyone is already pricing in. IMD's own forecast already put 2026 monsoon rainfall at 90% of the Long Period Average, and that figure has been on the table since May. What is not yet priced is whether the same event is still delivering a warm, dry winter when wheat is filling grain in February and March 2027. If NOAA's monthly ENSO updates through the winter keep flagging an event still running strong into that window, 2026-27 risks becoming India's second double-hit El Nino in a decade, with a comparable two-year drag on crop output and a comparable lift to food inflation. Should the index instead fade the way 2002-03's did, rabi wheat comes through largely unscathed, and only the monsoon story was ever real. Either way, the index worth checking between now and March is not this month's forecast. It is next February's.
Reporting basis: the El Nino strength and persistence forecasts are from NOAA's Climate Prediction Center's ENSO Diagnostic Discussion of 13 August 2026, with corroborating outlooks from the World Meteorological Organization and, for the domestic monsoon, the India Meteorological Department via the Press Information Bureau. The historical comparison of the 2002-03 and 2015-16 El Nino episodes is from NOAA's own Oceanic Nino Index dataset. India's crop output and food inflation figures for the 2015-16 episode are from the Ministry of Statistics and Programme Implementation's National Income and Consumer Price Index releases. The wheat temperature sensitivity finding is from a 2023 peer-reviewed review in Frontiers in Plant Science. The characterisation of two consecutive years of crop contraction as a double-season signature, rather than a single-season one, is The Signal's own reading of those MOSPI figures.