India's factories had a strong May. The Index of Industrial Production grew 5.1% year on year in May 2026, MoSPI's Quick Estimates release shows, and read as a single number it looks like an industrial economy finding its footing across the board.
It is worth slowing down on that reading.
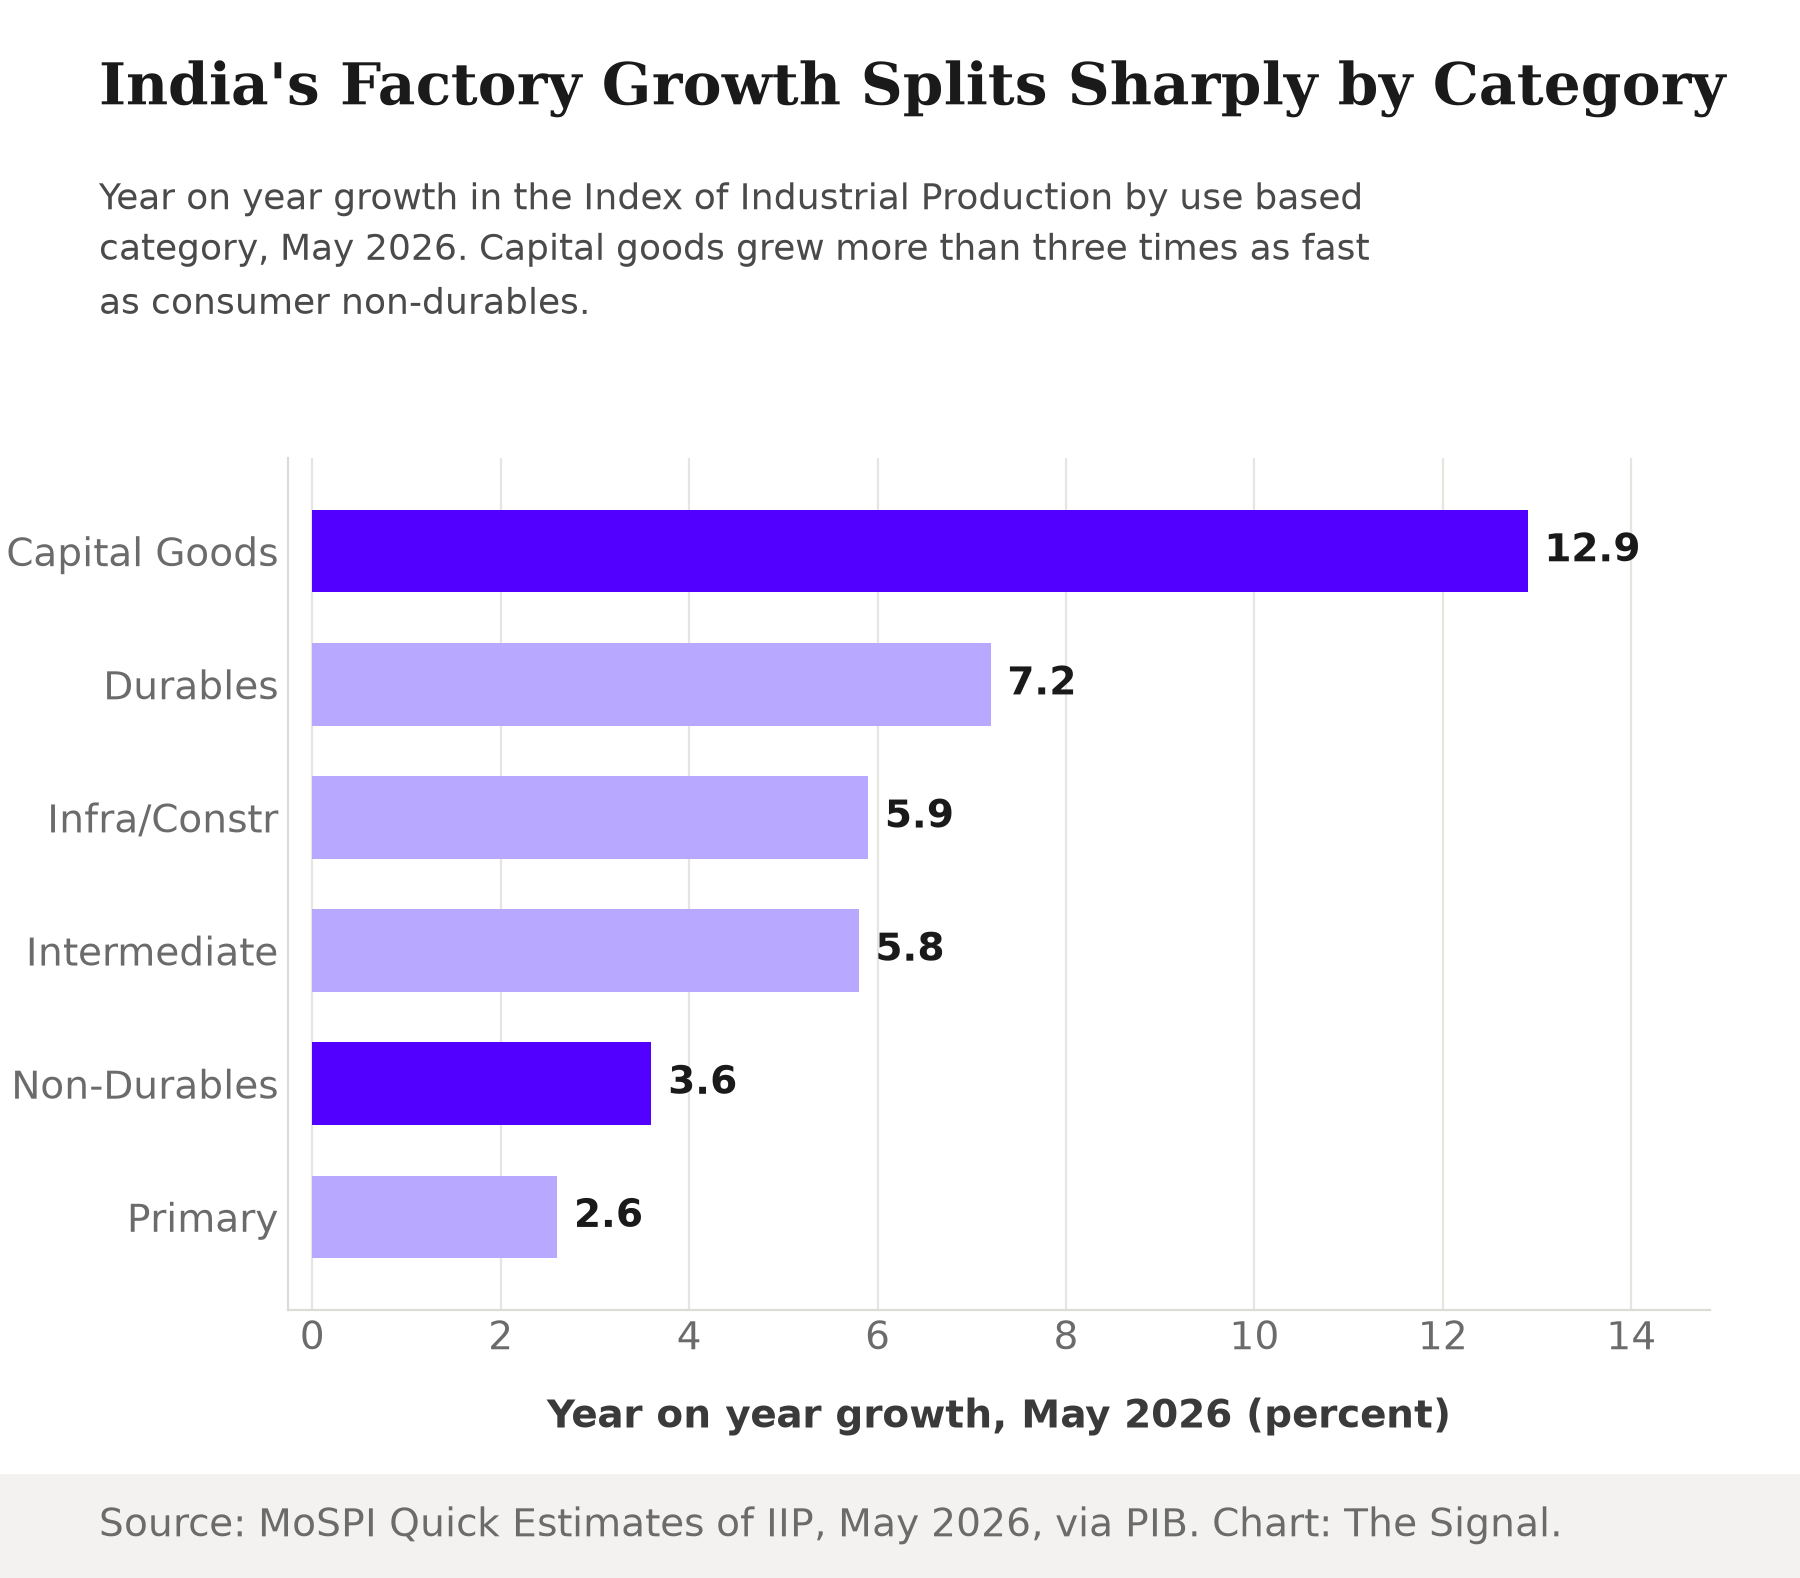
MoSPI's breakdown by use-based category tells a much less even story: Capital Goods output rose 12.9% year on year in May 2026, while Consumer Non-durables output grew just 3.6%, more than three times as slow. Only Primary Goods, up 2.6%, grew slower, making Consumer Non-durables the second-weakest of the six categories tracked. Consumer Durables output did better, up 7.2% in the same release. Factories building machines, plant and equipment are running well ahead of factories making the soap, packaged food and everyday goods that actually fill a shopping basket.
A budget built to keep the machines running
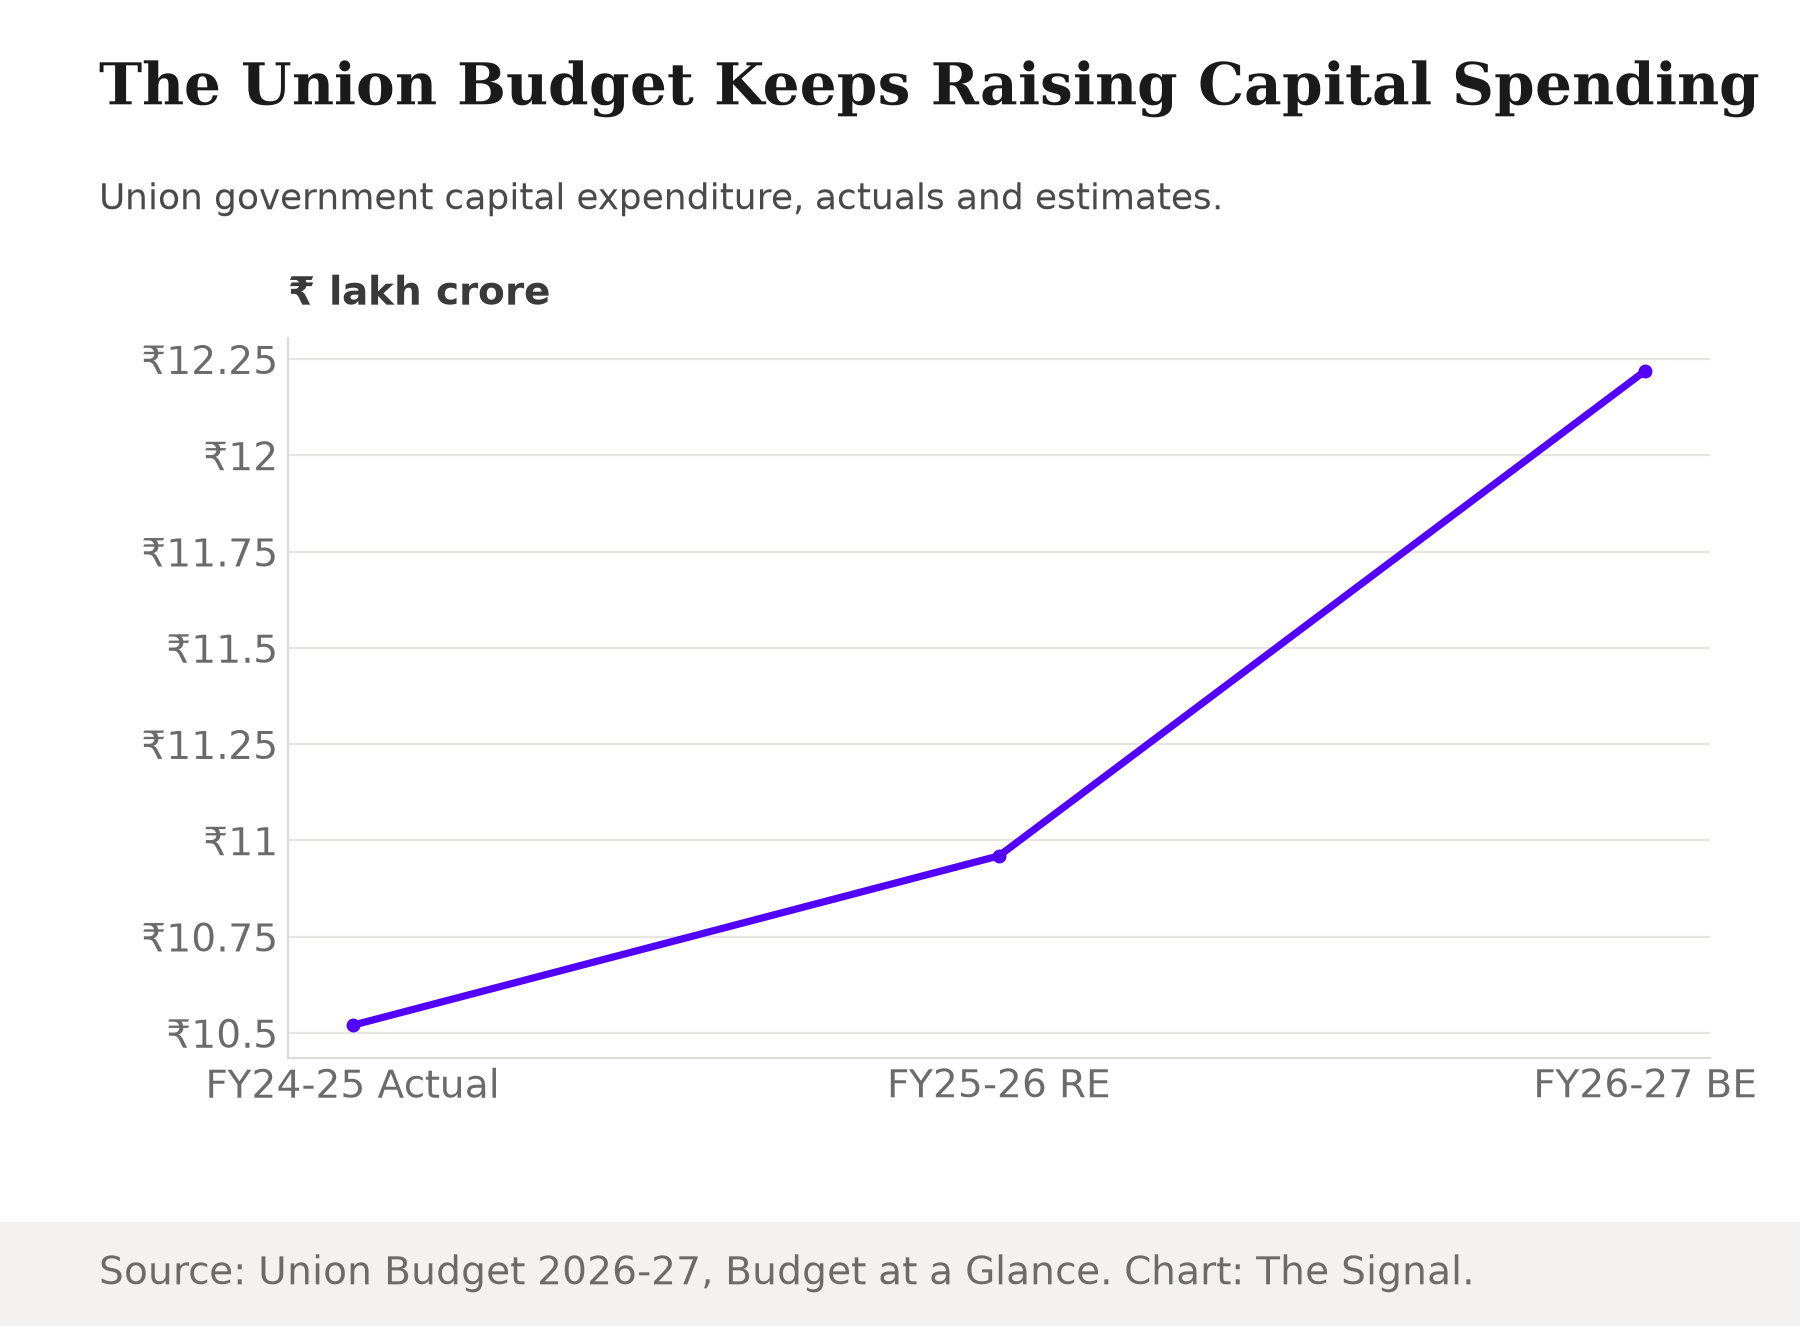
Part of the answer is sitting in the Union Budget. Budget Estimates for 2026-27 raise Union government capital expenditure to ₹12.22 lakh crore (₹12,21,821 crore), an 11.5% increase over the ₹10.96 lakh crore Revised Estimate for capital spending in 2025-26, which itself was higher than the ₹10.52 lakh crore actually spent in 2024-25. Three budget cycles running, the government has chosen to spend more on roads, railways, defence hardware and other capital projects, not less.
That supply-side push lines up with what the national accounts show for the economy as a whole. In the Provisional Estimates for FY2025-26, Gross Fixed Capital Formation grew 8.2% and Private Final Consumption Expenditure grew 7.7% at constant prices, both above 7.5%, with investment outpacing consumption. The gap at the level of the whole economy, 8.2% against 7.7%, is real but narrow. Inside industrial output, the same comparison, 12.9% against 3.6%, is anything but narrow.
Why non-durables are the drag
Households have a straightforward reason to be cautious on everyday spending. Retail inflation ran at 4.38% year on year in June 2026, and food inflation ran hotter still, at 5.32%. Non-durables output, the soap, biscuits, toiletries and packaged staples that make up most of that category, is volume driven and tracks real household budgets in a way capital goods orders do not. A factory that just won a contract for transformers or turbines does not need Indian households to feel flush; a factory making shampoo does. When food prices are running nearly a full percentage point ahead of the headline rate, the segment of industrial output most exposed to that squeeze is exactly the one lagging.
The index is weighted against the story it is telling
The mismatch sharpens once each category is weighted by how much it actually counts toward that headline figure.
Capital Goods carries a weight of just 8.08 out of 100 in the new, 2022-23-base version of the IIP, first published in June 2026, against a combined 27.46 for Consumer Durables and Consumer Non-durables together, yet it is the category growing fastest.
| Category | Index weight (of 100) | May 2026 growth |
|---|---|---|
| Capital Goods | 8.08 | 12.9% |
| Consumer Non-Durables | 16.15 | 3.6% |
| Consumer Durables | 11.31 | 7.2% |
| Infrastructure/Construction | 10.91 | 5.9% |
| Intermediate Goods | 22.42 | 5.8% |
| Primary Goods | 31.14 | 2.6% |
Source: MoSPI, first press release of the revised IIP series, Base 2022-23=100; MoSPI Quick Estimates of the Index of Industrial Production, May 2026.
Capital Goods carries the smallest share of the index and is growing the fastest of any category. The categories that together carry more than three times its weight are growing at a fraction of the pace. A single headline growth figure can mask a split running in either direction. In May 2026, it masked a factory floor investing well ahead of what households are actually buying.
The honest objection
The strongest pushback is that the economy-wide numbers do not show a demand problem at all. World Bank data put India's household final consumption expenditure growth at 5.8% in real terms in 2024, the latest year in its series, against MoSPI's own 7.7% reading for Private Final Consumption Expenditure in FY2025-26. Consumption did not stall, it accelerated. And the gap between that 7.7% and Gross Fixed Capital Formation's 8.2% growth in the same provisional estimates is under a percentage point, hardly the profile of an economy building factories nobody will buy from.
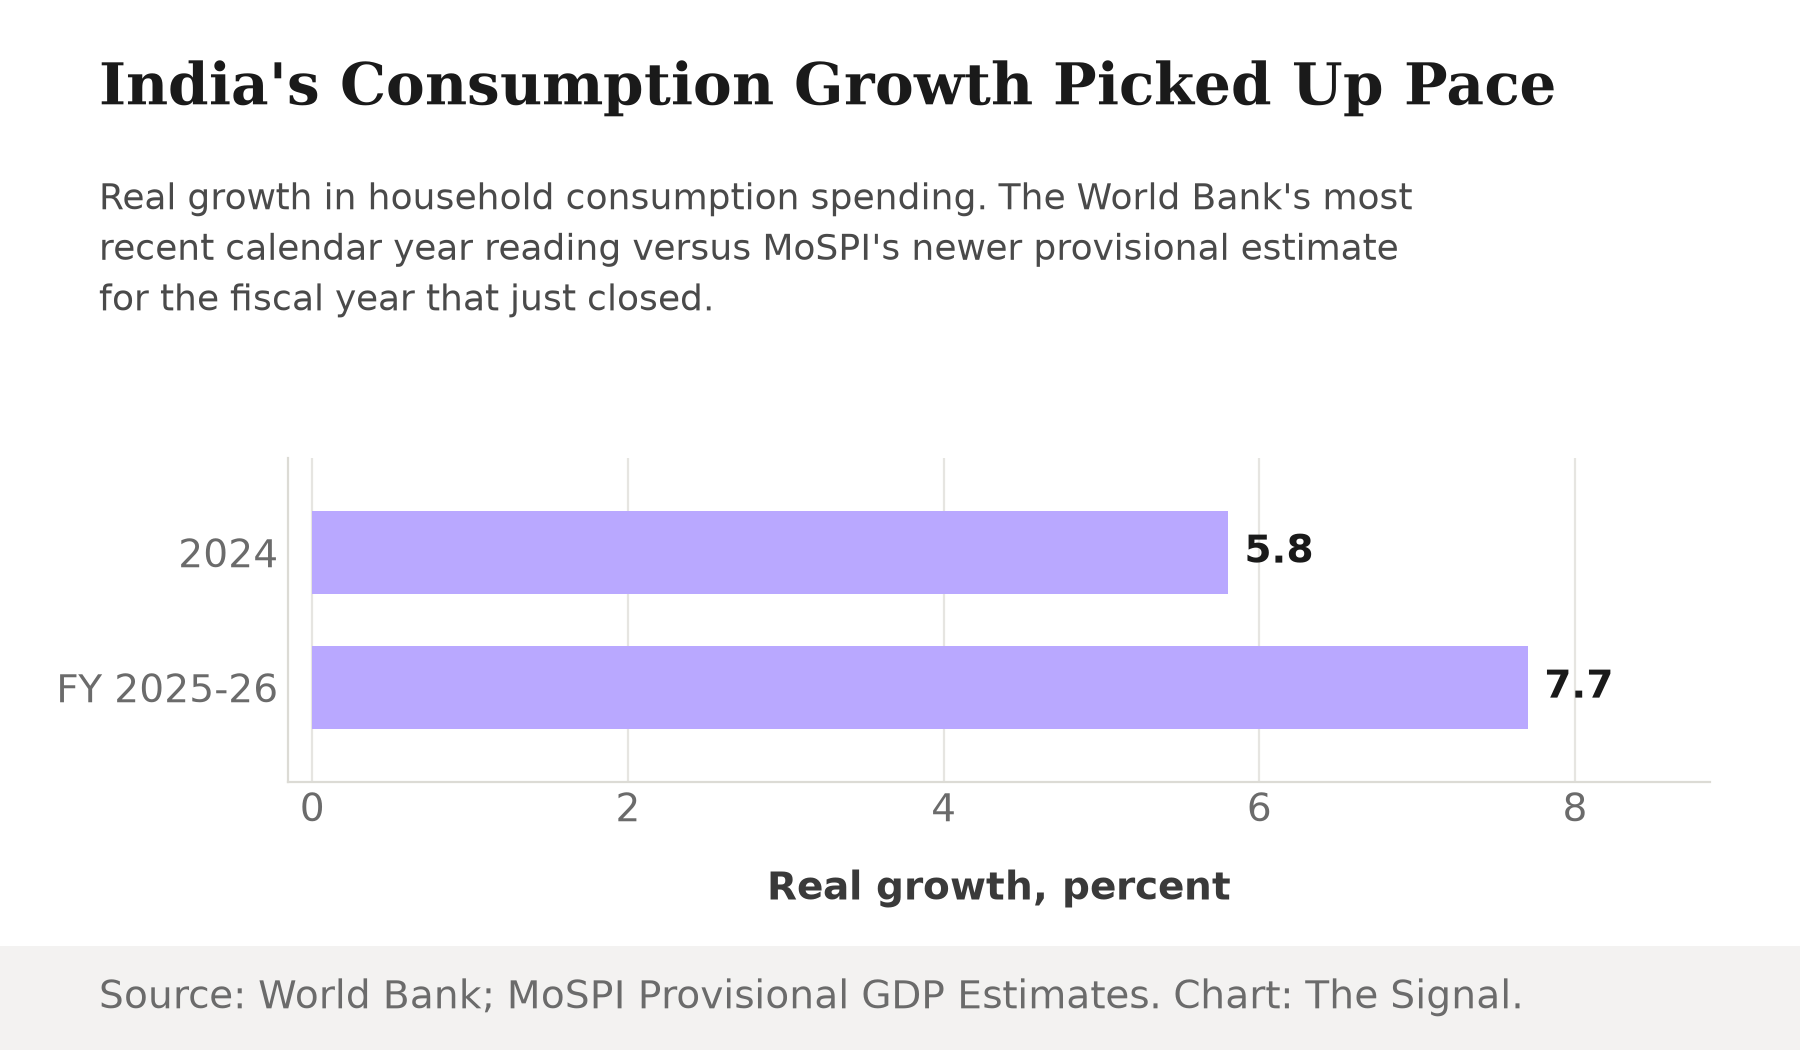
That case is real, and it argues against reading this as an economy-wide consumption crisis. But it is an annual, blended figure that folds durable goods, non-durables and services into one number, and MoSPI's own monthly breakdown shows the strain is not spread evenly across that blend. Consumer Durables output grew 7.2% in the same May 2026 release, comfortably ahead of the pack. It is specifically Consumer Non-durables, the low-ticket, inflation-exposed, everyday-purchase segment, that is stuck at 3.6%. An aggregate consumption number can accelerate simply because durables, services and big-ticket buying are healthy. That is compatible with a narrower story underneath it: the part of household spending most sensitive to food prices is not keeping pace with what factories are now building.
The Signal
Read only the headline growth figure and May 2026 looks like an industrial revival with consumers along for the ride. Read the category breakdown, the weighting and the budget math together, and it looks more like a state-funded capacity bet running ahead of the households it is ultimately supposed to serve. That is not necessarily a mistake: capital goods and infrastructure spending build the capacity that non-durables manufacturers will eventually need if consumption catches up to it. But it is a bet, and bets on future demand carry inventory and margin risk if the catch-up is slow. Watch the same use-based breakdown in the months after June 2026's food inflation works through household budgets. If Consumer Non-durables growth converges toward Capital Goods, the capex is being validated by demand. If the gap holds through another release or two, India will have built the factories before it built the customers.
Reporting basis: the May 2026 Index of Industrial Production growth figures, by use-based category, are from MoSPI's Quick Estimates release, via the Press Information Bureau. The index weights are from MoSPI's first press release of the revised, 2022-23-base IIP series, also via the Press Information Bureau. The Union Budget 2026-27 capital expenditure figures are from the Ministry of Finance's Budget at a Glance document. The FY2025-26 expenditure-side GDP growth rates are from MoSPI's Provisional Estimates press note. The June 2026 retail and food inflation readings are from MoSPI's Consumer Price Index release, via the Press Information Bureau. The 2024 household consumption growth figure is World Bank data, from its World Development Indicators database. The lakh crore conversions and the weight-to-growth comparisons are The Signal's calculations from those figures.