On the numbers that get quoted most often, India's trade relationship with China looks like it only runs one way. China overtook the United States to become India's largest trading partner in the 2025-26 fiscal year, with bilateral trade of $151.1 billion and a deficit that widened to an all-time high of $112.16 billion, as India's imports from China rose 16 percent to $131.63 billion while its own exports to China grew more slowly, reaching just $19.47 billion. The gap has kept widening since. India's trade deficit with China hit $15.3 billion in June 2026 alone, a 430 percent jump from a year earlier, as first-half imports from China touched a record $79.41 billion. Read only those figures, and the relationship is exactly what it looks like: China sells, India buys, and the difference keeps setting records.
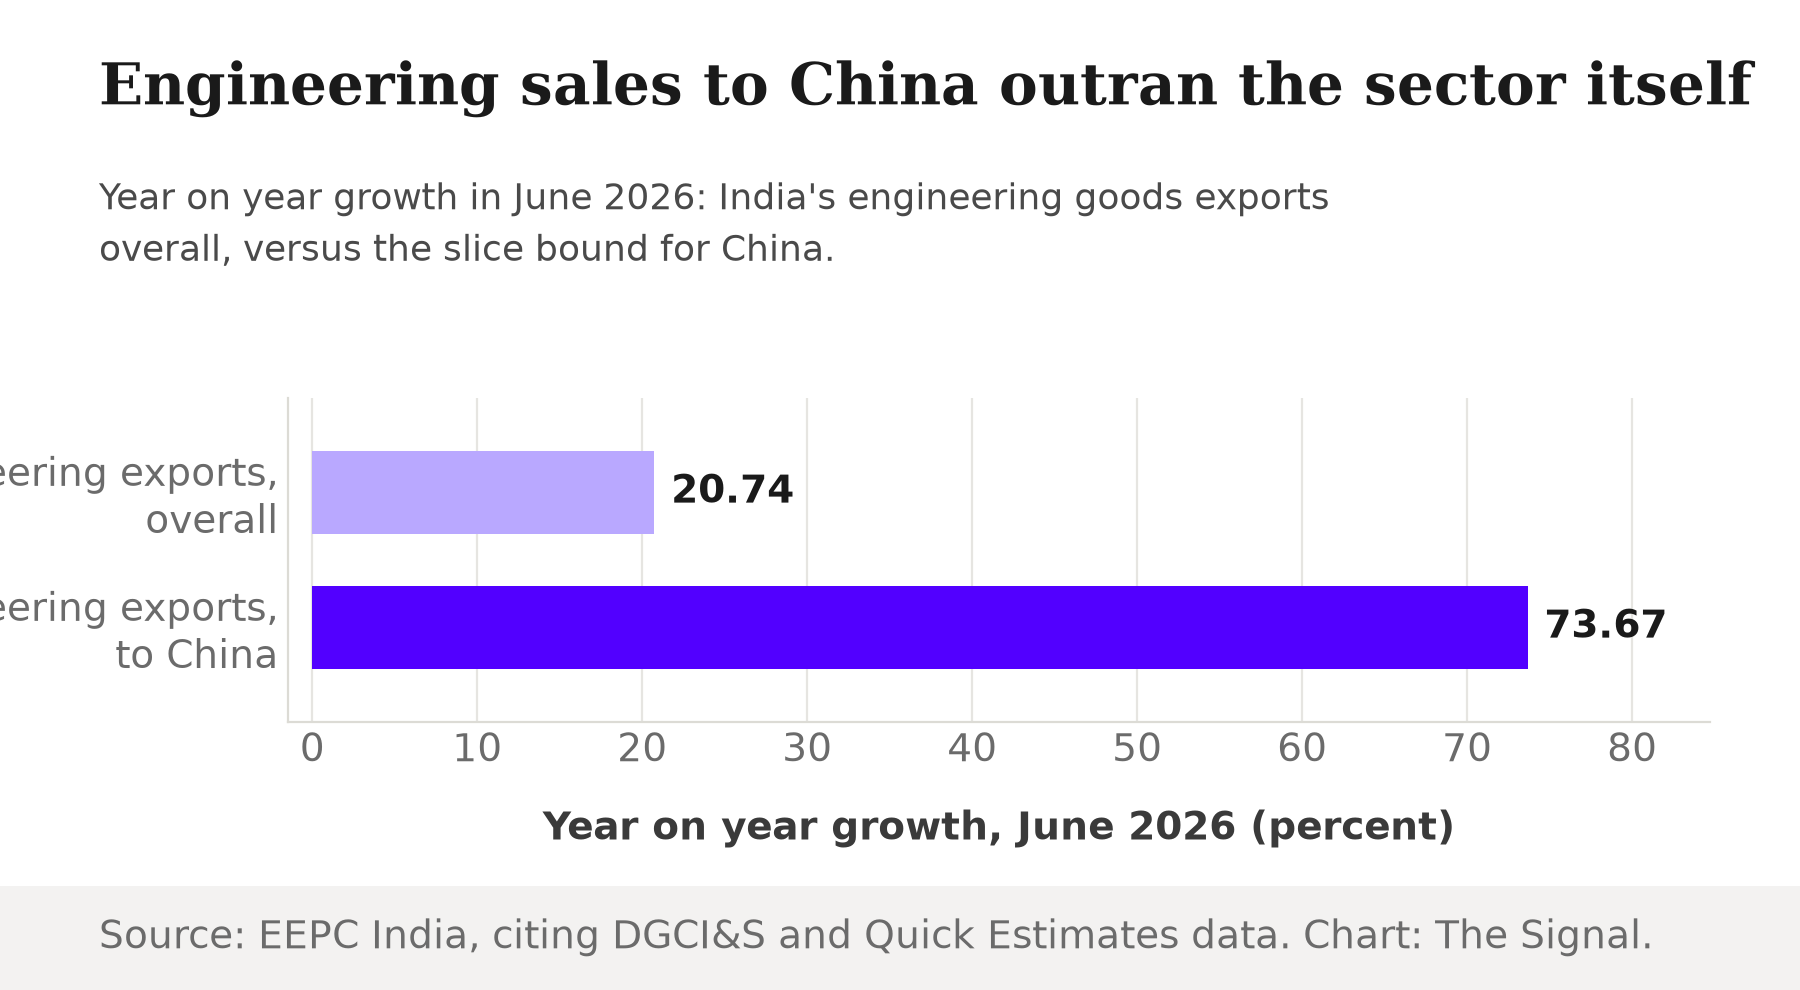
It is worth slowing down on that story, because inside one specific, high-value category, the trade is not running one way at all. India's engineering goods exports climbed 20.74 percent year on year to $11.48 billion in June 2026, a solid number on its own. But the slice of that going to China rose 73.67 percent in the same month, to $361.47 million: our calculation puts China-bound growth at about three and a half times the sector's overall pace. For a category everyone assumes is dominated by what flows in from China, that is not a small gap.
Source: EEPC India. Chart: The Signal.
A record year for the sector, not just for China
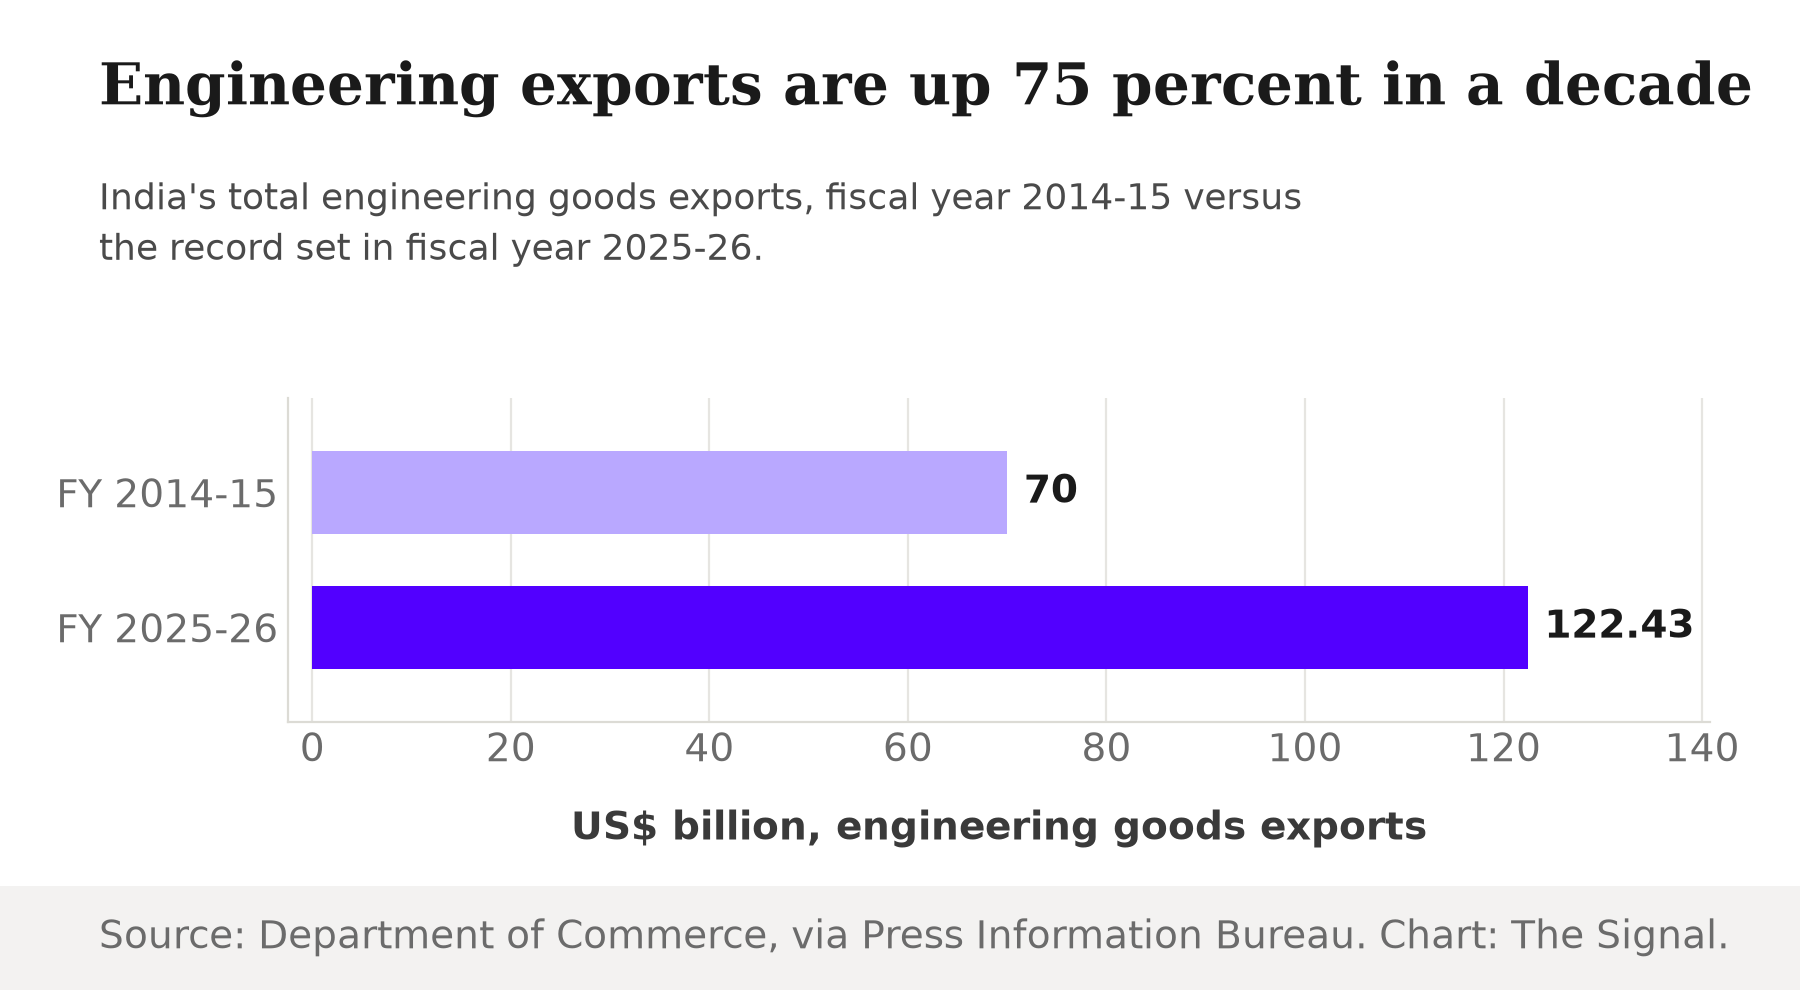
That June number sits inside a longer trend. India's engineering goods exports have risen from about $70 billion in the 2014-15 fiscal year to a record $122.43 billion in 2025-26, and the sector is now the single largest contributor to India's merchandise exports, at nearly 28 percent of the total. In the first quarter of 2026-27 (April to June 2026), engineering exports totalled $34.14 billion, up 18.09 percent year on year, and the sector's share of total merchandise exports rose to 28.40 percent, from 27.18 percent a year earlier.
Engineering's June 2026 scorecard, at a glance.
| Metric | Value | Period |
|---|---|---|
| Engineering exports, overall growth | 20.74% | June 2026, year on year |
| Exports to China | $361.47 million, up 73.67% | June 2026, year on year |
| Exports to Oman | $258.97 million, up 420.3% | June 2026, year on year |
| Share of total merchandise exports | 28.40%, up from 27.18% | June 2026 vs. June 2025 |
Source: EEPC India, compiled from DGCI&S and Government of India Quick Estimates.
Source: Press Information Bureau. Chart: The Signal.
Behind the single monthly headline, two product categories are doing most of the work over the full fiscal year. In 2025-26, China ranked among the top five buyers of two of India's major engineering panels: Non-Ferrous Metals and products, where India's exports to China rose 98 percent year on year to $1,226.4 million, and Industrial Machinery, where they rose 11 percent to $946.4 million. Those are full-year figures rather than the June-only number above, but they say the same thing a different way: the China-bound gain is not a one-month blip in a single goods line, it shows up across metals and machinery over an entire fiscal year.
Oman's jump, and the tariff deal sitting behind it
Oman's number is the more extreme one. Engineering exports to Oman surged 420.3 percent year on year in June 2026, to $258.97 million, more than five times the growth rate to China. Part of the explanation is likely tariff, not just demand. Under the India-Oman Comprehensive Economic Partnership Agreement, India secures 100 percent duty-free market access for its exports to Oman across 98.08 percent of Oman's tariff lines, covering 99.38 percent of India's export value, with the zero-duty concessions applying from the agreement's entry into force, per a Press Information Bureau explainer published in January 2026. That timing is not a loose comparison: the CEPA actually came into force on 1 June 2026, the same month engineering exports to Oman more than quintupled. Even so, one month of overlap is not a proven mechanism: the trade data itself does not draw a causal line between the two, so the CEPA is the likely tailwind here, not a demonstrated cause.
The honest objection
The strongest case against reading any of this as a reversal is scale. China's engineering-goods purchases from India totalled about $1.00 billion for the April-June 2026 quarter, up from $581.22 million a year earlier, against Oman's $459.86 million, up from $204.67 million. Our calculation puts China at about 2.9 percent of the quarter's $34.14 billion in total engineering exports, and Oman at about 1.3 percent. Both are growing fast off a small base, and small bases are exactly where triple-digit growth rates come cheap.
Set those numbers against the wider relationship, and the imbalance still dwarfs them. India's total exports to China were $19.47 billion in fiscal 2025-26, against $131.63 billion in imports, a gap no single export category is close to closing. Even in the first half of calendar 2026, India's exports to China grew 37.2 percent to $12.31 billion, but that sits against $79.41 billion in imports over the same half. And this is not a one-year spike: India's imports from China rose to $131.6 billion in the fiscal year ended March 2026, up from $65.2 billion in fiscal 2020-21, a trade deficit that has widened 155 percent over five years.
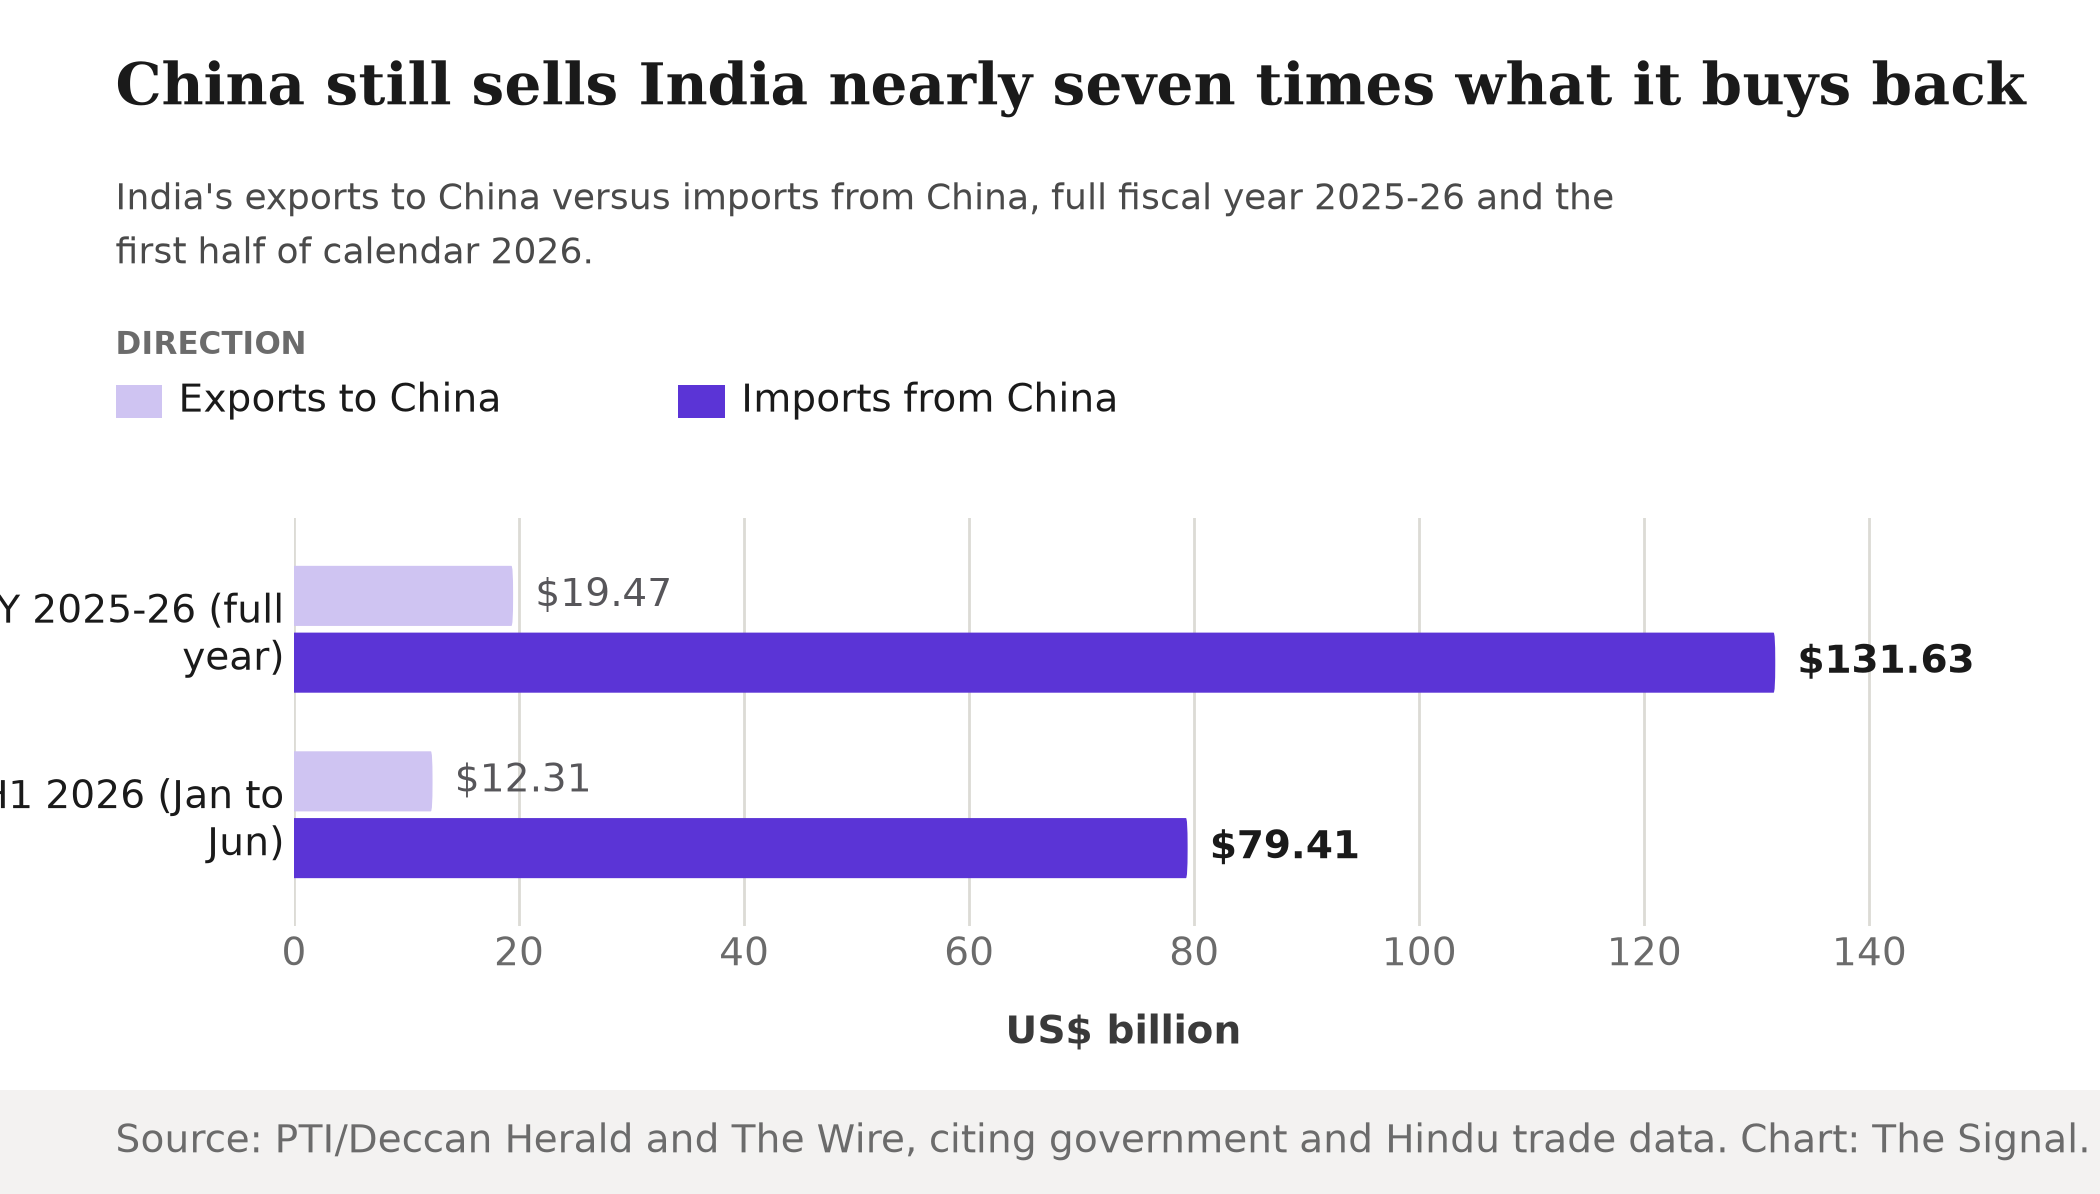
Source: Deccan Herald; The Wire, citing The Hindu's analysis of trade data. Chart: The Signal.
The Signal
Two things about India's trade with China are true at once in the middle of 2026, and neither cancels the other. The aggregate relationship is getting more lopsided, not less: the deficit hit $15.3 billion in June alone, a 430 percent jump from a year earlier. And inside one specific, high-value category, engineering goods, India is genuinely gaining ground, growing its China-bound sales at close to three and a half times the pace of the sector overall, per EEPC India's June figures. What to watch is whether that growth keeps compounding off its small base the way Oman's did after its tariff deal, or plateaus once the easy comparisons wear off. Either way, judge it by the dollar figure, not the percentage. A fast-growing sliver of trade only matters once it is large enough to bend the gap it is supposed to be closing, and right now it is not.
Reporting basis: the June 2026 and first-quarter 2026-27 export figures, including the China and Oman breakdowns and engineering's share of merchandise exports, are EEPC India's compilation of DGCI&S and Government of India Quick Estimates data. The fiscal 2025-26 product-panel breakdown of China-bound engineering exports is from EEPC India's Engineering Trade Analysis for March 2026. The India-Oman CEPA terms are per a Press Information Bureau explainer published in January 2026, and its entry-into-force date is per a Press Information Bureau release from the Ministry of Textiles. The fiscal 2025-26 trade totals, including the record deficit with China, are government data as reported by PTI in the Deccan Herald. The five-year trade-deficit trend is as reported by Deccan Herald. The June 2026 monthly deficit and first-half 2026 import and export figures are as reported by The Wire, citing The Hindu's analysis of trade data. The historical engineering-export trend from 2014-15 to 2025-26 is from a Department of Commerce statement via the Press Information Bureau. The growth-rate ratio, the quarterly shares of total engineering exports, and the other cross-figure comparisons in this piece are The Signal's calculations from those numbers.