
India's flash Composite PMI fell to 54.3 in July from a final 57.1 in June, the lowest reading since March 2022, over four years ago, Trading Economics reported, relaying the HSBC/S&P Global flash survey. Persistent hostilities in the Middle East weighed on business activity during the month, the survey found. Read as one number, it looks like exactly what it sounds like: India's private sector expansion, the engine behind a run of strong growth prints, has hit a wall.
Split the composite number in two, though, and it stops being one story. India's flash Services PMI Business Activity Index dropped to 53.1 in July from a final 57.4 in June, the softest expansion since February 2022 and the weakest growth rate in 53 months. India's flash Manufacturing PMI eased only slightly, to 53.9 from 54.2, its softest expansion since March 2025, with output and export orders actually recovering some of the momentum they had lost in prior months. Services fell 4.3 points in a single month; manufacturing fell 0.3. Services' decline is nearly 14 times the size of manufacturing's, our calculation from those two readings. The four-year low in the headline number is, almost entirely, a services number.
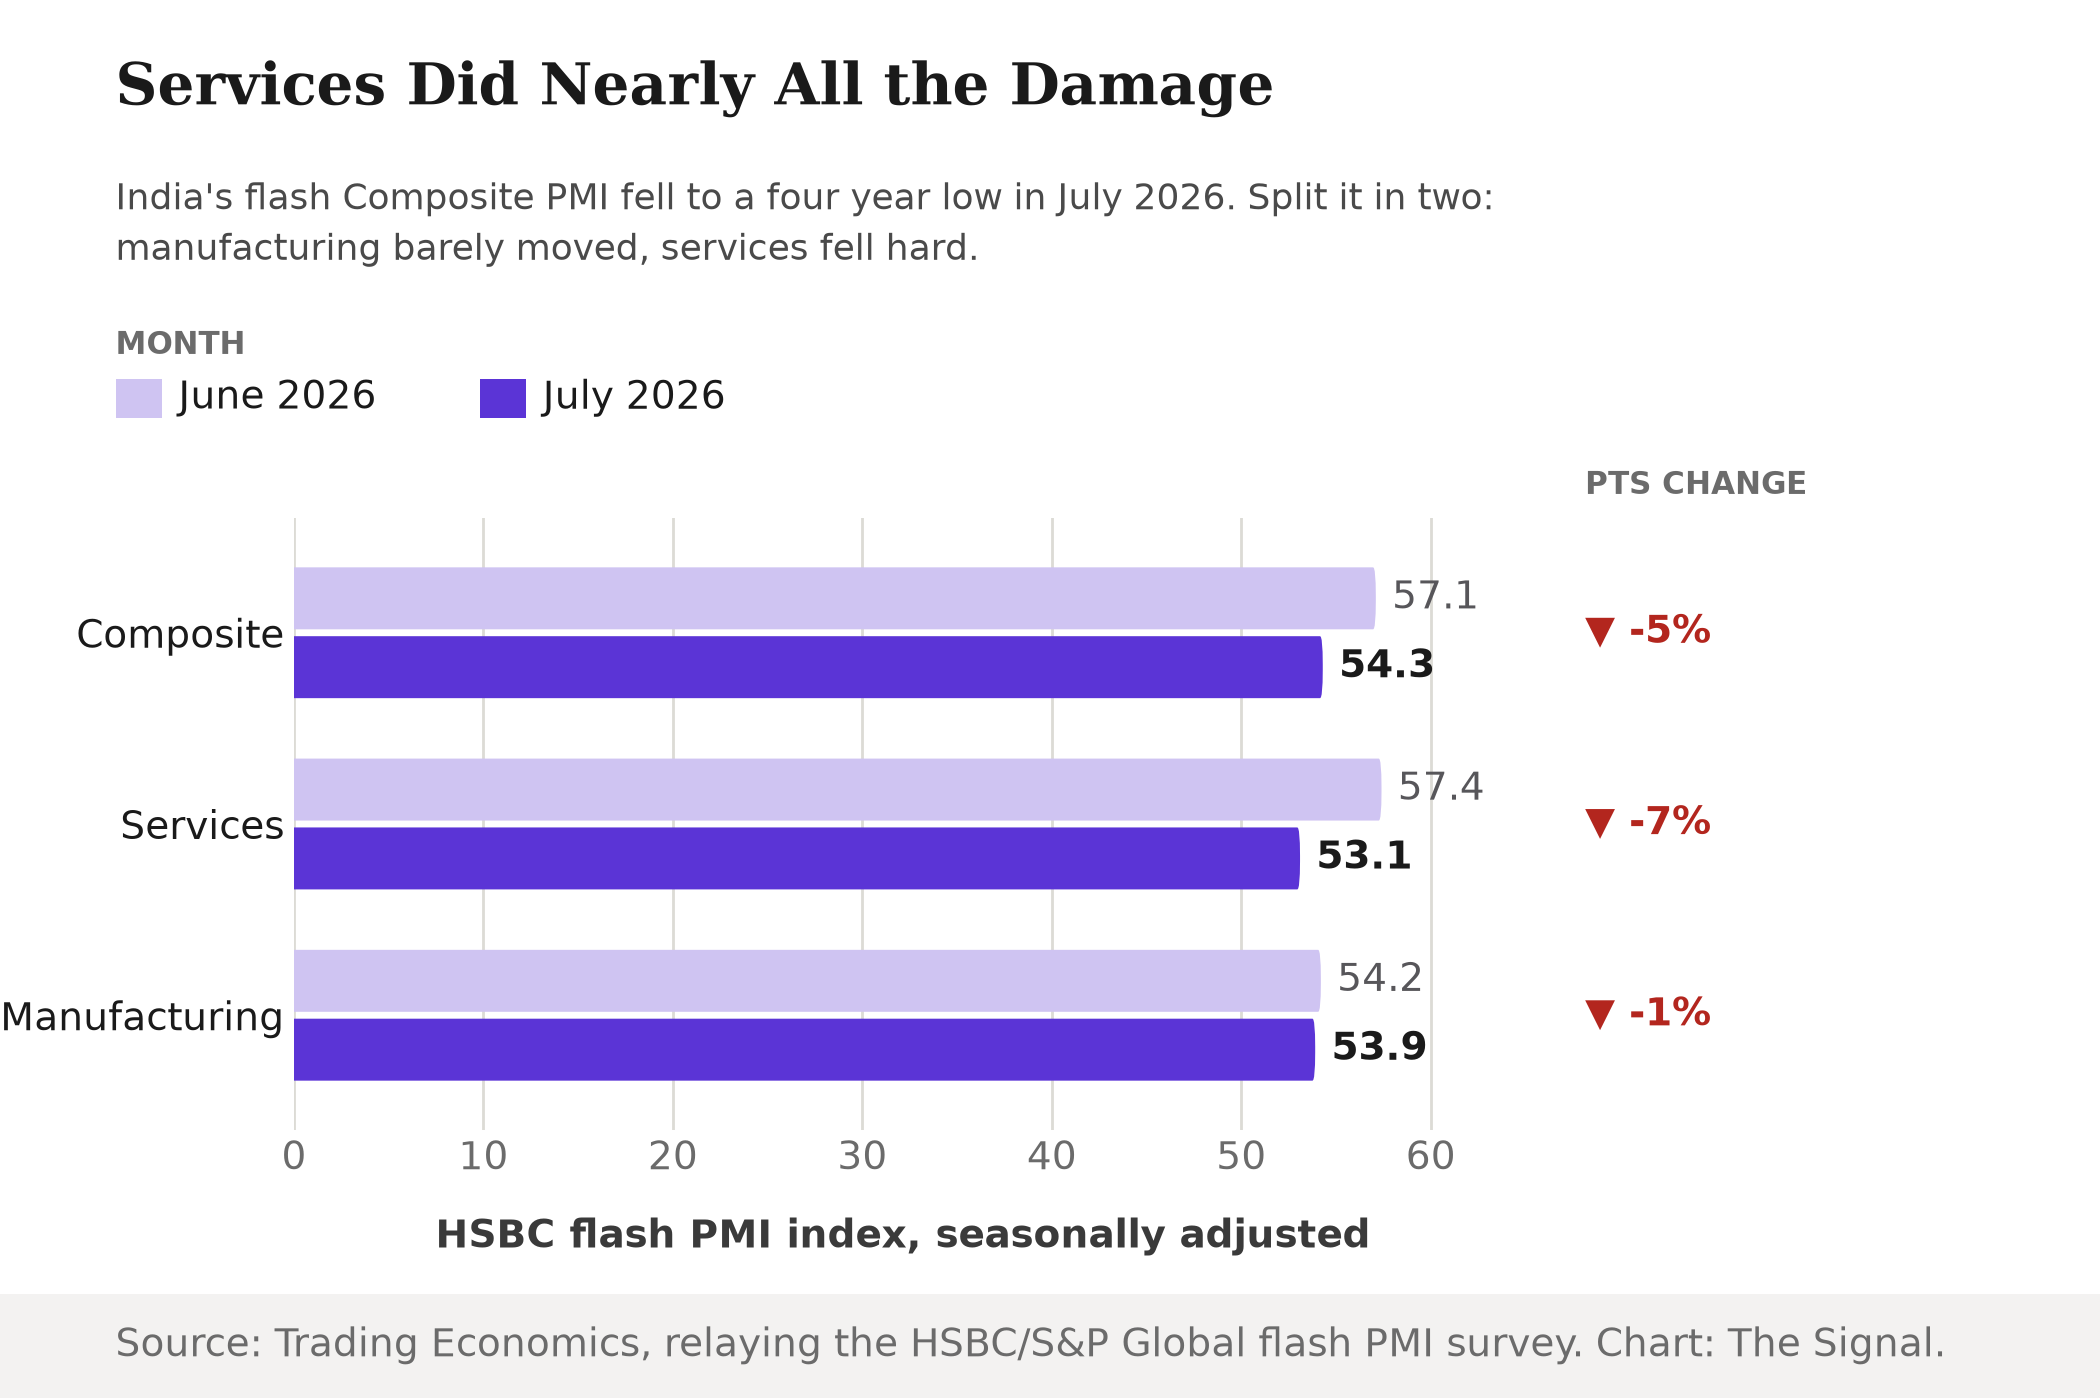
Source: Trading Economics, relaying the HSBC/S&P Global flash PMI survey. Chart: The Signal.
Both sub-indexes are still above the 50 mark that separates expansion from contraction: services at 53.1 and manufacturing at 53.9 in July, so this is not services in reverse. It is services still growing, just at its slowest pace in more than four years, while the factory floor holds closer to steady.
The sector carrying the boom
That distinction matters more for services than it would for almost any other part of the economy, because services is not a side story in India's growth, it is the main one. India's tertiary sector, which spans trade, finance, IT and other services activity, grew 9.3% in real terms in the year ended March 2026, the fastest of the economy's three broad sectors, against 8.8% for industry and 3.2% for agriculture and allied activities. That sector alone generated Rs 155.44 lakh crore of the country's Rs 294.91 lakh crore total real gross value added in FY2025-26, about 52.7% of it.
Services was already the fastest growing, and by far the largest, part of the Indian economy in FY2025-26, the year before this slowdown showed up.
| Sector | Real GVA growth, FY2025-26 (year on year) |
|---|---|
| Tertiary (services) | 9.3% |
| Secondary (industry) | 8.8% |
| Primary (agriculture and allied) | 3.2% |
Source: National Statistical Office, Ministry of Statistics and Programme Implementation of India.
The same release shows why a services slowdown carries more weight than a manufacturing one right now. India's real GDP grew 7.8% year on year in the January-March 2026 quarter, capping a fiscal year in which full-year real growth accelerated to 7.7%, up from 7.1% in FY2024-25. The National Statistical Office published these figures via the Press Information Bureau, for the fiscal year ended March 2026, the latest full year it has reported. Growth did not slow through FY2025-26; it sped up, in the one sector that grew fastest inside it and now looks weakest.
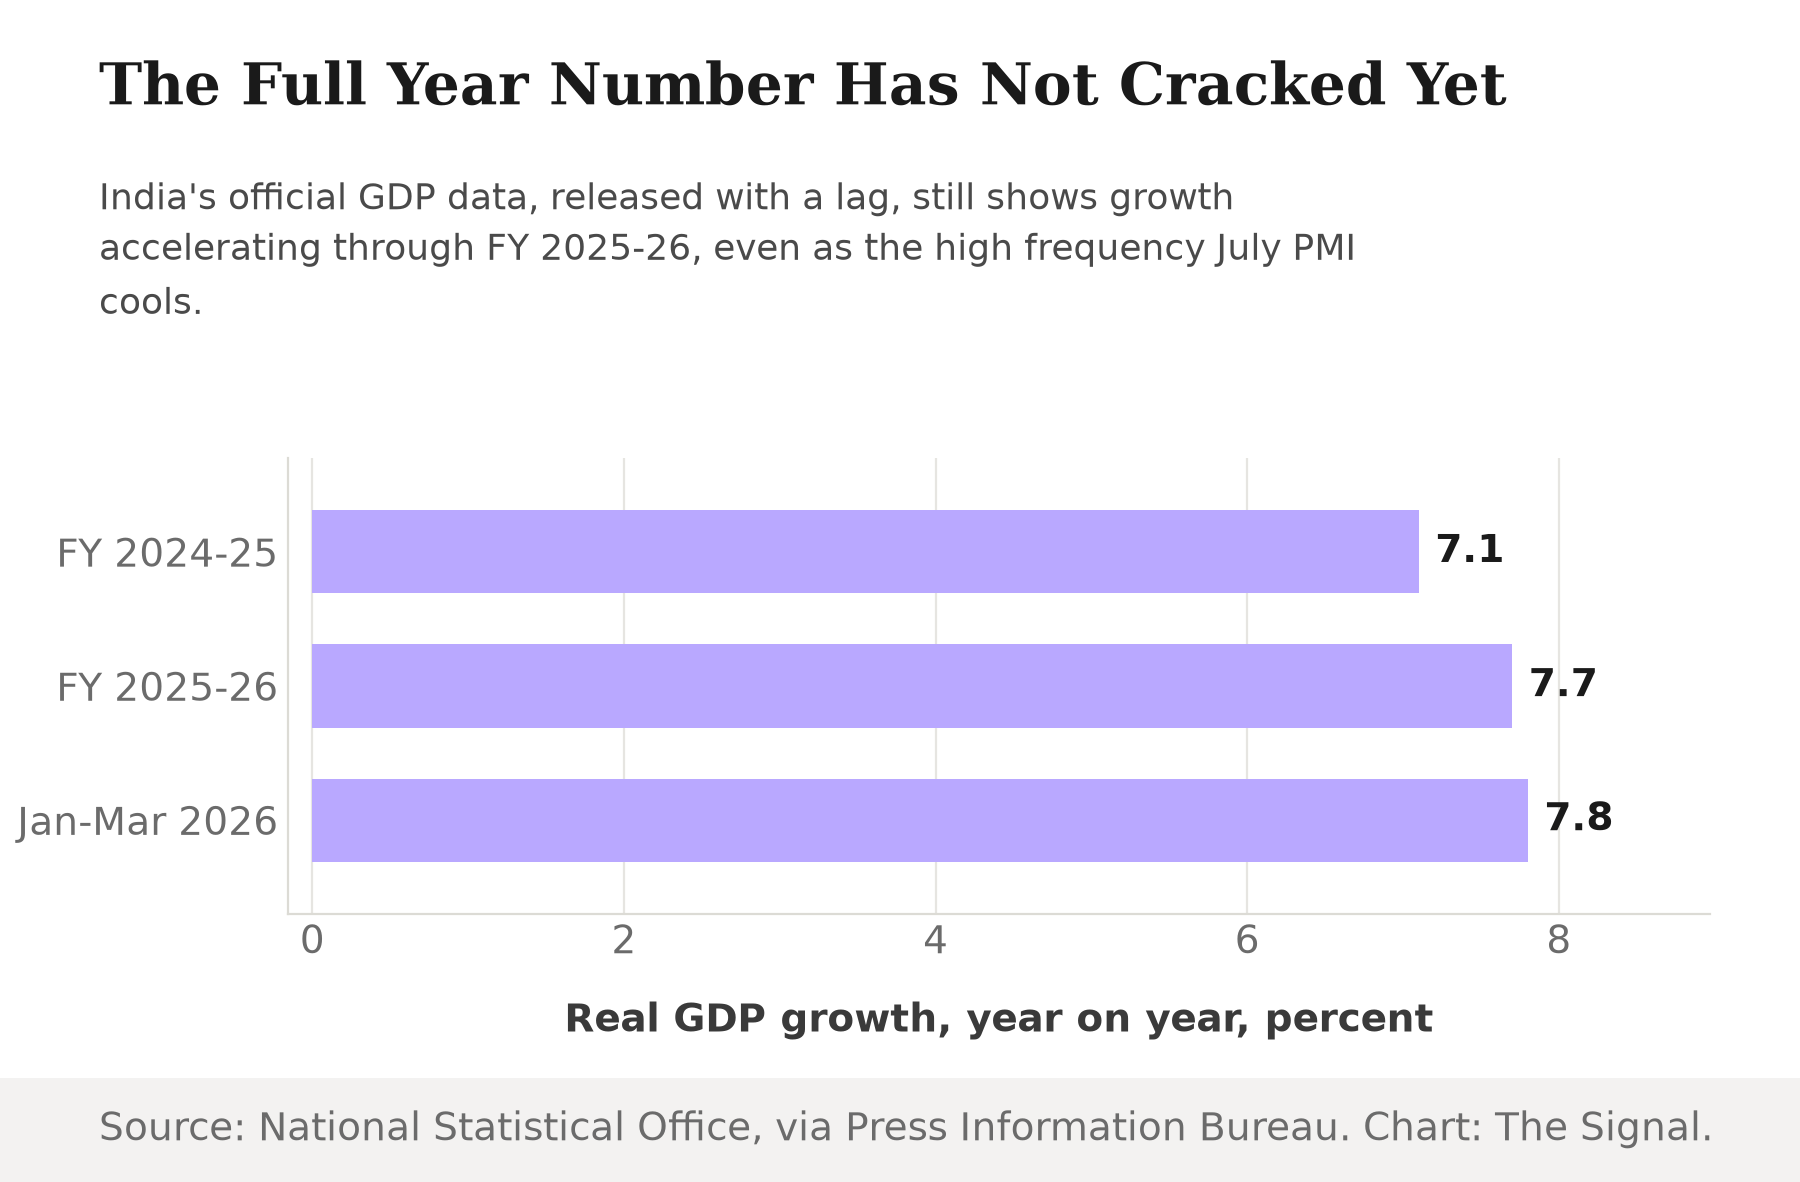
Source: National Statistical Office, via the Press Information Bureau. Chart: The Signal.
What HSBC says is driving it
HSBC's Chief India Economist Pranjul Bhandari attributed the July slowdown to renewed Middle East tensions prompting companies to build supply buffers, noting that inventories and purchasing activity increased as firms prepared for potential disruption, the Free Press Journal reported. She also pointed to intensifying cost pressures pushing businesses to raise their own output charges to protect margins.
That explains a shared shock, but not why the two sectors absorbed it so differently. Building a supply buffer is a manufacturing-style response: it shows up as inventories and purchase orders, which lines up with manufacturing's output and export orders recovering some lost momentum in the same month. A services firm has no physical inventory to stock up on. Facing the same cost pressure, its options are thinner margins or higher prices, with no order-book cushion to soften the hit. That mechanical gap, one sector can stockpile against a shock and the other cannot, is a plausible reason the same Middle East disruption left such different marks on the two PMI readings.
The honest objection
The strongest case against reading too much into one PMI print is that it is exactly that, one flash print. Both sub-indexes remain above the expansion line, and Bhandari's own explanation points to a shock, Middle East tensions, that is inherently reversible rather than structural. Manufacturing's recovering export orders in the same month show the shock did not weigh uniformly on activity, and the fiscal year measured just before it, FY2025-26, showed growth accelerating to 7.7%, not slowing.
That case holds for one month. It holds less well once the specific numbers are named. Services growth at its weakest pace in 53 months is not ordinary monthly noise, and it is happening in the sector that supplies about 52.7% of India's real economic output. A one-month wobble in a small sector is noise. In the sector generating more than half of GVA, growing at its slowest rate in over four years, the same wobble is worth watching closely, whatever caused it this time.
The Signal
The four-year low in India's composite PMI is a services story wearing a headline number. Manufacturing barely moved between June and July; services did nearly all of the falling, in the one sector that both grew fastest and weighed heaviest in the economy through FY2025-26. If August's flash reading shows services stabilizing as the Middle East shock fades, this was a one-print wobble inside an otherwise accelerating economy. If it extends the slide instead, the sector that has carried Indian growth since the pandemic will have started dragging on it, and the composite number will not need explaining twice.
Reporting basis: the July 2026 flash Composite, Services and Manufacturing PMI readings, and their June comparators, are from Trading Economics, relaying the HSBC/S&P Global flash survey. HSBC's explanation for the slowdown is per the Free Press Journal, citing the bank's Chief India Economist, Pranjul Bhandari. The FY2025-26 sector growth rates and gross value added figures are from the National Statistical Office's press note on GDP and GVA estimates for Q4 and the full year FY2025-26. The Q4 and full-year GDP growth rates are from the same National Statistical Office estimates, as published via the Press Information Bureau. The point-change comparison between the services and manufacturing PMI declines, and the ratio between them, are The Signal's calculations from those readings.