Indian households are carrying more debt than they used to, and the headline number looks like the start of a familiar story. Household debt reached 45.5 percent of GDP by end-September 2025, according to the RBI's Financial Stability Report published in June 2026. In most economies, a rising household-debt ratio tracks a housing cycle: more people buying homes, more mortgages on the books, debt growing alongside an asset that is supposed to appreciate. That is the easy assumption to reach for here too.
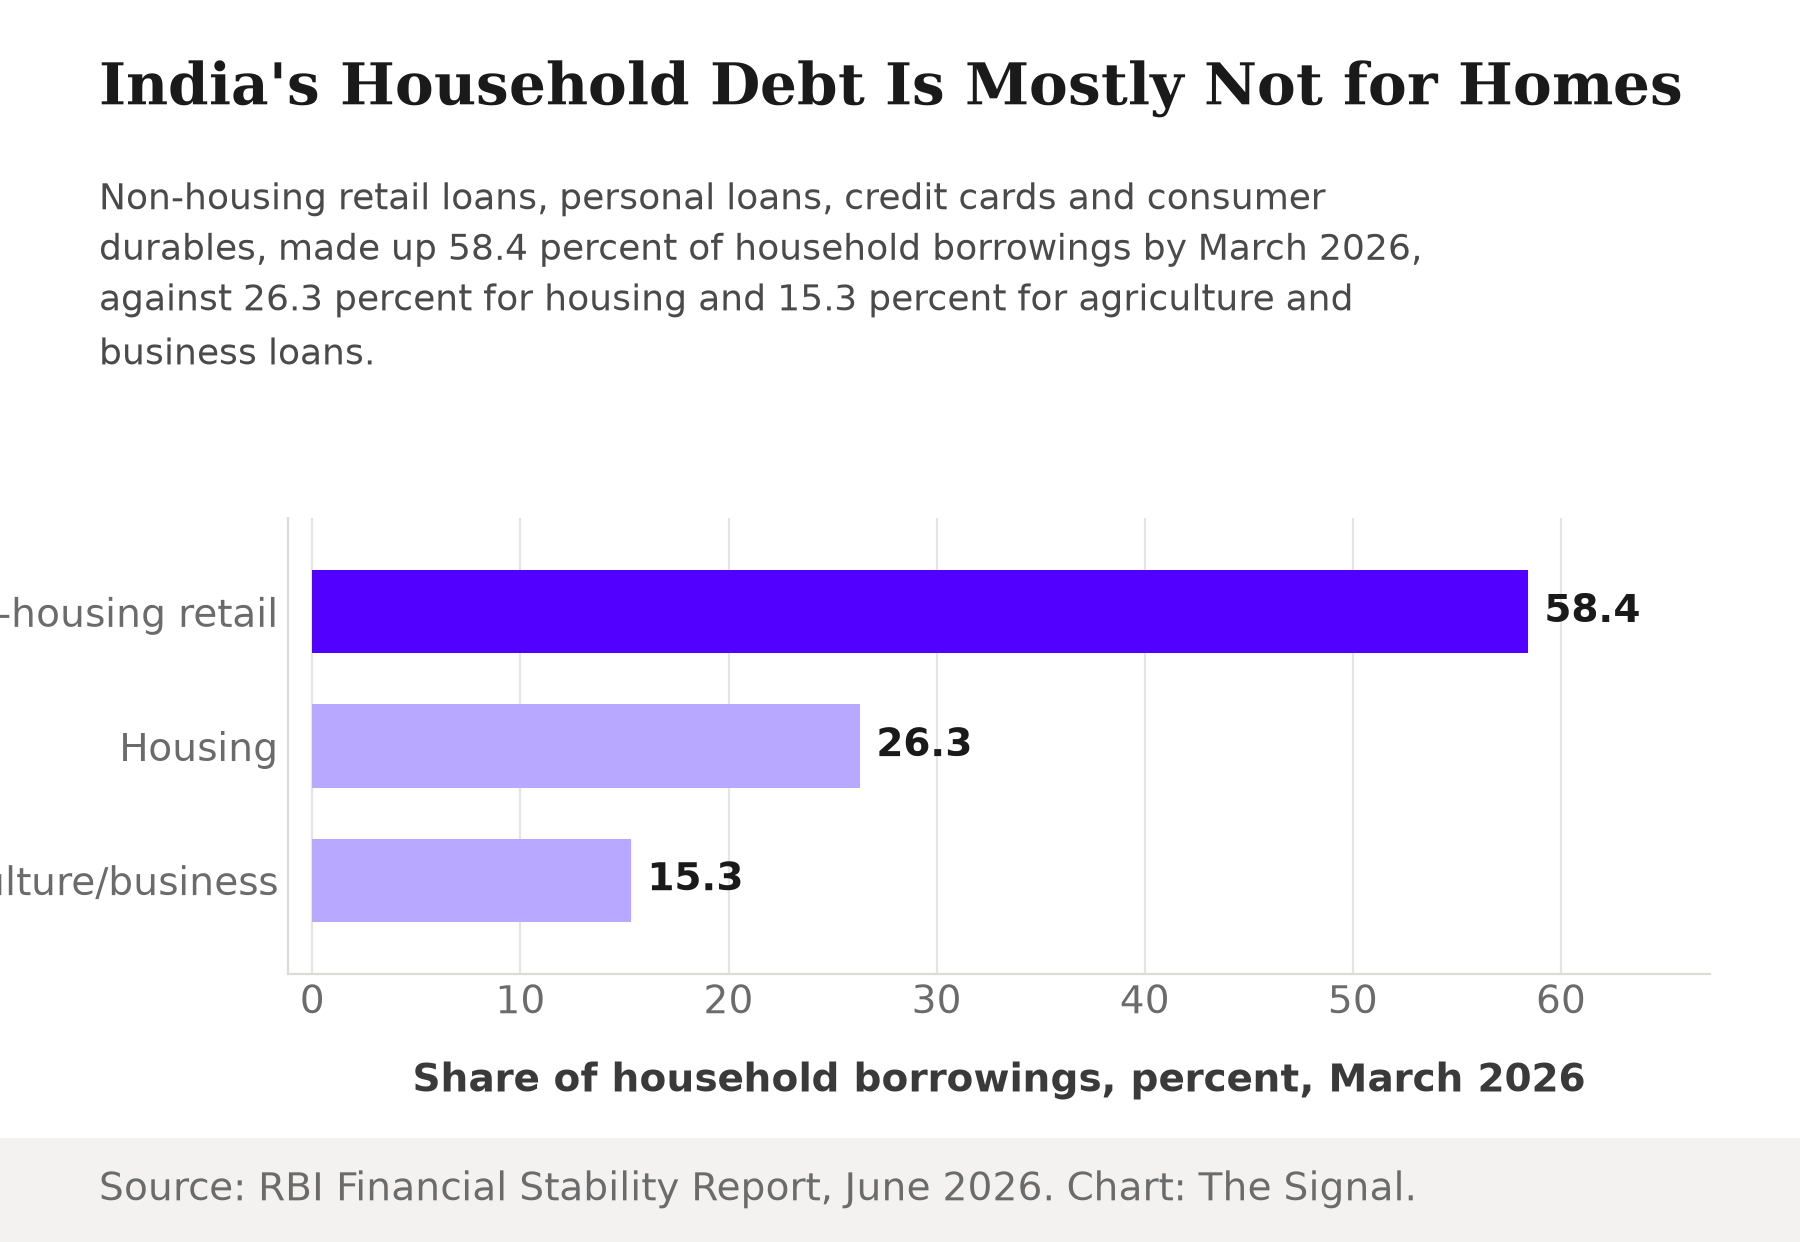
It is worth slowing down on that assumption. Non-housing retail loans, personal loans, credit cards and consumer durable financing, made up 58.4 percent of total household borrowings as of March 2026, more than double the 26.3 percent share held by housing loans, with agriculture and business loans making up the remaining 15.3 percent. Strip out the parts of that total that fund a business or a farm, and consumption-purpose loans alone accounted for 49.7 percent of all household borrowing. Roughly half of what Indian households owe was borrowed to spend, not to build an asset.
Non-housing loans, personal loans, credit cards and consumer durables, are 58.4 percent of household debt. Housing is 26.3 percent.
Gold is doing more work than any bank branch
Within that non-housing category, one product is expanding faster than anything else in the household loan book. Gold loans have become the largest segment within non-housing retail loans, growing at a 42.4 percent CAGR since March 2024, nearly twice the 23.0 percent CAGR of overall non-housing retail loans over the same period. The report attributes this to both banks and non-bank finance companies expanding their gold-loan books faster than any other retail category, including housing loans.
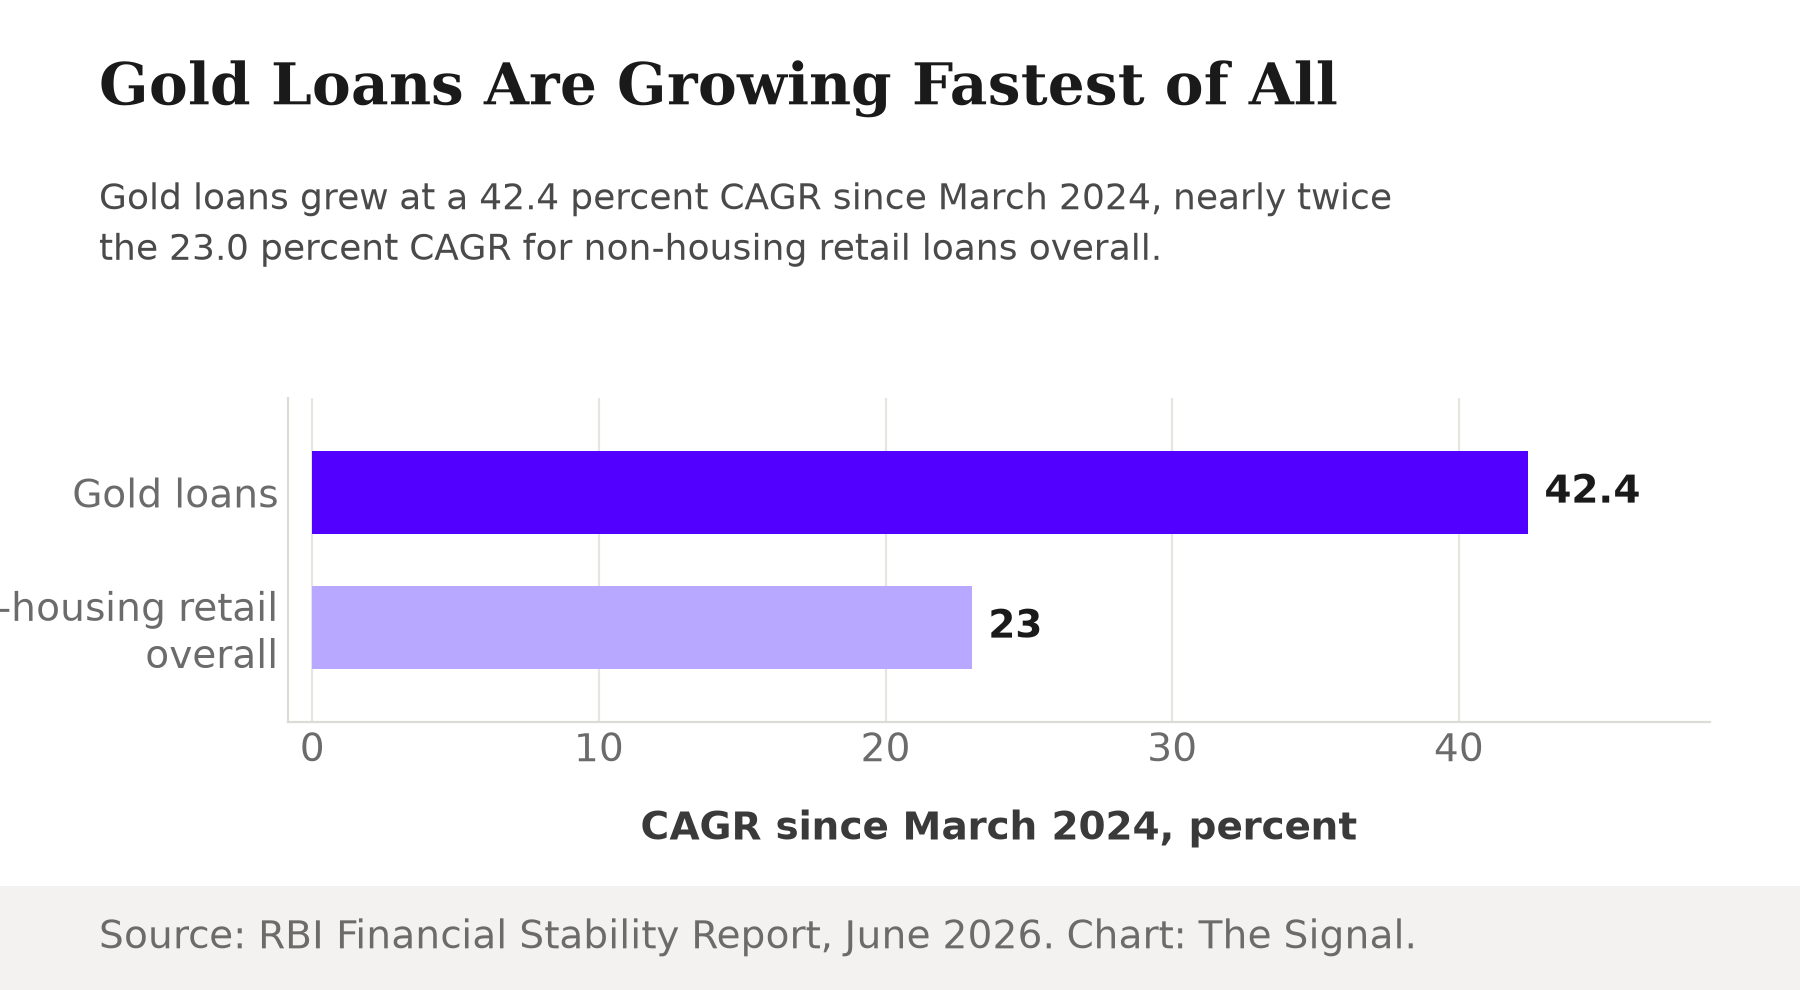
Explainer: gold loans let a household borrow against jewellery or coins it already owns, with the loan disbursed same-day and no income proof required. That speed is precisely why the product has become the fastest-growing way for a family to raise cash, not to buy a home or start a business, but to bridge a shortfall. Gold loans now make up 17.4 percent of NBFCs' retail loan portfolio, the report notes, having expanded sharply enough to outpace overall NBFC retail credit growth.
Fintech's small loans are growing fast, and souring fast
The other engine of non-housing debt is smaller in absolute size but sharper in its risk profile. Fintech firms' market share in small-ticket personal loans, those under 50,000 rupees, rose to 56.8 percent by March 2026, powered by 41.6 percent credit growth in that channel against 20.1 percent for the segment overall, roughly double the pace. The RBI is explicit about the cost of that expansion: the rapid growth in fintech small-ticket lending has been accompanied by delinquencies rising to 6.4 percent.
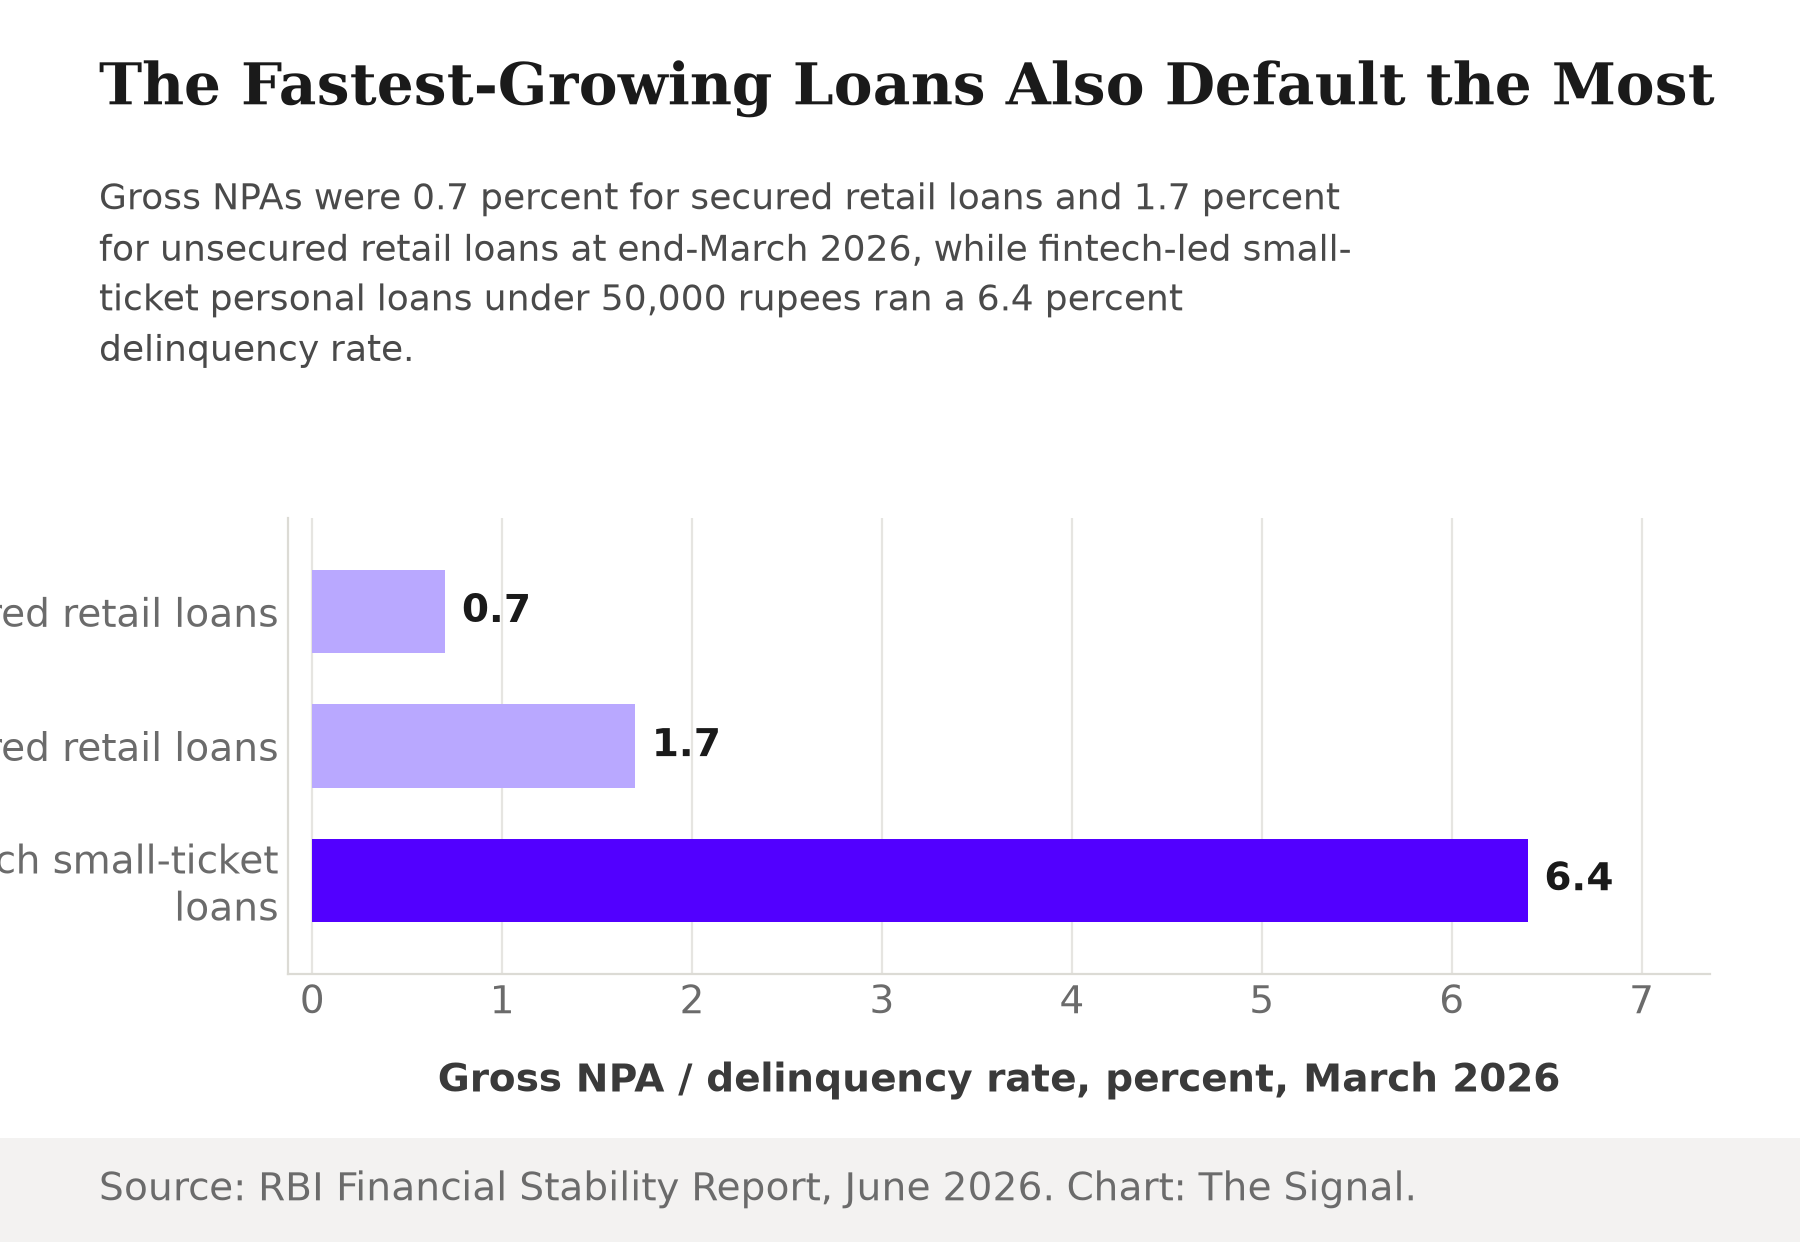
Set that beside the loan book's baseline asset quality. Gross NPA ratios stood at 0.7 percent for secured retail loans and 1.7 percent for unsecured retail loans as at end-March 2026, unsecured delinquency running at roughly 2.4 times the secured rate. Fintech small-ticket loans, at 6.4 percent, run well above even that unsecured baseline. The segment growing fastest by loan count is also the segment failing at the highest rate.
Gross NPAs are 0.7 percent on secured retail loans and 1.7 percent on unsecured retail loans. Fintech small-ticket loans run at 6.4 percent delinquency.
Housing loans are the boring, safe part of the book
While gold and fintech credit accelerate, the loan category most people would assume drives household debt is doing the opposite: shrinking as a share of the total and getting safer. Housing-loan non-performing assets fell to 0.5 percent in March 2026 from 1.2 percent in March 2019, a segment getting cleaner even as overall household leverage rises. The composition of who takes out that mortgage has also shifted upmarket. Loans with a credit limit of 50 lakh rupees or more now account for 44.7 percent of outstanding housing loans, up from a market once dominated by loans below 25 lakh rupees, which made up 60.6 percent of the book in March 2014.
That is a housing-finance system serving wealthier borrowers with cleaner credit, not a mass-market mortgage boom absorbing new debt. The growth in leverage is happening somewhere else in the household balance sheet entirely.
Banks are chasing the same consumption wave
It is not only fintechs and gold lenders. NBFCs grew consumer-segment credit 22.5 percent year on year to March 2026, against 17.5 percent for scheduled commercial banks. Among banks themselves, public-sector lenders expanded consumer credit 22.6 percent, more than the 12.1 percent private banks managed. Every type of lender in the system, state-owned bank, private bank and NBFC alike, is competing for the same consumption-loan customer, and the least regulated channels are winning the growth race.
How India's debt load compares abroad
None of this makes India an outlier by the standard cross-country yardstick. Among major emerging markets as of September 2025, India's household debt to GDP ratio trails Thailand, Malaysia and China, but exceeds Chile, Brazil and South Africa:
| Economy | Household debt, percent of GDP (Sep-2025) |
|---|---|
| Thailand | 87.3 |
| Malaysia | 69.9 |
| China | 59.0 |
| India | 45.5 |
| Chile | 44.1 |
| Brazil | 36.7 |
| South Africa | 33.6 |
Source: RBI Financial Stability Report, June 2026.
India sits comfortably in the middle of that pack, which is exactly why the composition underneath the ratio is the part worth examining. A middling debt load built on gold pledges and short personal loans behaves differently under stress than the same ratio built on thirty-year mortgages.
The honest objection
The strongest case against reading this as a warning sign is that borrower quality has, if anything, improved. Only 76.8 percent of subprime-rated borrowers stayed subprime in the year to March 2026, meaning 23.2 percent were upgraded, an improvement from 79.0 percent retention (21.0 percent upgraded) in the year to March 2025. Gold loans, too, are secured against a liquid, price-stable asset the lender can seize quickly, which is a different risk animal from an unsecured signature loan. On this reading, faster-growing consumption credit is simply financial inclusion working as intended, reaching borrowers a traditional mortgage-focused bank never would.
That case holds up for gold loans specifically. It holds up less well for the fintech small-ticket segment, where growth and delinquency are rising together rather than growth outrunning risk. A borrower-quality metric that improves at the top of the credit-score distribution can still coexist with a fast-growing bottom segment where a 6.4 percent share of loans is already delinquent. Both things are true in the same report; they describe different borrowers.
The Signal
The story India's household-debt ratio tells at a glance, more leverage, presumably more housing, is not the story the RBI's own breakdown supports. The debt building up fastest is collateralised by gold or extended in small, unsecured, fast-approved tickets, while the mortgage book shrinks in relative share, skews toward wealthier borrowers and keeps getting cleaner. That is not necessarily a crisis. Secured gold lending against a stable asset is a different risk to carry than a defaulting fintech loan book. But it does mean the debt-to-GDP headline is measuring the wrong thing if the question is fragility. Watch the fintech small-ticket delinquency rate in the next report, not the aggregate ratio. That single number will say more about where this credit boom is heading than another point of GDP ever could.
Reporting basis: every figure in this piece, the household debt to GDP ratio, the composition of household borrowings, the gold loan and fintech growth and delinquency rates, the housing loan mix and NPA trend, the lender-type growth comparison, the cross-country household debt comparison and the borrower risk-migration data, comes from a single origin, the Reserve Bank of India's Financial Stability Report published in June 2026, which itself draws on RBI supervisory data and RBI staff analysis of Bank for International Settlements and TransUnion CIBIL data. The gap between unsecured and secured retail NPA ratios, stated as a multiple, is The Signal's calculation from the report's own figures.