India spent the first weeks of 2026 closing two long-pending trade fights. On 27 January 2026, the European Union concluded free trade agreement talks with India that had run on and off for nearly two decades, a deal that matters because the EU was already India's largest trading partner, at €120 billion in goods trade in 2024, 11.5% of India's total trade. Eleven days later, on 6 February 2026, India and the United States reached a framework for an Interim Trade Agreement, under which the US applies an 18% reciprocal tariff on Indian goods pending a full Bilateral Trade Agreement. Two of India's biggest trading relationships, resolved within two weeks of each other. It reads like the year trade diplomacy caught up with trade.
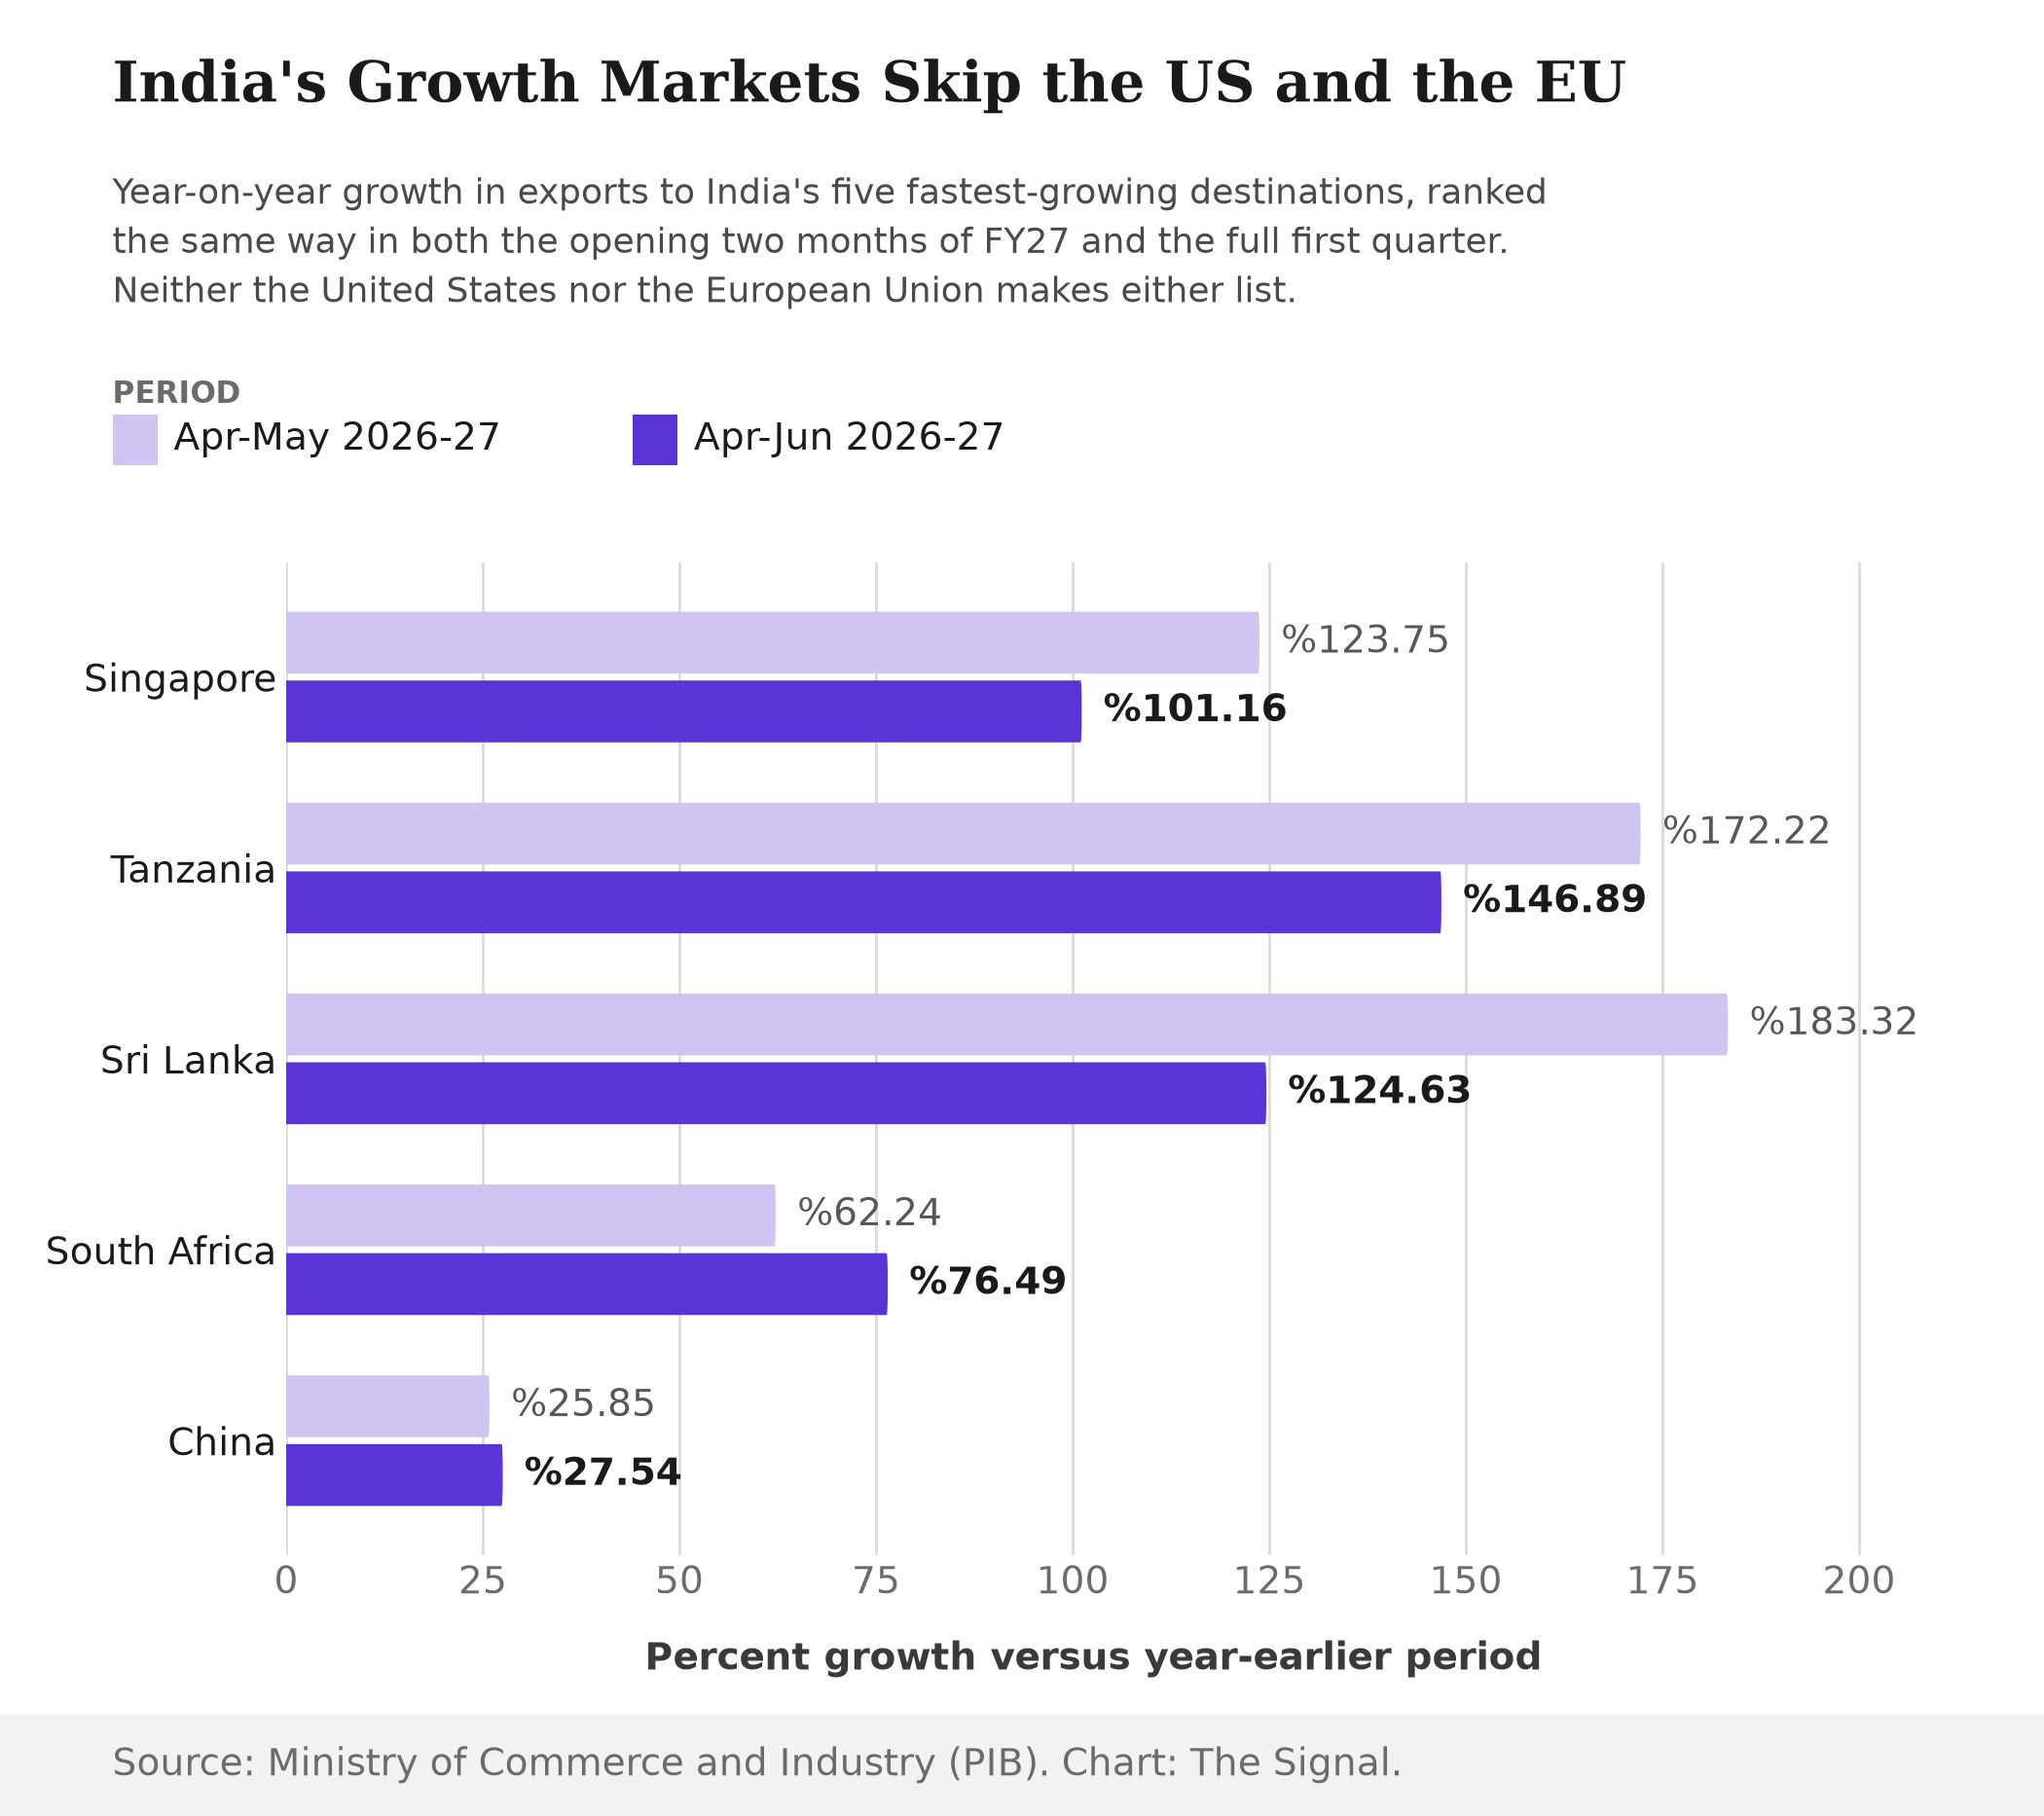
Look at where India's exports are actually growing fastest, and the picture does not match the diplomacy. In April and May 2026-27, the five destinations with the biggest jump in Indian exports by value were Singapore, Tanzania, Sri Lanka, South Africa and China, growing between 25.85% and 183.32% year on year, and none of them was in North America or the EU. That was not a two-month blip. The same five countries, in nearly the same order, led again over the full first quarter of FY27, April through June 2026.
None of India's five fastest-growing export markets is the US or the EU, per the commerce ministry's own ranking.
That absence understates the gap. The USA, India's single largest export destination at 19.5% of the total, grew just 0.5% to $17.29 billion in April-May 2026-27, and the Netherlands, India's largest individual EU destination in the same country-wise data, did not grow at all: exports there fell 25.4% to $3.04 billion. Neither is captured on a bloc-wide basis in the commerce ministry's own releases, since it publishes exports country by country rather than as an EU aggregate, but the country breakdown makes the point starkly: against Singapore's 123.75%, the US barely moved and its biggest individual EU market went backward.
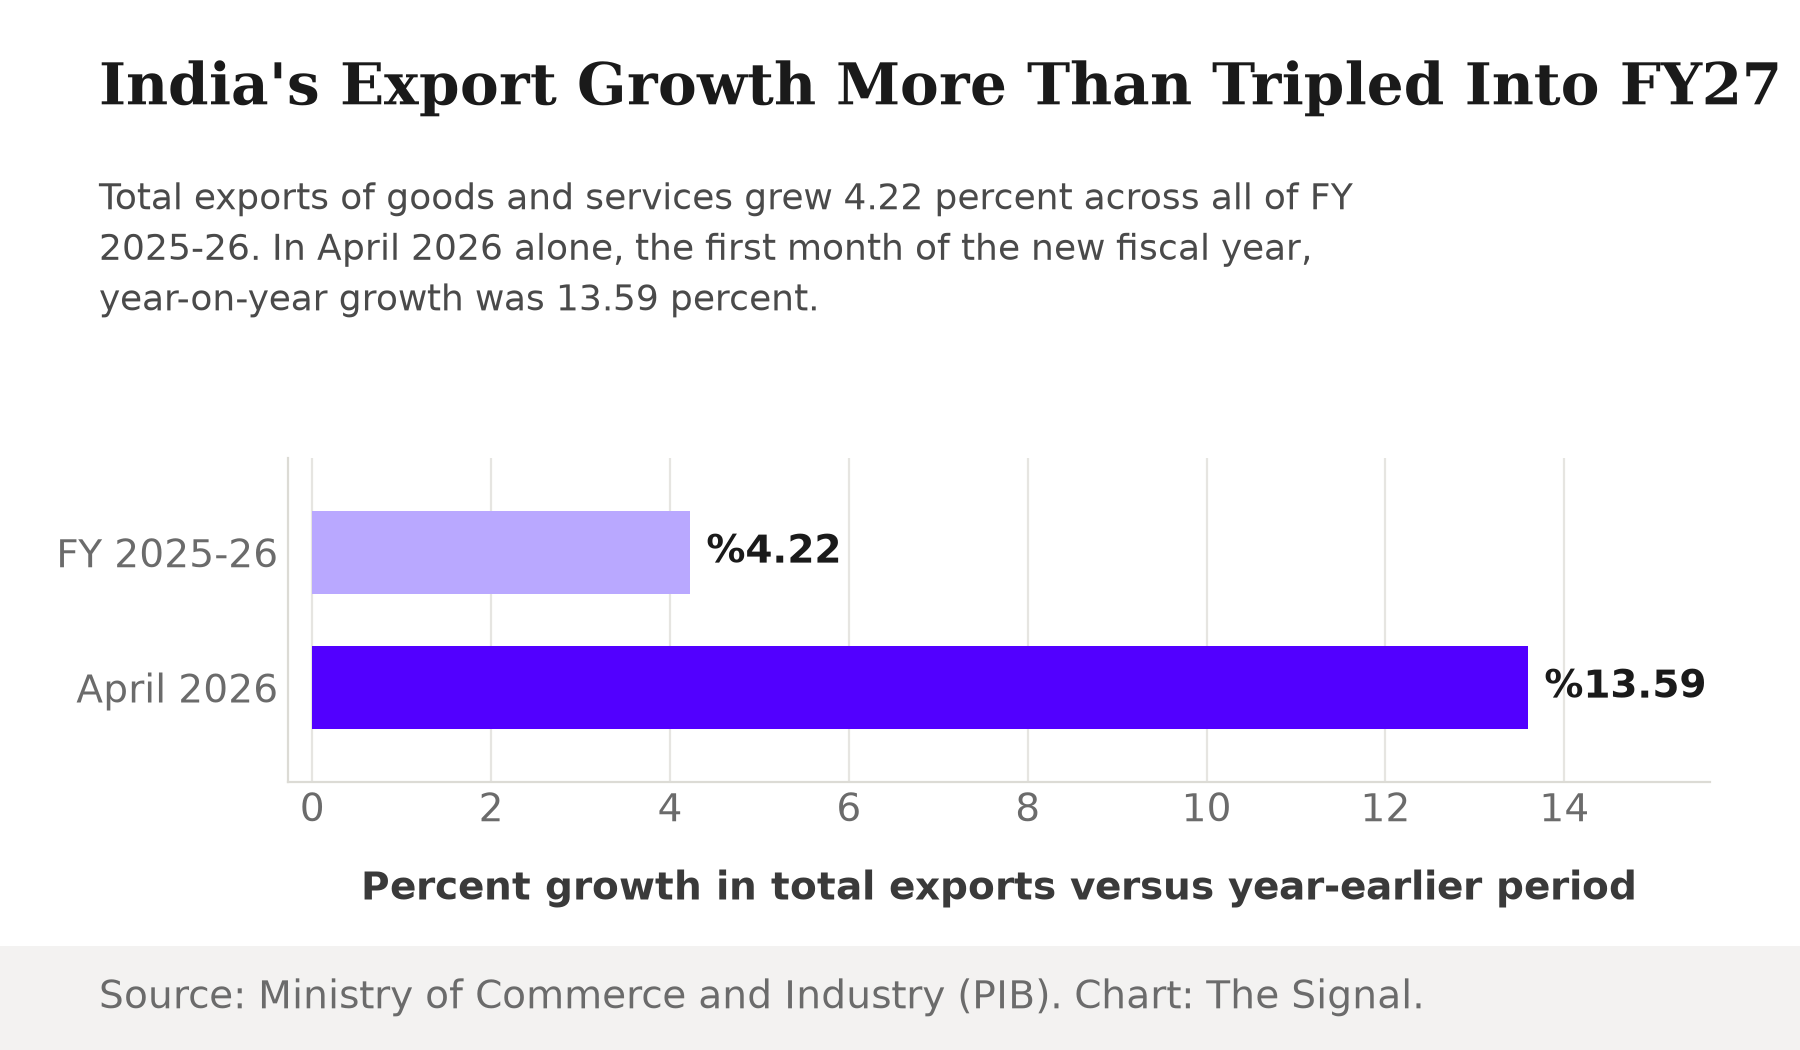
The overall numbers are moving at a pace to match. India's merchandise exports grew 16.09% to $88.91 billion in April-May 2026-27, up from $76.59 billion a year earlier, and total exports of goods and services in April 2026 alone rose 13.59% to $80.80 billion, from $71.13 billion in April 2025. Both figures are far ahead of the 4.22% growth India's total exports posted for the whole of FY 2025-26, when they reached $860.09 billion: April 2026's growth rate alone is more than three times last year's full-year pace.
The list that doesn't move
Singapore led both readings, exports up 123.75% in April-May and still up 101.16% for the full quarter. Tanzania went from 172.22% to 146.89%, Sri Lanka from 183.32% to 124.63%, South Africa from 62.24% to 76.49%, and China from 25.85% to 27.54%. A ranking that survives two overlapping windows, both drawn from the commerce ministry's own monthly releases, is not statistical noise. It is where the demand for Indian goods is actually concentrated right now.
What New Delhi is actually negotiating
None of the five countries carrying India's export growth is a party to a trade deal India has just signed or is actively renegotiating this year. The two relationships that dominated India's trade headlines in 2026 sit elsewhere.
India's fastest-growing export markets are not the ones in its EU or US trade deals.
Sources: European Commission; Ministry of Commerce and Industry, PIB; The White House.
ASEAN's own pact is stalled while ASEAN trade grows
Singapore's surge is not happening inside a freshly updated agreement either. India-ASEAN bilateral trade reached $128 billion in 2025-26, about 11% of India's global trade, a relationship already worth roughly as much as the trade the EU deal governs. Yet the two sides' AITIGA trade-pact review remained unconcluded at its 13th Joint Committee meeting in New Delhi, 6-10 July 2026, the most recent milestone in a renegotiation that has been running for years without a signing date. The bloc supplying one of the five names on India's growth list, Singapore, is the one where the underlying trade agreement is furthest from being refreshed.
The honest objection
The strongest case against reading anything into this is timing. The EU deal concluded on 27 January 2026 and the US framework on 6 February 2026: both were five months old or less by the time the Q1 FY27 export numbers were published, too recent to have moved trade flows yet. Tariff schedules, rules-of-origin paperwork and exporter contracts take quarters, not weeks, to turn into shipments. On this reading, the ASEAN and Africa growth is not a rebuke of the FTA strategy. It is simply what was already growing before the ink dried, and the US and EU gains have not had time to show up in the data.
That case has real force, but it does not explain why the growth is landing precisely in the markets with no new policy attention at all. If the new deals were already shaping exporter behavior, some of that would show up as anticipatory positioning ahead of signature day, since shipping and sourcing decisions get made months in advance. Instead the growth is concentrated in a bloc reviewing an old pact and a scatter of individual countries with no pact news at all. Timing explains why the new deals have not paid off yet, but it says nothing about why the market with the stalled pact is the one paying off right now.
The Signal
The government's trade diplomacy in 2026 has been aimed at the US and the EU, the two partners it has spent real political capital courting. The export growth is aimed somewhere else: at Singapore, Tanzania, Sri Lanka, South Africa and China, a spread of markets with either an unrenewed regional pact or no pact at all. That is a revealed-preference gap sitting inside the trade data itself, regardless of what either side's trade ministers say next. Whether that ASEAN-and-Africa growth is filling India's order books with the same higher-value goods the FTA push is chasing, or with cheaper, thinner-margin trade, is not something these releases break out, and it should not be assumed either way. What is measurable is simpler: a trade policy aimed at Washington and Brussels is being outpaced, for now, by exporters that never waited for either deal to close.
Reporting basis: the April-May and Q1 FY27 export figures, and the destination-level growth rankings, are per the Ministry of Commerce and Industry's trade releases, via commerce.gov.in for the April-May merchandise release and via the Press Information Bureau for the destination rankings, the April 2026 total-trade release, the FY 2025-26 full-year release and the AITIGA Joint Committee meeting release. The USA and Netherlands growth figures are from the same release cycle's DGCIS country-wise export table. The EU-India FTA's conclusion date and the EU's 2024 trade share are from the European Commission's own trade policy page. The US-India framework and its tariff terms are from the White House's joint statement with the Government of India. The acceleration comparison between FY 2025-26's full-year growth and April 2026's growth, and the persistence comparison between the April-May and April-June destination rankings, are The Signal's calculations from those releases.