Today, 14 July 2026, India's Ministry of Statistics and Programme Implementation (MoSPI) released the first monthly trial readings of a number that has never existed before: the Index of Services Production (ISP). MoSPI's FAQ release, carried by the Press Information Bureau, states that the trial indices cover the whole of FY2025-26 plus the freshest month, April 2026, and that regular monthly releases will follow with a lag of about 60 days. The pitch is straightforward: India's largest sector finally gets the kind of monthly pulse that factories and mines have had for decades through the Index of Industrial Production, or IIP.
MoSPI's own provisional GDP estimates put that pitch in scale. In FY2025-26, services generated ₹170.8 lakh crore of India's ₹314.9 lakh crore in gross value added, about 54%, against a combined ₹60.8 lakh crore, roughly 19%, from the mining, manufacturing and electricity sectors the IIP tracks. Services alone are close to three times the size of everything the IIP measures.
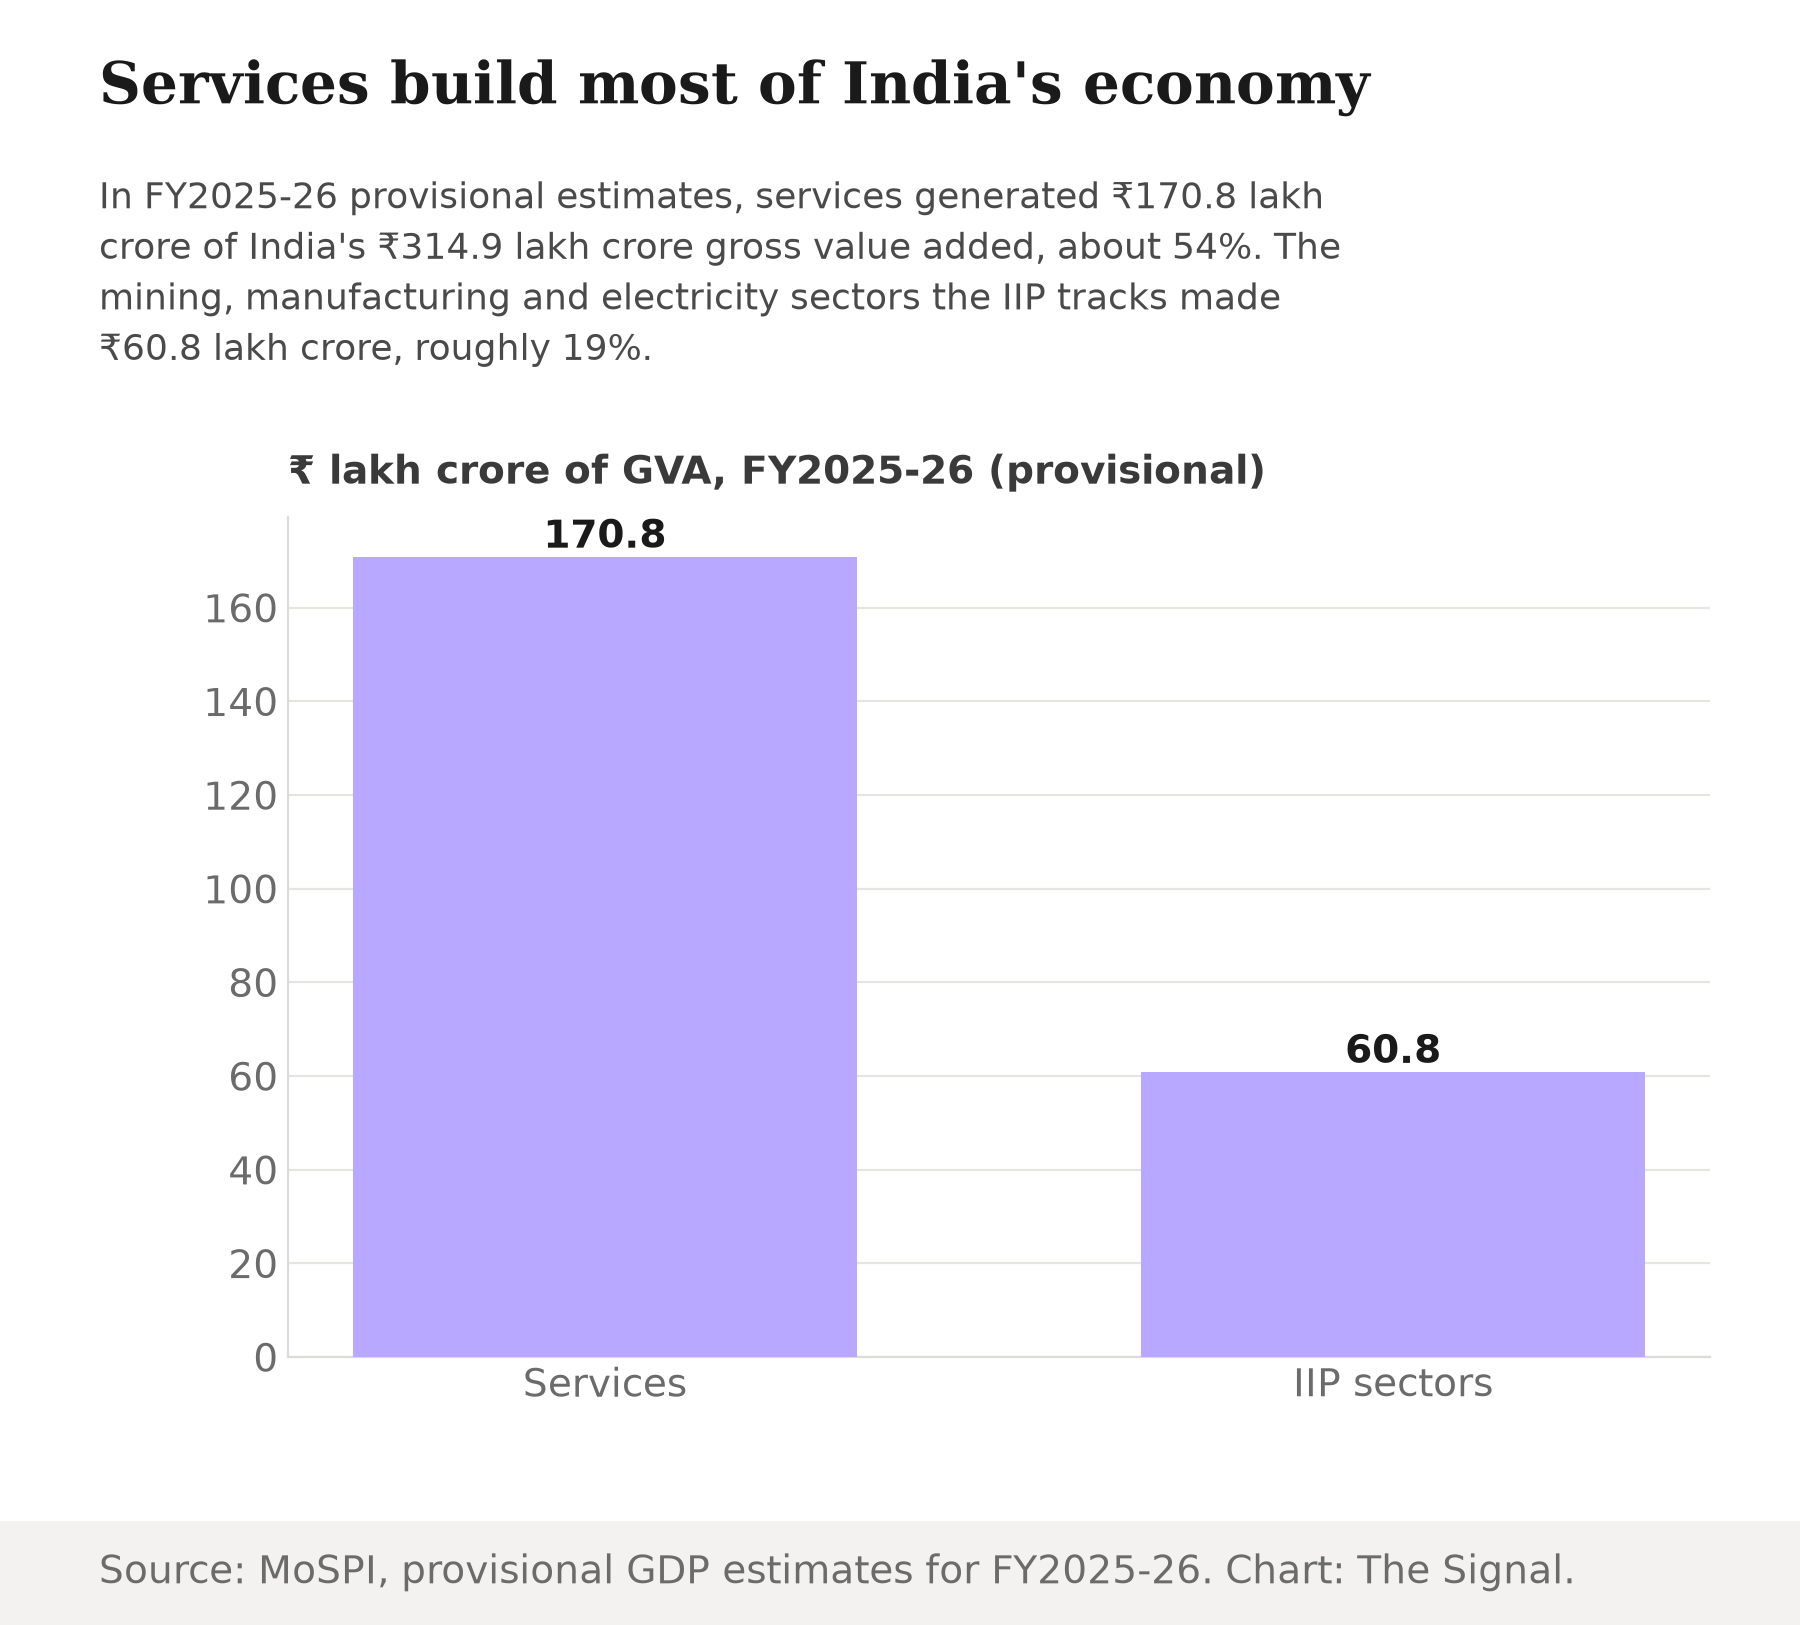
Source: MoSPI's provisional GDP estimates, Q4 2025-26 and PE FY2025-26. Chart: The Signal.
It is worth slowing down on that gap, because it is not simply a missing data release. For decades, the monthly story of how India's economy is doing has run almost entirely on the IIP, MoSPI's sole monthly production series. The half of the economy that actually carries it had no monthly equivalent until this morning.
The index that has anchored the conversation
Even the narrow slice the IIP does track is not evenly spread. MoSPI's IIP methodology manual sets mining's weight at 13.37% and electricity's at 7.99%, based on 2011-12 sectoral GVA shares, leaving manufacturing with the remaining roughly 78.6% of the index by construction. The "industrial" index that has anchored India's monthly growth conversation is, in practice, mostly a manufacturing index with two small riders attached, and that whole index tracks under a fifth of the economy to begin with.
What it lacks in breadth it makes up for in speed. Effective April 2025, MoSPI cut the IIP's release timeline from 42 days to 28 days after the reference month, moving the release date from the 12th to the 28th of every month. Against that, the ISP's roughly 60-day lag looks less like a rival cadence than a first attempt still catching up.
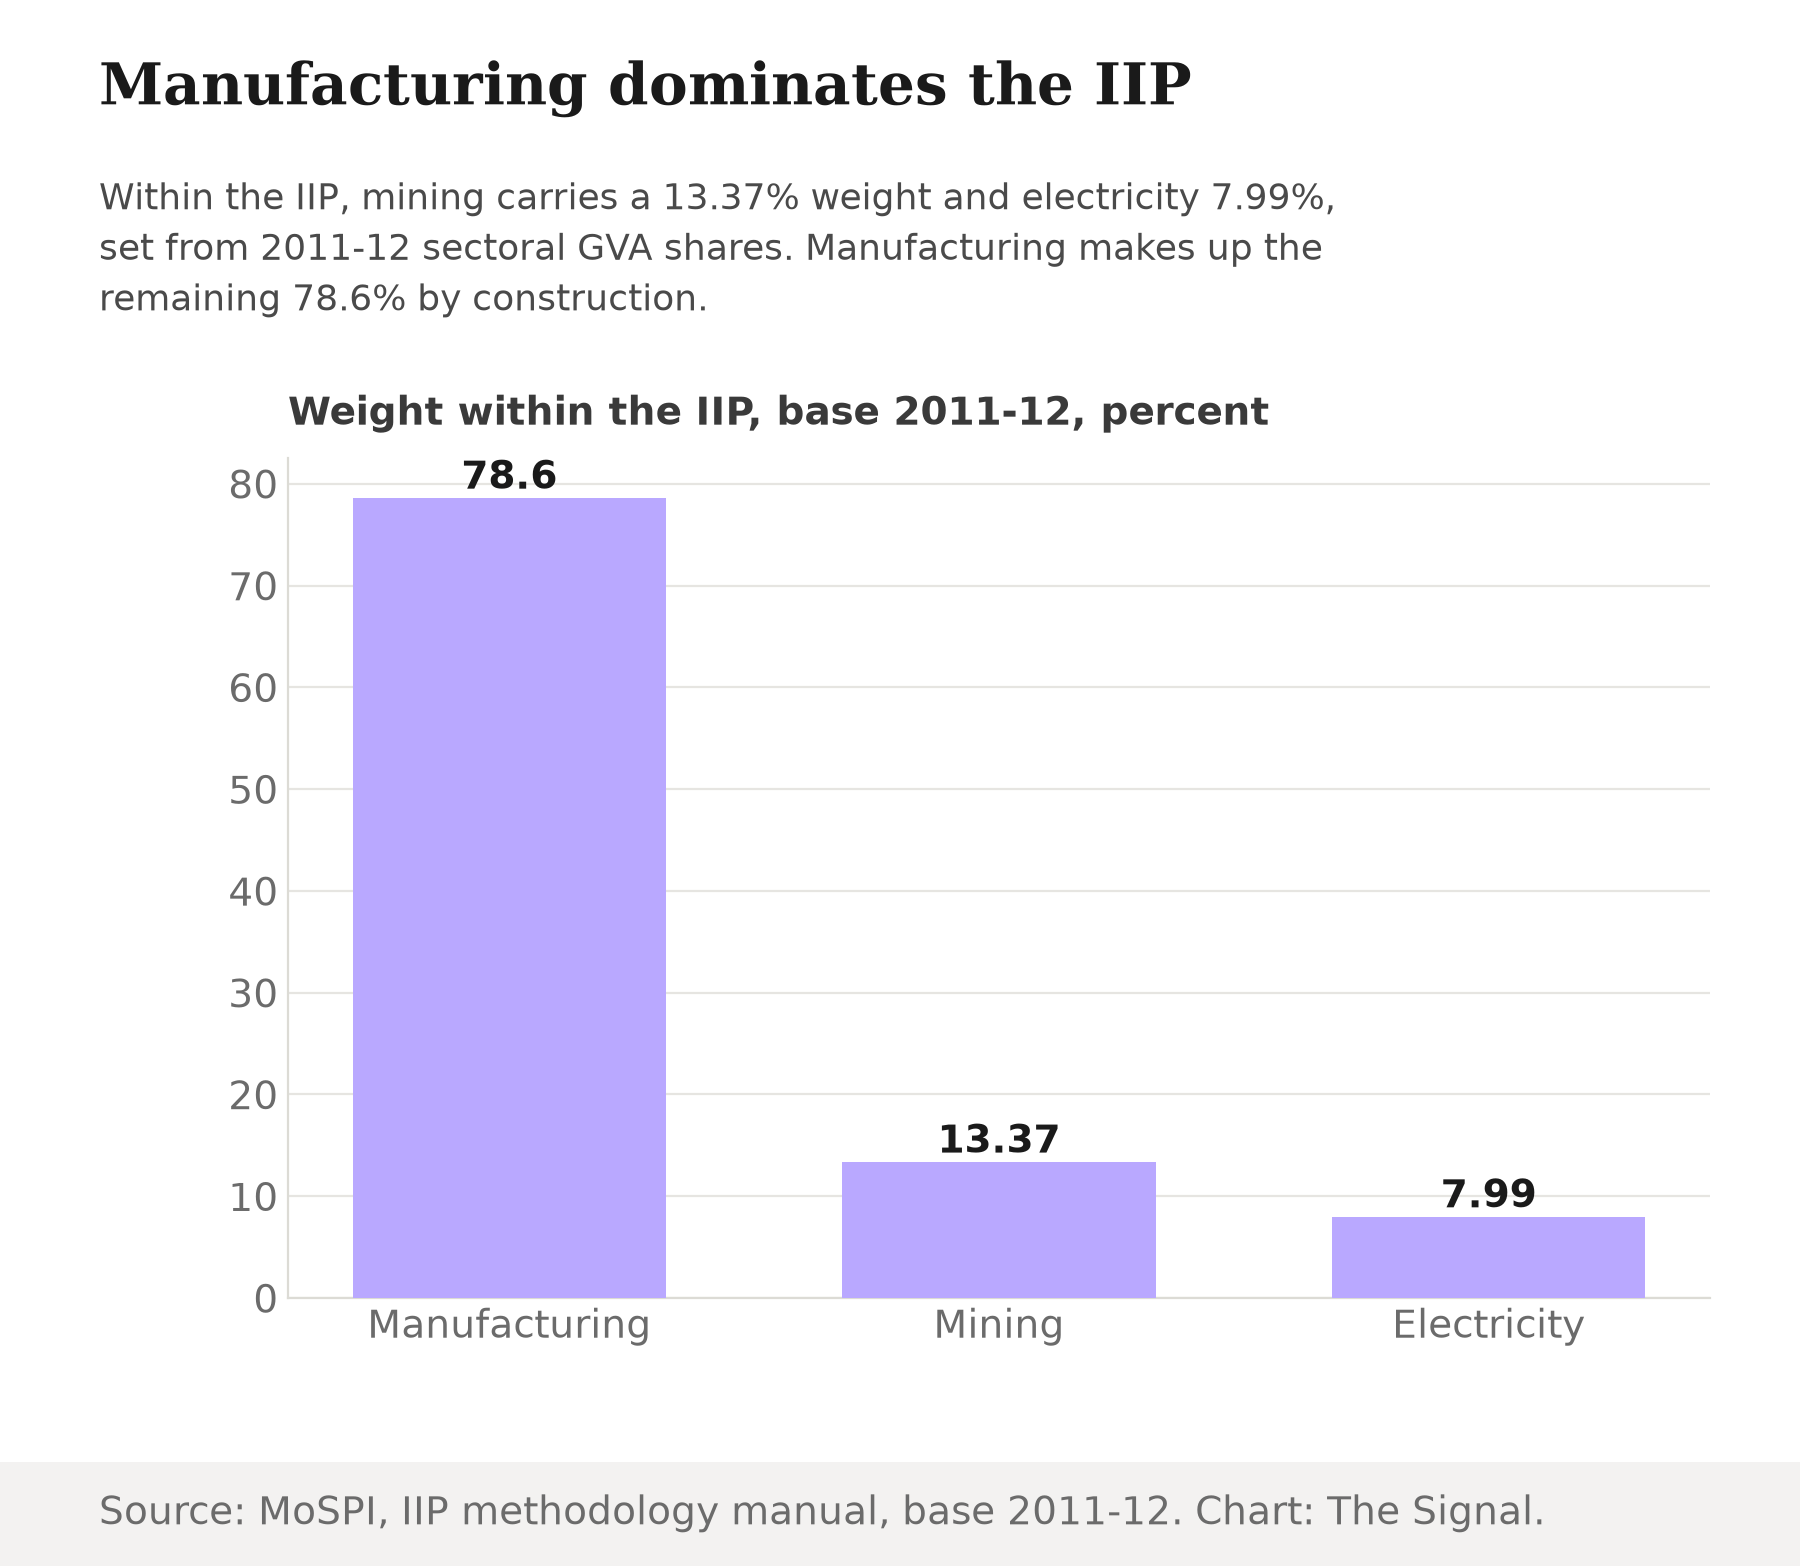
Source: MoSPI's IIP methodology manual. Chart: The Signal.
What the new index still cannot see
The ISP exists because a data source finally caught up with the sector. MoSPI's approach-paper press release describes a 24-member Technical Advisory Committee that spent from May 2025 building the ISP approach paper. The committee leaned on GST outward-supply data, collected since the tax's 1 July 2017 rollout, as the backbone data source that was not available the last time MoSPI tried to build a services index. That mechanism explains both why the ISP is arriving only now, and why, even now, it cannot cover everything.
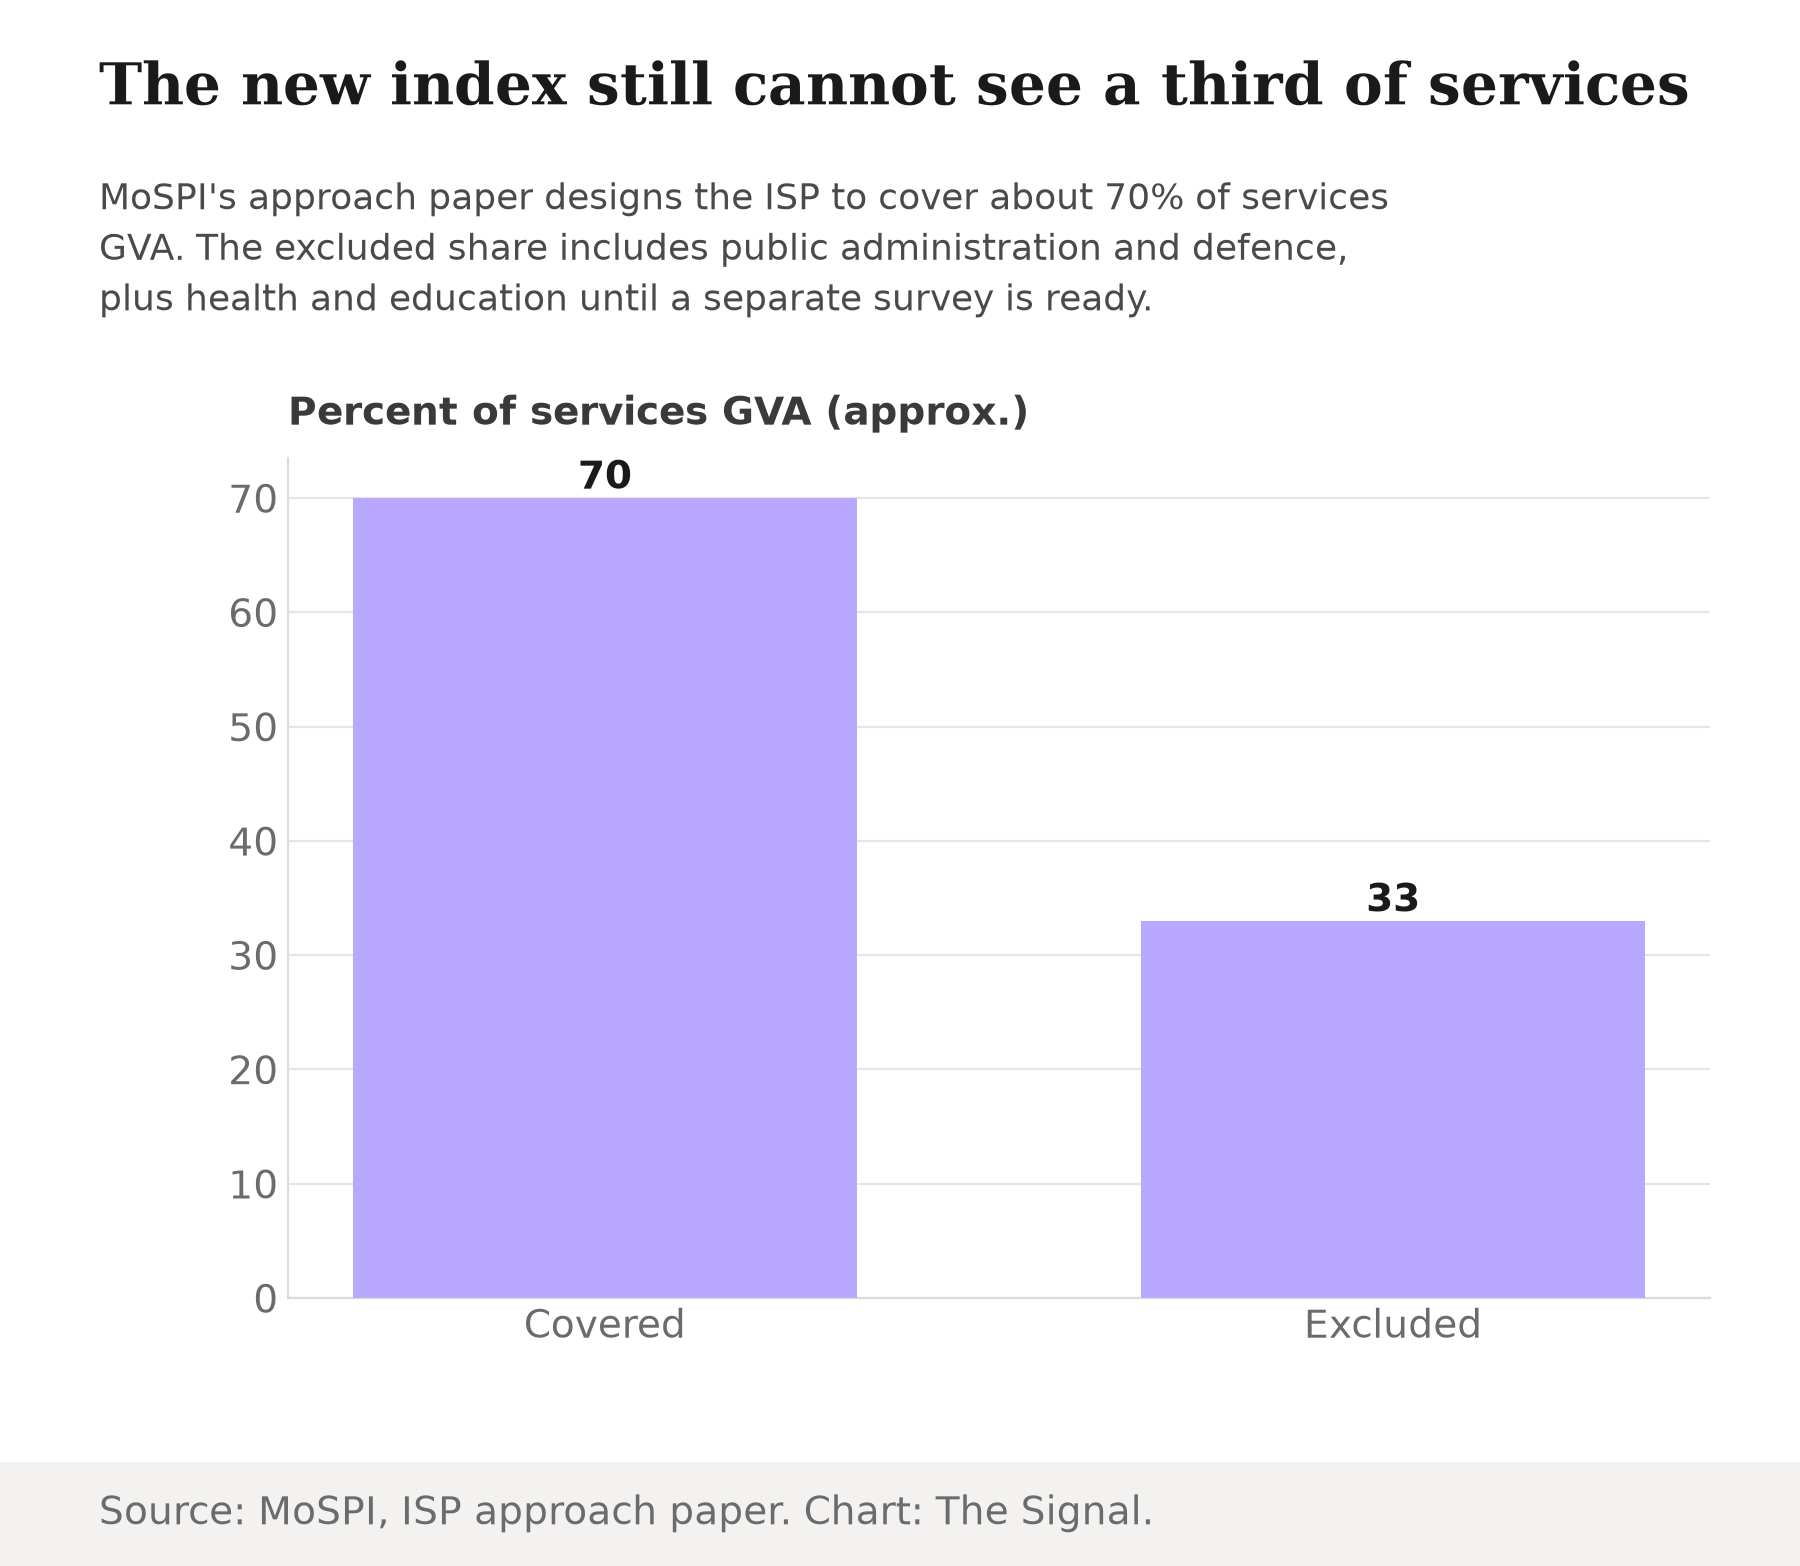
Source: MoSPI's ISP approach paper. Chart: The Signal.
How the two indices compare, now that both exist.
| Metric | IIP (industrial) | ISP (services) |
|---|---|---|
| Share of GVA it tracks | About 19%, from mining, manufacturing and electricity | About 70% of the 54% services share |
| Base year | 2011-12 | 2024-25 |
| Backbone data | 2011-12 sectoral GVA weights across three sub-sectors | GST outward-supply data, collected since 1 July 2017 |
| What sits inside it | Manufacturing alone is about 78.6% of the index; mining and electricity are minor riders | Multiple GST-based service categories; public administration, defence, and (for now) health and education fall outside |
Figures: IIP base year and weights from MoSPI's IIP methodology manual; ISP base year and schedule from MoSPI's FAQ release; ISP backbone data from MoSPI's approach-paper press release; ISP coverage and exclusions from MoSPI's ISP approach paper.
The honest objection
The strongest case for patience is that this is normal sequencing, not a shortfall. MoSPI's own release describes the 24-member Technical Advisory Committee holding several deliberations over the past year before this release. GST data, whatever its gaps, is a far richer real-time proxy for services activity than anything MoSPI had when it last tried to build this index. Seventy percent coverage is also a genuine gain, up from zero percent measured monthly before today.
That case holds for why the ISP looks the way it does. It holds less well for treating the gap as small. Public administration, defence, and, for now, health and education are excluded not because they are minor but because GST records and administrative data do not reach them. These are exactly the categories where a reader would want a monthly view rather than an annual one, especially government spending and, in health's case, anything resembling a public-health shock. And the sector the IIP already claims to speak for turns out to be narrower than its name suggests too: mining and electricity together add up to barely a fifth of the IIP's own weight, with manufacturing carrying the rest. Neither index, read carelessly, is quite what its name implies.
The Signal
The measurement gap between how large services are and how closely they were watched narrowed today. It did not close. Services are about 54% of India's economy against roughly 19% for everything the IIP tracks, and the new index built for the bigger sector starts at about 70% coverage of it, still labelled trial, not a finished series. Two things are worth watching over the next year: whether that excluded third shrinks as ASISSE data arrives for health and education, and whether the ISP graduates from trial status into a settled monthly release the way the IIP already is. Until then, judge any monthly India growth headline by which index it is quoting, and how much of the economy that index was ever built to see.
Reporting basis: every figure in this piece originates from MoSPI, drawn from six separate primary releases, so it rests on a single institutional origin. The 14 July 2026 launch details and release schedule are from MoSPI's FAQ release on the ISP, carried by the Press Information Bureau. The GVA shares for services and for the sectors the IIP tracks are from MoSPI's provisional GDP figures for FY2025-26. The IIP's internal sector weights, base year, and current release timeline are from MoSPI's IIP methodology manual and its press release on the reduced release timeline. The Technical Advisory Committee's timeline and its reliance on GST data are from MoSPI's press release on the ISP approach paper. The ISP's coverage share and its exclusions are from MoSPI's ISP approach paper itself. No figure here is a Signal calculation beyond the plain "close to three times" comparison stated directly from cited numbers in the same passage; all underlying figures are as stated in MoSPI's documents.