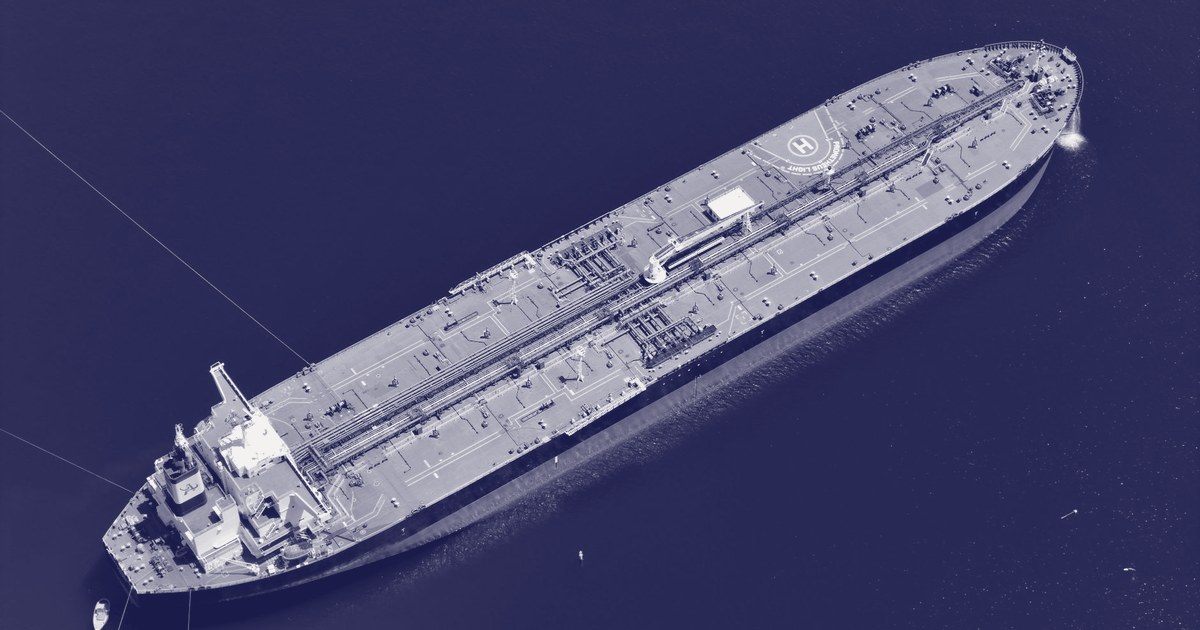
In early July 2026, Iran struck three commercial tankers in the Strait of Hormuz, and the United States answered by striking roughly 90 Iranian military targets overnight, up from about 80 the night before, aimed explicitly at degrading Iran's ability to attack commercial shipping. The strait was left partially blocked. The read that followed was immediate and, on the surface, reasonable: a fifth of the world's oil consumption and more than a quarter of all seaborne oil trade move through that one channel, and Asia's biggest economies are the ones that depend on it most. India, the world's third-largest oil importer, looked like it was sitting directly in the blast radius.
It is worth slowing down on that. The strait matters enormously to the oil shipped through it, but far less to the oil that actually reaches India.
In June 2026, Indian refiners took in a record about 2.70 million barrels a day of Russian crude, just over half of the country's total 4.9 million bpd of crude imports that month. Set those two figures side by side and the share is about 55%, up sharply from 36.5% in May, as refiners turned to Russian barrels to offset the disruption in the strait. Russian crude reaches India from Black Sea and Baltic ports, sailing west around Africa or through Suez, a route that never enters the Persian Gulf at all. A war fought over a chokepoint on the Gulf is, for more than half of India's oil, a war fought somewhere else entirely.
The strait everyone is watching
The alarm is not misplaced as a statement about the world. The Strait of Hormuz carries about one-fifth of global petroleum liquids consumption and more than a quarter of all global seaborne oil trade, a share that held through 2024 and the first quarter of 2025, the most recent period the US Energy Information Administration has measured it. And the oil that does move through the strait is overwhelmingly bound for Asia. Eighty-two percent of the crude oil and condensate that passed through Hormuz in 2022 went to Asian markets, and just four buyers, China, India, Japan and South Korea, accounted for 67% of all Hormuz crude flows in 2022.
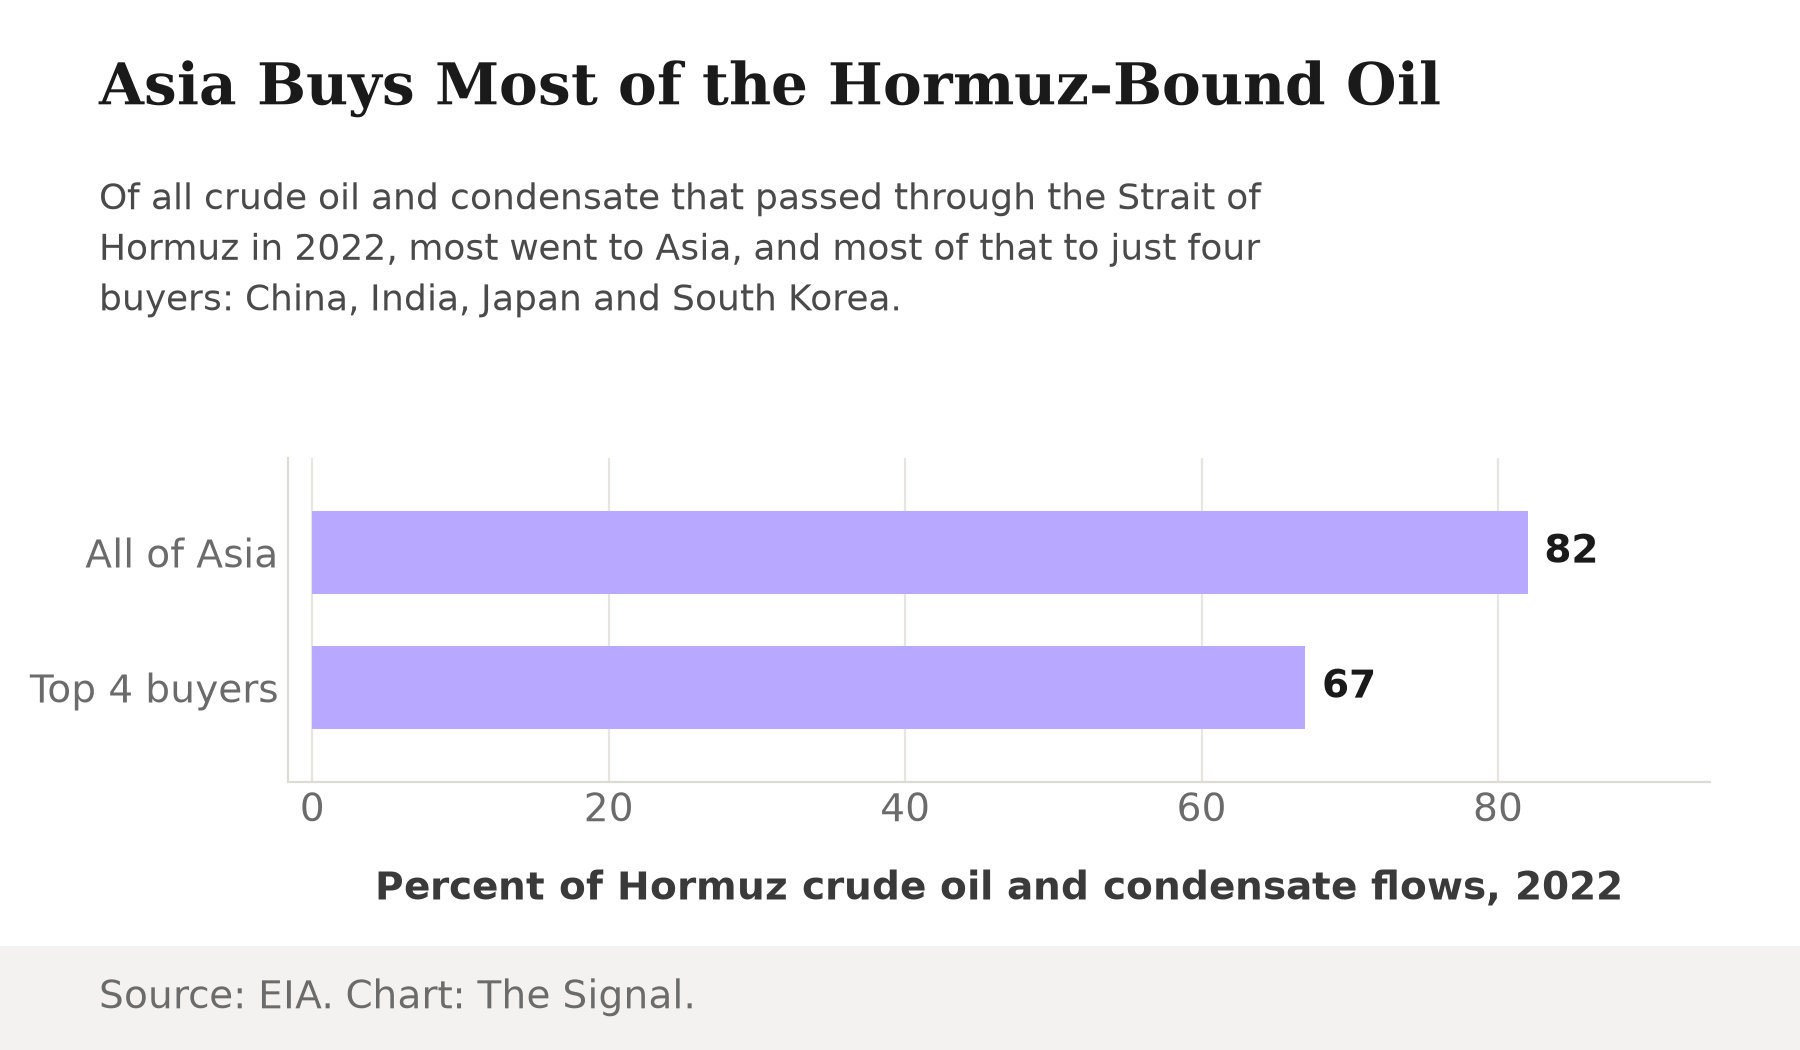
Source: US Energy Information Administration. Chart: The Signal.
That is the picture that makes India look exposed. It is also three years old, drawn from a world before India's own import mix moved as far as it has.
India already rebuilt its own supply map
As recently as 2021, Russia supplied just 2.5% of India's crude oil and condensate imports. Sanctions on Russian oil after its invasion of Ukraine, and the discounted barrels that followed, changed that fast: by 2023, Russia's share had jumped to 39%, with Iraq supplying 19% and Saudi Arabia 16%, and the Middle East as a whole accounting for 45% of India's 4.5 million bpd of total crude imports in 2023. The July 2026 Hormuz disruption did not start that shift. It accelerated a trend that was already five years old.
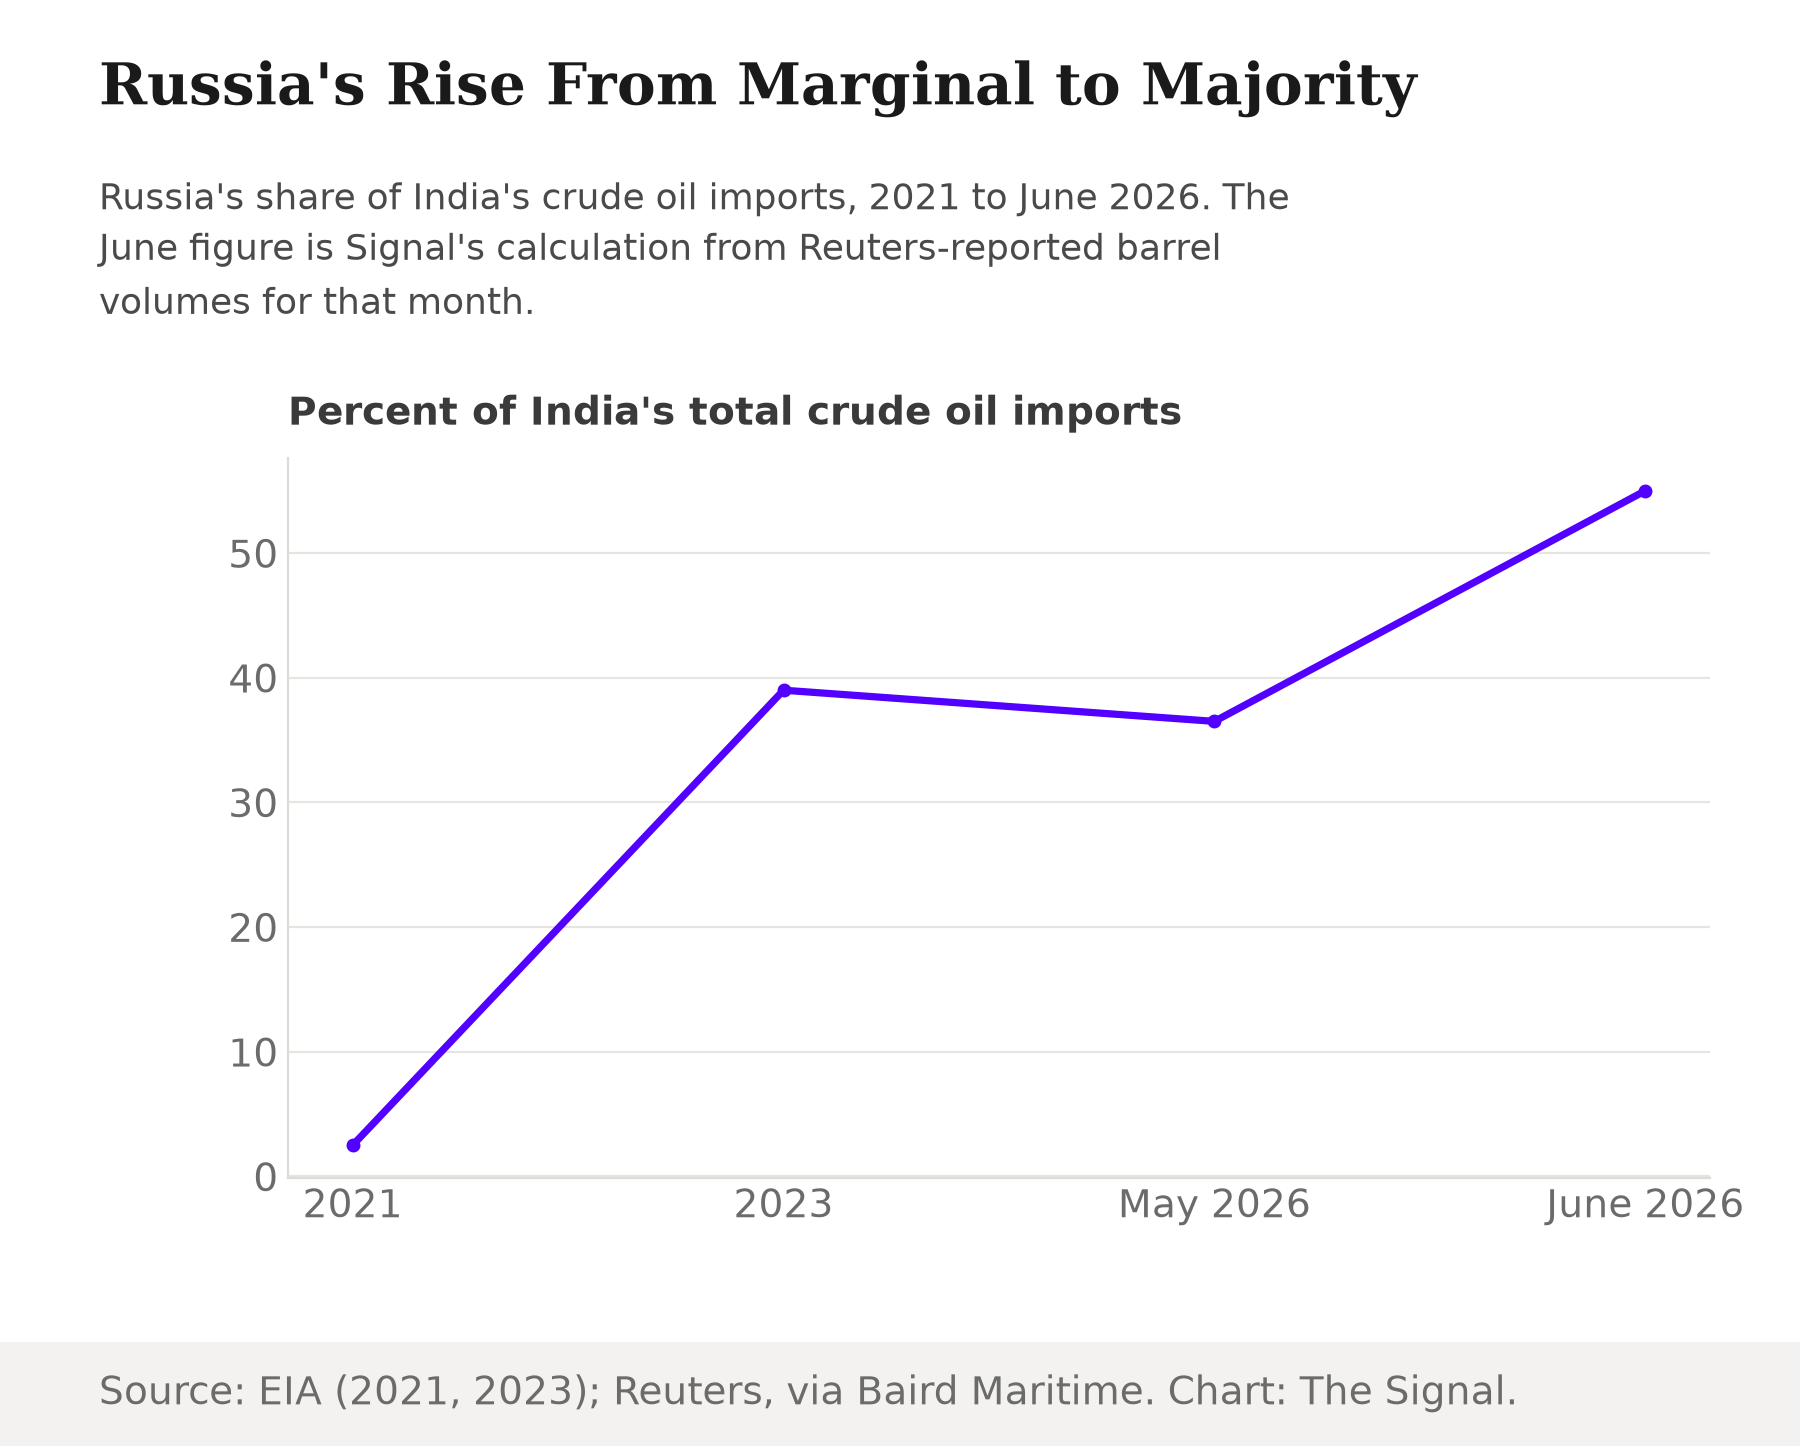
Source: EIA Country Analysis Brief: India (2021, 2023); Baird Maritime, citing Reuters (May, June 2026). June 2026 figure is The Signal's calculation. Chart: The Signal.
The mirror image of that rise is a Middle East that has been steadily edged out. By March 2026, Middle Eastern crude supply to India had plunged 61% to 1.18 million bpd, dragging India's OPEC-sourced share of its crude imports down to a record low of 29%, even as India's total crude imports held at 4.5 million bpd that month. The slide kept going into June. India's Saudi Arabian crude imports fell further, from about 1 million bpd in February to just 330,000 bpd in June. Iraqi crude, roughly a fifth of India's imports in February, all but vanished from the mix for three months, before the first Basrah-loaded cargo finally reached India's west coast in late June.
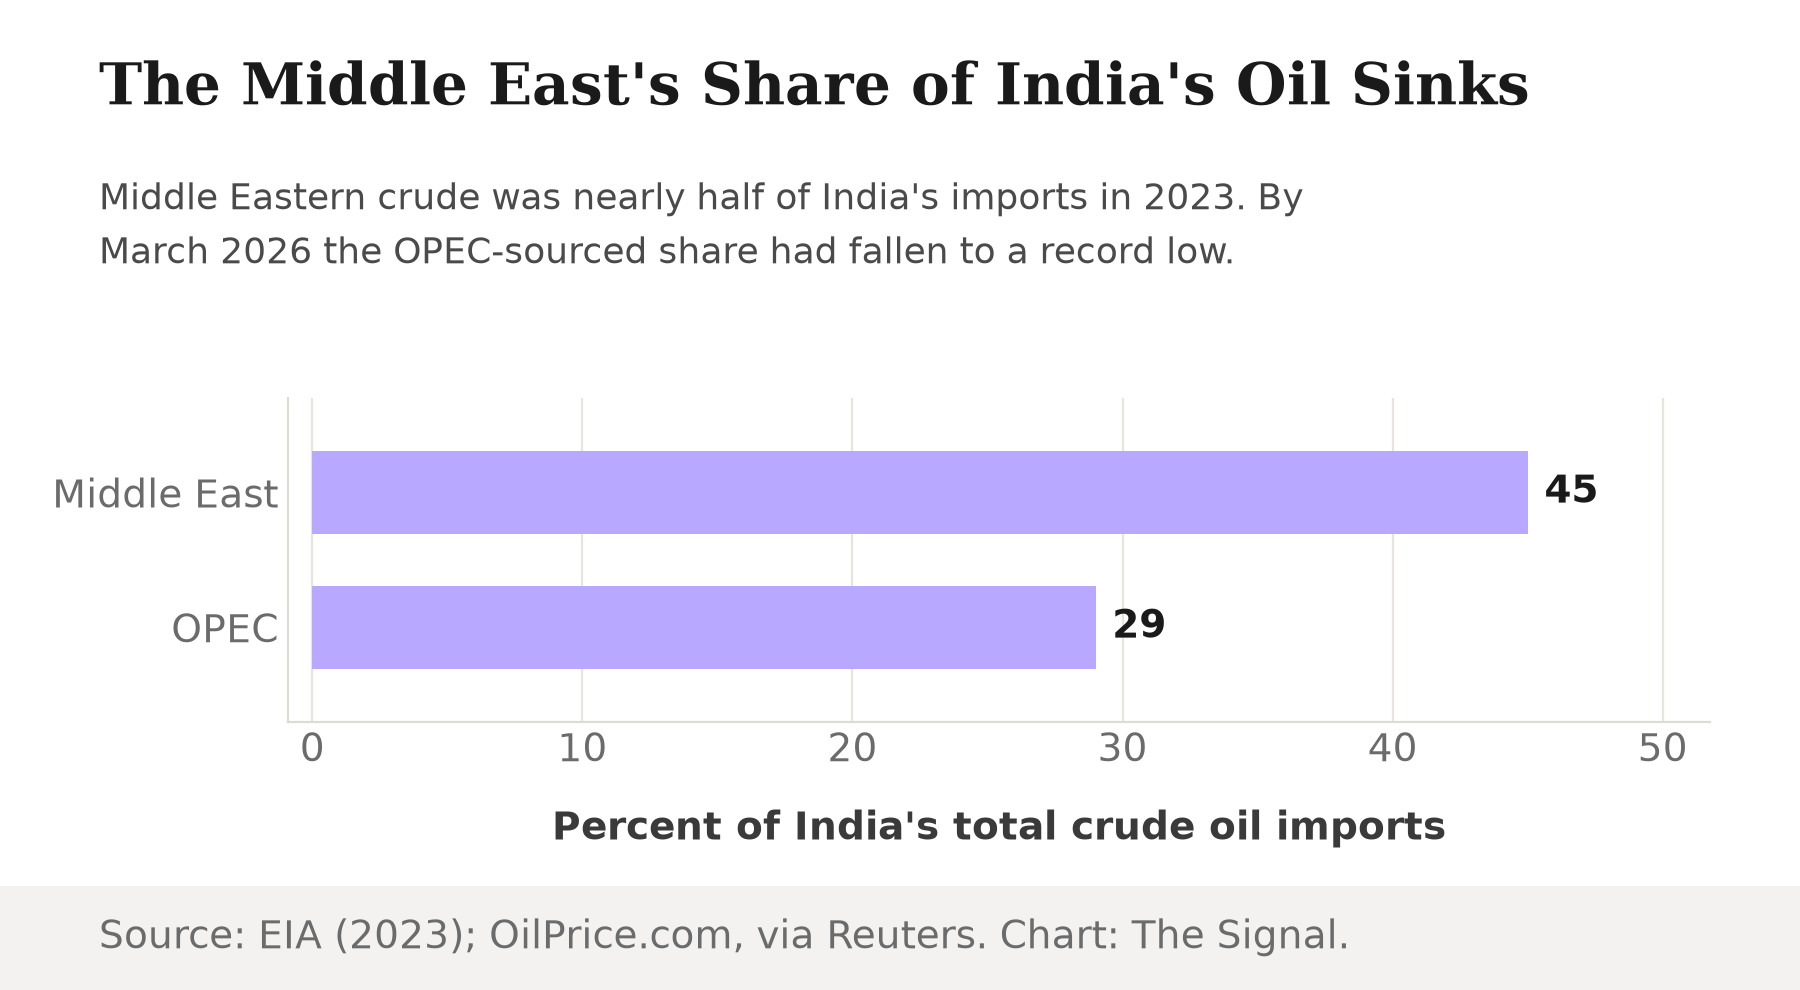
Source: EIA Country Analysis Brief: India (2023); OilPrice.com (March 2026). Chart: The Signal.
Russia's share of India's oil more than doubled between 2023 and June 2026, while the Middle East's share sank to a record low.
| Period | Metric | Share of India's crude imports |
|---|---|---|
| 2021 | Russia | 2.5% |
| 2023 | Russia | 39% |
| 2023 | Middle East | 45% |
| March 2026 | OPEC (record low) | 29% |
| May 2026 | Russia | 36.5% |
| June 2026 | Russia | about 55% |
Source: EIA Country Analysis Brief on India (2021, 2023 figures); Baird Maritime, citing Reuters (May, June 2026); OilPrice.com, via Reuters-sourced shipping data (March 2026 OPEC share). The June 2026 figure is The Signal's calculation from the Reuters-reported barrel volumes for that month.
Two numbers in that table carry the thesis. Russia went from a rounding error to nearly matching the Middle East's old share in two years, then kept climbing once the strait itself came under fire. The Middle East, still the region every headline associates with India's oil, is down to a little more than a quarter of India's crude imports, an OPEC-sourced share the country has not seen before.
The honest objection
The case that India remains exposed is real, and it does not rest on the routing of any single tanker. Asia does not need a barrel bound for an Indian port to be blocked for the blockage to cost India money. Eighty-two percent of everything that moves through Hormuz still goes to Asia, and a prolonged closure would tighten the global benchmark that every barrel India buys, Russian or otherwise, is priced against. That mechanism is not hypothetical: Brent crude gained about 5% over the week of the early-July tanker strikes and the US retaliation, closing near $76 a barrel on July 10, with the conflict cited as the reason prices stayed elevated even as they eased that day. India also has more riding on that global price than almost anyone: India accounted for 25% of all global oil consumption growth over 2024 and 2025, surpassing China as the single largest driver of the world's oil demand growth. A country that big a swing factor in global demand cannot fully insulate itself from a global price shock just by changing suppliers.
That case explains why oil markets moved on the news of the July strikes. It does not restore the old picture of India's physical supply chain. Hormuz has become a price mechanism for India rather than a volume one: the strait can stay a flashpoint for the world's oil market without being the pipe the bulk of India's own barrels flow through.
The Signal
The 2026 Hormuz crisis arrived at an India that had already rewired the bulk of its own supply chain, largely for a different reason: price, not politics. That rewiring does not make India immune. It makes India's exposure indirect: a Hormuz closure now shows up in India's import bill as a higher price paid to Russia, Iraq, Saudi Arabia or anyone else selling into a tighter market, not as a missing tanker at an Indian port. Watch what happens to Russia's discount as the war drags on. That discount was already widening again by July 1, to below $7 a barrel under dated Brent from about $4 ten days earlier, as competition for Indian refiners' business picked back up. If Moscow's barrels keep undercutting the global price by a wide enough margin, India's shift away from the Gulf keeps compounding regardless of what happens in the strait. If that discount narrows because Russia's own exports get squeezed, India loses the one lever that has kept the war's price shock from becoming a supply shock too. Either way, the number to watch next is not how many tankers move through Hormuz. It is how many barrels still show up with a Gulf label on them.
Reporting basis: the June 2026 Russian crude volumes and India's total import figures for May and June 2026 are per Reuters, as reported by Baird Maritime, citing Kpler and LSEG ship-tracking data. The March 2026 Middle East and OPEC supply figures, and India's June 2026 Saudi Arabian and Iraqi import figures, are per Reuters-sourced shipping and industry tracking data, as reported by OilPrice.com. The Strait of Hormuz's share of global oil trade and consumption, its 2022 Asia-destination breakdown, India's 2021 and 2023 crude sourcing mix, and India's share of global oil consumption growth over 2024 and 2025 are all from the US Energy Information Administration. The July 2026 tanker strikes and US retaliation are per PBS NewsHour's reporting, citing US Central Command. The Brent price move over the week of the strikes is per Trading Economics. The July 2026 Urals-to-Brent discount for Indian deliveries is per Reuters, as reported by Baird Maritime, citing trader sources. India's June 2026 Russian import share and the combined figures in the table are The Signal's calculations from those reported volumes.