On 2 July 2026, Union Petroleum Minister Hardeep Singh Puri disclosed that state-run oil marketing companies lost Rs 74,781 crore selling petrol, diesel and LPG below cost between April and June 2026, as crude prices spiked in the West Asia conflict. The government has been managing the shock on more than one front. A Ministry of Petroleum and Natural Gas briefing on 11 March 2026 said diversified procurement had pushed about 70 percent of crude imports onto routes outside the Strait of Hormuz, up from about 55 percent earlier. India's total daily crude consumption is about 55 lakh barrels. And on 27 March 2026 the government cut the domestic excise duty on petrol and diesel by Rs 10 a litre while imposing export duties of Rs 21.50 a litre on diesel and Rs 29.50 a litre on jet fuel, to keep supply at home. Underneath all of it sits a number that has never been higher: crude oil import dependency reached 88.3 percent of consumption in FY2024-25, the Petroleum Planning and Analysis Cell's official data show. Read that run of facts in sequence and the conclusion looks obvious: India has never been more exposed to an oil shock.
It is worth slowing down on that. Strip the import-dependency ratio out and ask a different question: how much oil does the Indian economy actually need to produce a given unit of output. The answer has moved sharply the other way.
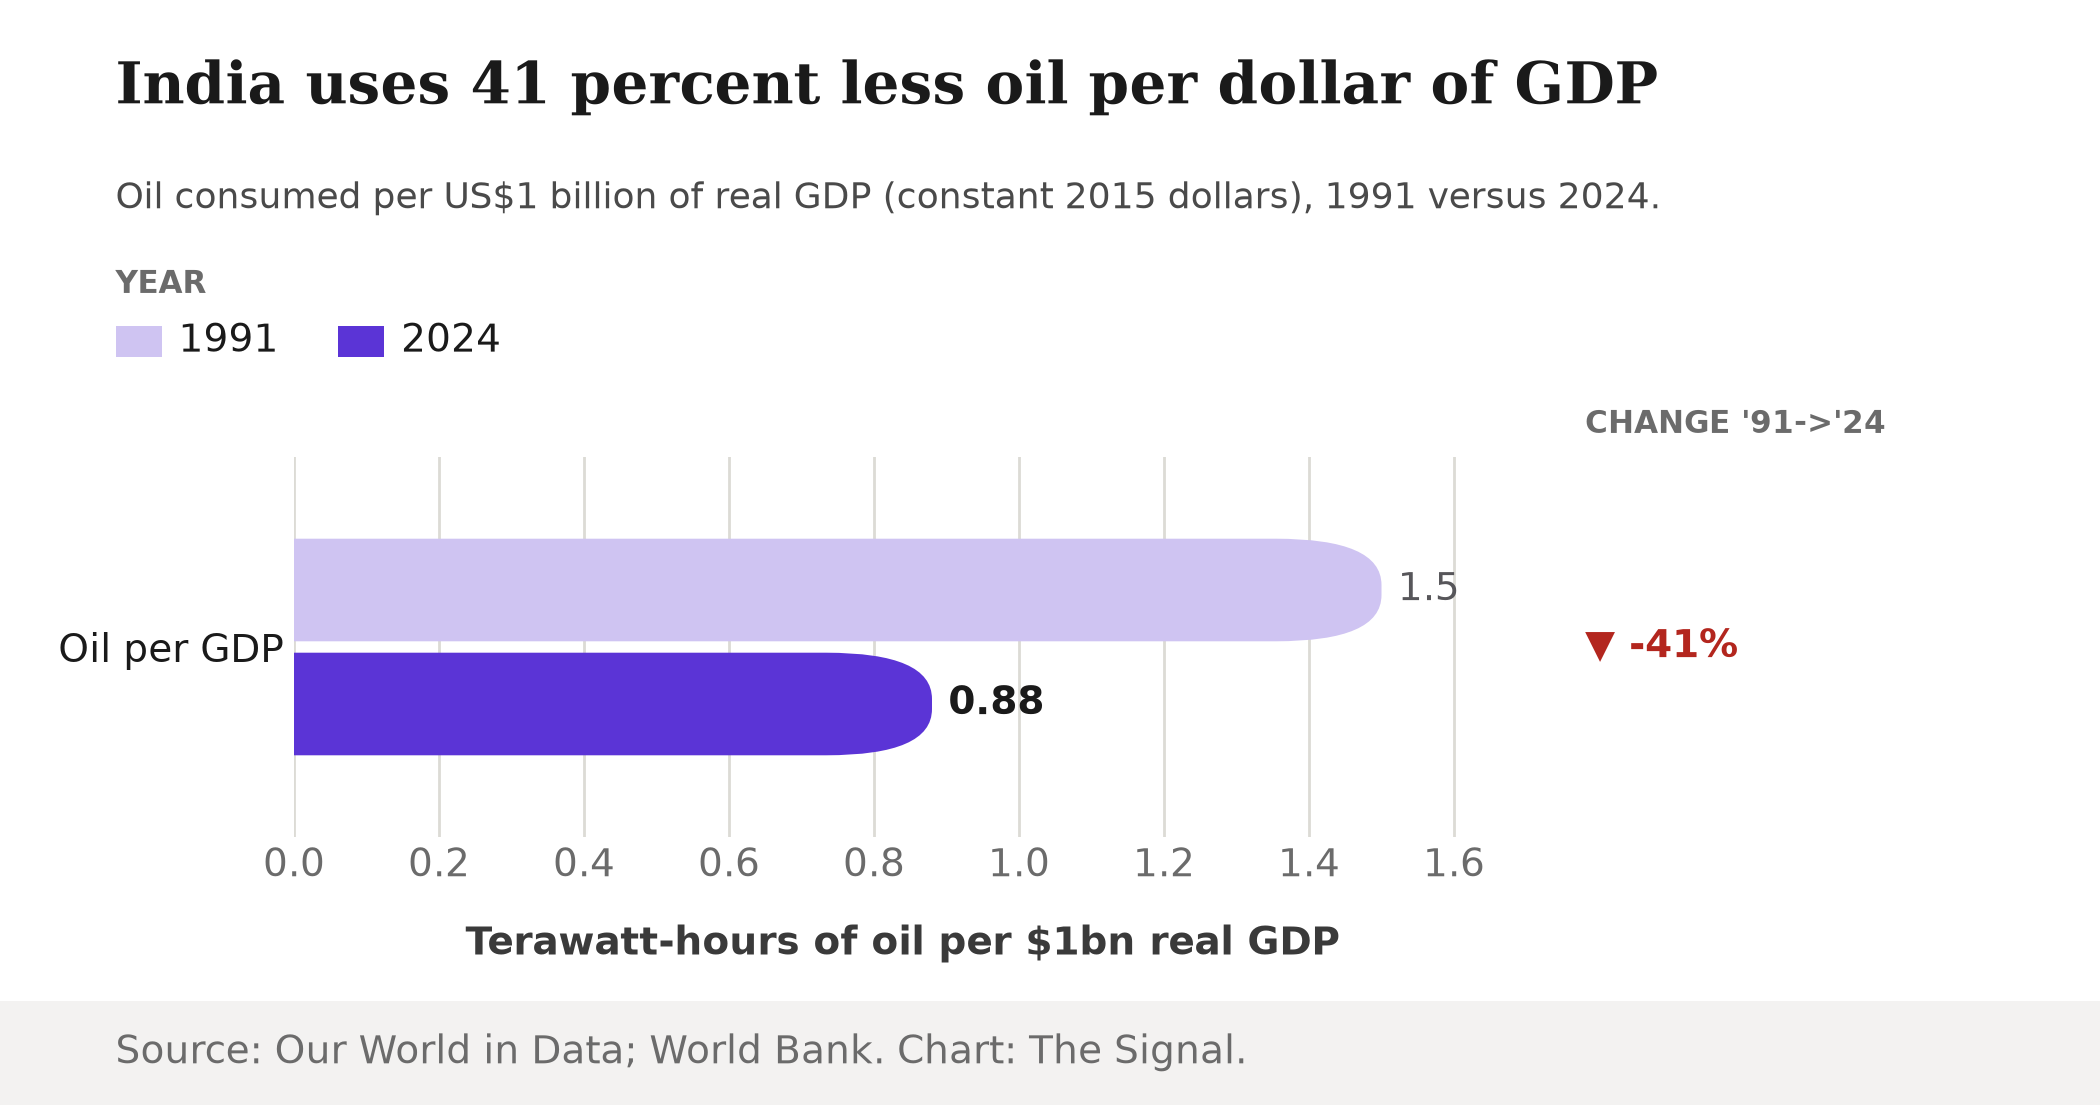
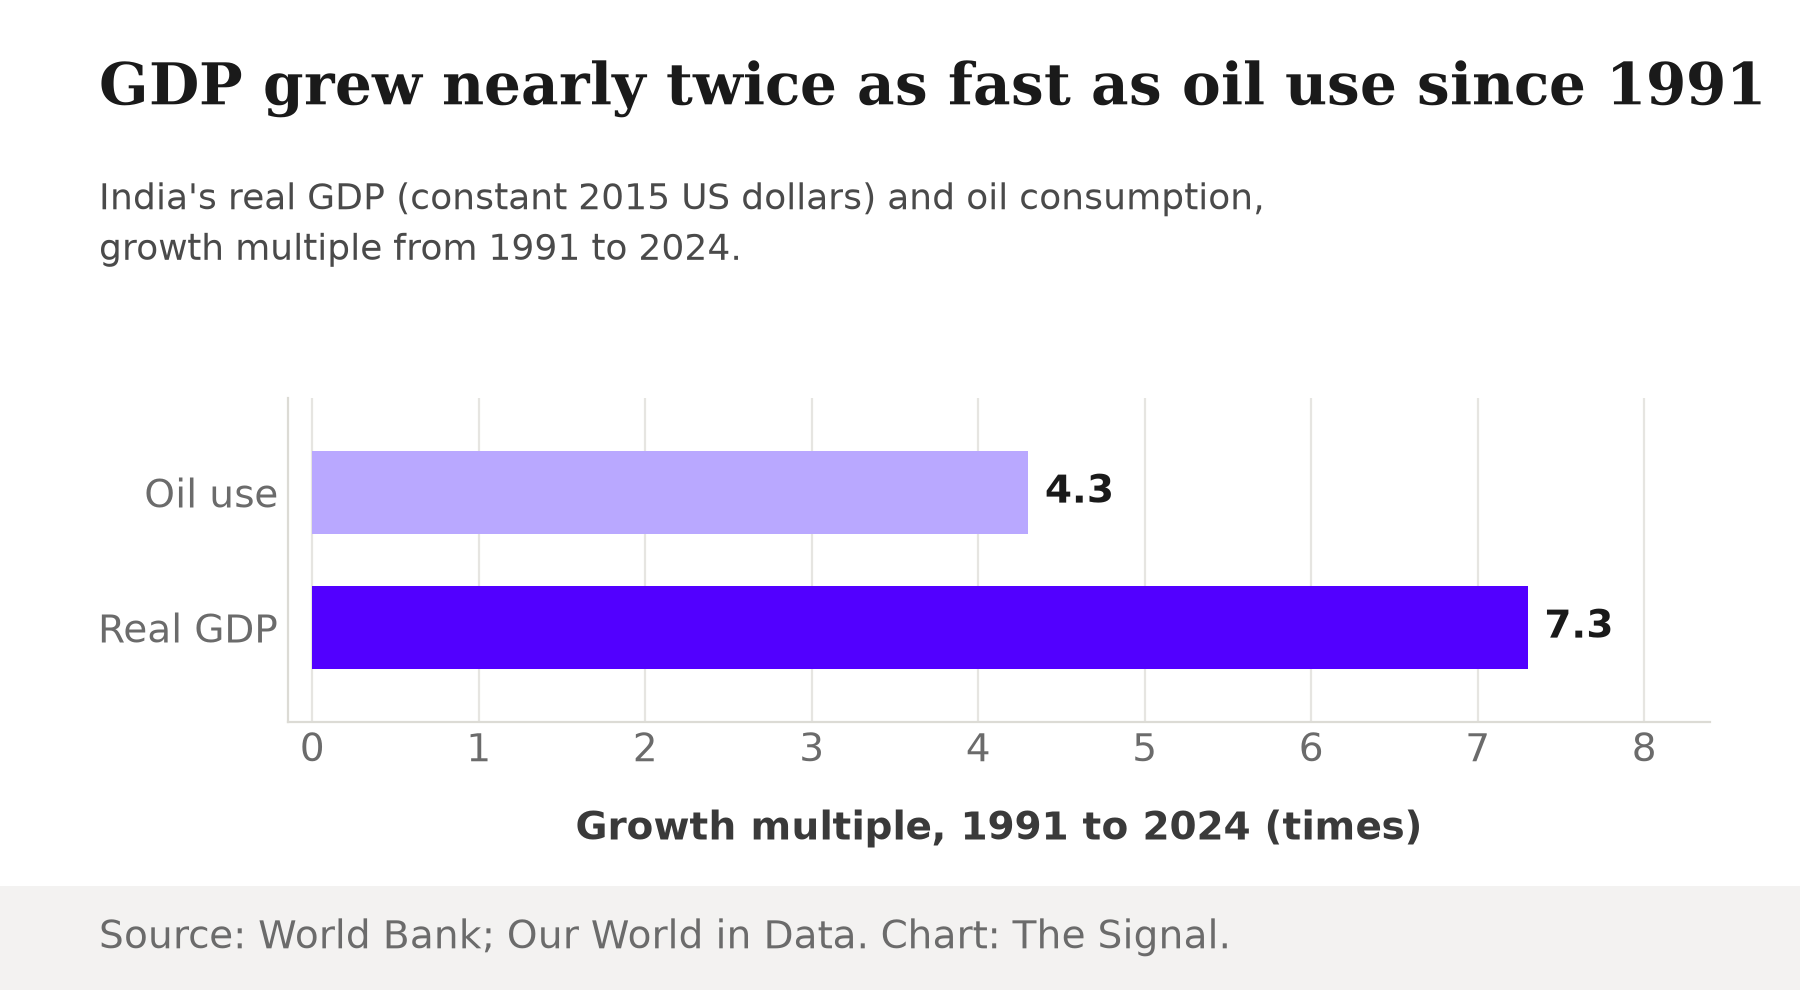
India consumed about 706 terawatt-hours-equivalent of oil in 1991 and about 3,029 terawatt-hours-equivalent in 2024, per Our World in Data's oil-consumption series, compiled from the Energy Institute's Statistical Review of World Energy. Over the same span, India's real GDP, in constant 2015 dollars, grew from about $470 billion in 1991 to about $3,434 billion in 2024, World Bank data show. Divide one by the other and India's oil intensity, the oil burned per dollar of output, fell by 41 percent: from about 1.50 terawatt-hours of oil for every $1 billion of real GDP in 1991 to about 0.88 terawatt-hours in 2024 (our calculation from the two figures above). Oil consumption grew 4.3 times over; GDP grew 7.3 times over. That gap between the two growth lines, not the size of the import bill, is the number this shock should be measured against.
India needs 41 percent less oil for every dollar of GDP than it did in 1991.
What actually broke in 1991
It helps to revisit what happened the last time a Gulf war spiked oil prices, because the arithmetic looked far gentler then than the dependency ratio today suggests. Crude oil prices rose 24 percent in 1990/91 over the previous year, adding about $1,050 million to India's net import bill, equal to 0.4 percent of GDP and 4.6 percent of exports of goods and services, the World Bank's 1991 India Country Economic Memorandum recorded. That shock landed on an economy that imported only about a third of the crude oil it consumed in 1989-90, having already cut that ratio down from two-thirds in earlier oil shocks. Even so, India's foreign exchange reserves collapsed from $2.3 billion at the end of March 1991 to $1.4 billion by April, a single month, and real GDP growth slowed to about 1.1 percent for the year, World Bank data show. A price shock that looks modest by today's standards, hitting an import share that looks enviably low by today's standards, was still enough to tip India into a balance-of-payments crisis. The problem was never the shock's size. It was that the reserve buffer behind it was almost nonexistent.
The same shock, a different balance sheet
India's foreign exchange reserves stood at $666.9 billion for the week ended 26 June 2026, the most recent week the Reserve Bank of India has published. That cushion is now roughly 476 times the $1.4 billion trough of April 1991 (our calculation from the RBI and World Bank figures above). The Rs 74,781 crore under-recovery Puri disclosed for the April-June 2026 quarter is real money: about 0.22 percent of India's Rs 346.36 lakh crore provisional nominal GDP for FY2025-26, worth around $7.8 billion for a single quarter when converted at the roughly Rs 95.4-per-dollar rate the rupee traded at on 2 July 2026. Even so, that loss is landing on public-sector oil company balance sheets and being partly offset by the duty changes at the pump, not forcing the kind of reserve drawdown that broke the country in 1991. Route diversification away from the Strait of Hormuz is doing similar work on the physical side of the shock: procurement that would once have been concentrated through one chokepoint is now spread across a wider set of suppliers, buying time and options that the 1991 economy never had.
The honest objection
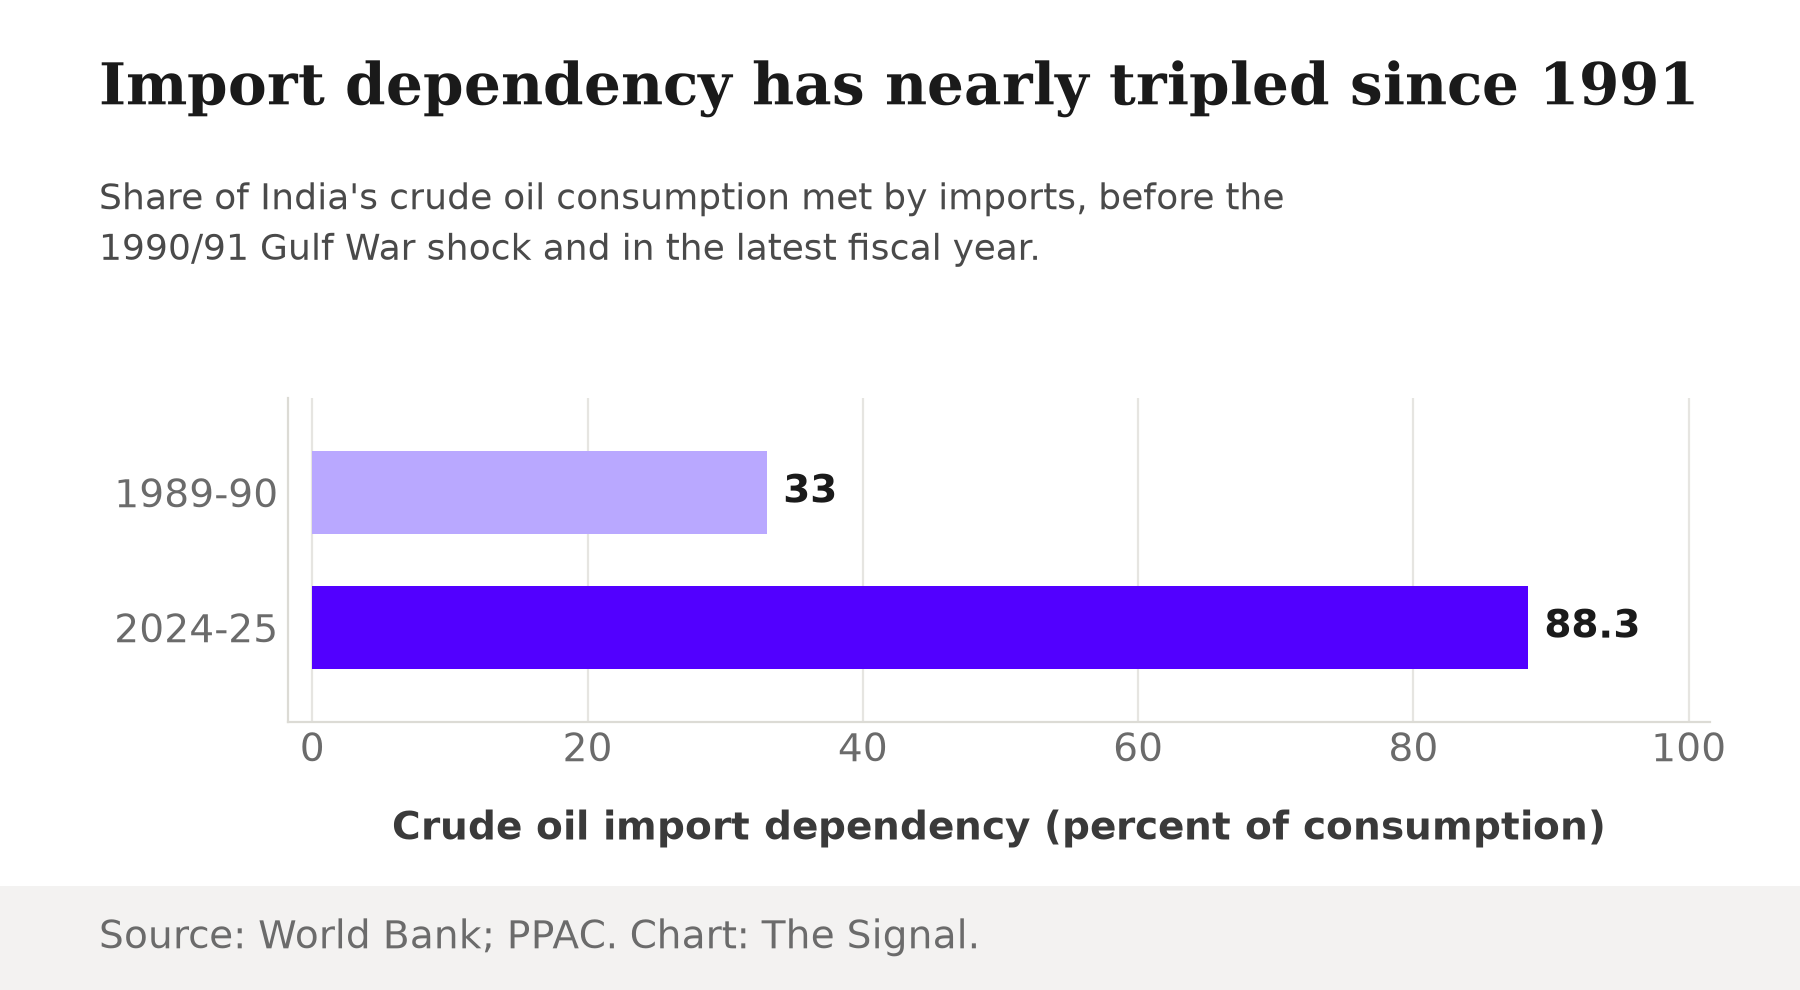
The strongest case against this reassurance is that the intensity gain does not erase the dependency problem, and by the numbers that matter most for a supply shock, things have gotten worse, not better. India's crude oil import dependency has nearly tripled, from about a third of consumption in 1989-90 to 88.3 percent in FY2024-25, and crude oil still supplies about 25 percent of India's primary energy, the second-largest source after coal, per a 2021 IEA estimate cited in a Ministry of Commerce and Industry study of India's crude imports. A war that closes a shipping lane does not care how efficiently India converts oil into GDP; it cares whether the barrels can get to a refinery at all, and on that measure India now has far less of its own oil, and depends on a far larger share of the world's tanker routes than it did in 1991.
Import dependency has nearly tripled since the last comparable oil shock.
That case is real, and it is why the government has spent 2026 on route diversification rather than treating the efficiency gain as sufficient on its own. But the objection answers a different question than the one a price shock actually asks. A blocked shipping lane is a supply problem, addressed by the shift to routes outside the Strait of Hormuz and by importing from a wider set of countries. A price shock hits the balance sheet instead: the 41 percent intensity gain means a given percentage rise in crude prices now extracts a smaller share of GDP than the same rise would have in 1991, while a reserve cushion nearly 476 times deeper absorbs whatever it does extract. Both things can be true at once: the physical supply chain is more exposed, and the financial system is far better cushioned against the price consequences of that exposure.
The Signal
India's oil story in 2026 is really two separate stories wearing one statistic. The import-dependency number, 88.3 percent, is a story about physical supply risk, and on that count India is more exposed than in 1991, which is exactly why the government has spent the year rerouting tankers around the Strait of Hormuz. The energy-intensity number, the 41 percent drop, tells a financial-resilience story instead: the same size of price shock now drags far less on GDP, backed by a reserve buffer 476 times larger than the one that ran out in a single month in 1991. Watch which number officials reach for next time crude spikes: the dependency ratio makes the case for more diversification and strategic reserves, while the intensity number is the reason a shock of this size has not, so far, forced the kind of emergency borrowing that followed the last one.
Reporting basis: the oil marketing companies' under-recovery figure and its attribution to Union Petroleum Minister Hardeep Singh Puri are as reported by the Daily Excelsior, carrying a PTI wire. The Hormuz-diversification and fuel-duty details are from Ministry of Petroleum and Natural Gas briefings carried by the Press Information Bureau. Crude oil import dependency and the 25 percent primary-energy share are from the Petroleum Planning and Analysis Cell and a Ministry of Commerce and Industry study, respectively, the latter citing IEA data from 2021. Oil consumption volumes for 1991 and 2024 are from Our World in Data's compilation of the Energy Institute's Statistical Review of World Energy. Real GDP levels and growth for 1991 and 2024, and foreign exchange reserves as of 26 June 2026, are World Bank and Reserve Bank of India data respectively. Nominal GDP for FY2025-26 is from the Ministry of Statistics and Programme Implementation's Provisional Estimates press note, and the rupee-dollar exchange rate for 2 July 2026 is from the U.S. Federal Reserve's H.10 release. The 1990/91 price shock, import-dependency and reserves figures for that period come from a single World Bank country economic memorandum and are not independently cross-checked against a second source. The energy-intensity percentages, the oil-versus-GDP growth multiples, the OMC loss's share of FY2025-26 GDP and its dollar equivalent, and the multiple by which current reserves exceed the 1991 trough are The Signal's calculations from those figures.