Every July, the World Bank quietly resets which income bracket every country belongs to for the fiscal year ahead. The World Bank Group's current country classification list shows India as a lower-middle-income economy for fiscal year 2027, the twelve months running July 2026 to June 2027. That is not a new result. The World Bank's country analytical classification history shows India has held the lower-middle-income label for 19 straight fiscal-year classifications, from FY09 through FY27, ever since it graduated out of the low-income group. Read only the headline, and the country looks settled: one bracket, one number, for two decades running.
It is worth slowing down on that settledness. A national income classification is a single figure applied to over a billion people spread across state economies that look nothing alike. Once you convert what those states actually produce per head into the same dollars the World Bank uses for its own classification, the single-bracket story stops holding.
MoSPI's state-wise domestic product release puts Bihar's per-capita net state domestic product at Rs 54,111 in 2022-23, versus Rs 4,61,910 in Delhi and Rs 5,32,854 in Goa, both for 2023-24. Converted at the World Bank's own 2023 Atlas conversion factor of 82.79 rupees to the dollar, Bihar's figure works out to roughly $654 a head, Delhi's to about $5,579, and Goa's to about $6,436, our calculation. The World Bank's Data Help Desk sets its FY2027 upper-middle-income band at $4,636 to $14,375 a head, based on 2025 GNI data. Delhi and Goa's converted figures both clear that floor. Bihar's falls inside the World Bank's low-income band outright, whose ceiling is $1,175, not merely short of the middle.
State income already spans the World Bank's whole ladder
Two states already convert above the upper-middle line; several sit close beneath it; one falls into the low-income band entirely.
| State | Per-capita NSDP (Rs) | Year | Converted (US$)* | Versus the $4,636 upper-middle line |
|---|---|---|---|---|
| Bihar | 54,111 | 2022-23 | ~$654 | Inside the low-income band |
| Tamil Nadu | 3,13,955 | 2023-24 | ~$3,792 | 18% short |
| Haryana | 3,25,759 | 2023-24 | ~$3,935 | 15% short |
| Karnataka | 3,32,926 | 2023-24 | ~$4,021 | 13% short |
| Telangana | 3,47,299 | 2023-24 | ~$4,195 | 10% short |
| Delhi | 4,61,910 | 2023-24 | ~$5,579 | 20% above |
| Goa | 5,32,854 | 2022-23 | ~$6,436 | 39% above |
Converted at the World Bank's 2023 Atlas rate, The Signal's calculation. Source: MoSPI, state-wise SDP release; World Bank Atlas conversion factor; World Bank FY2027 income thresholds.
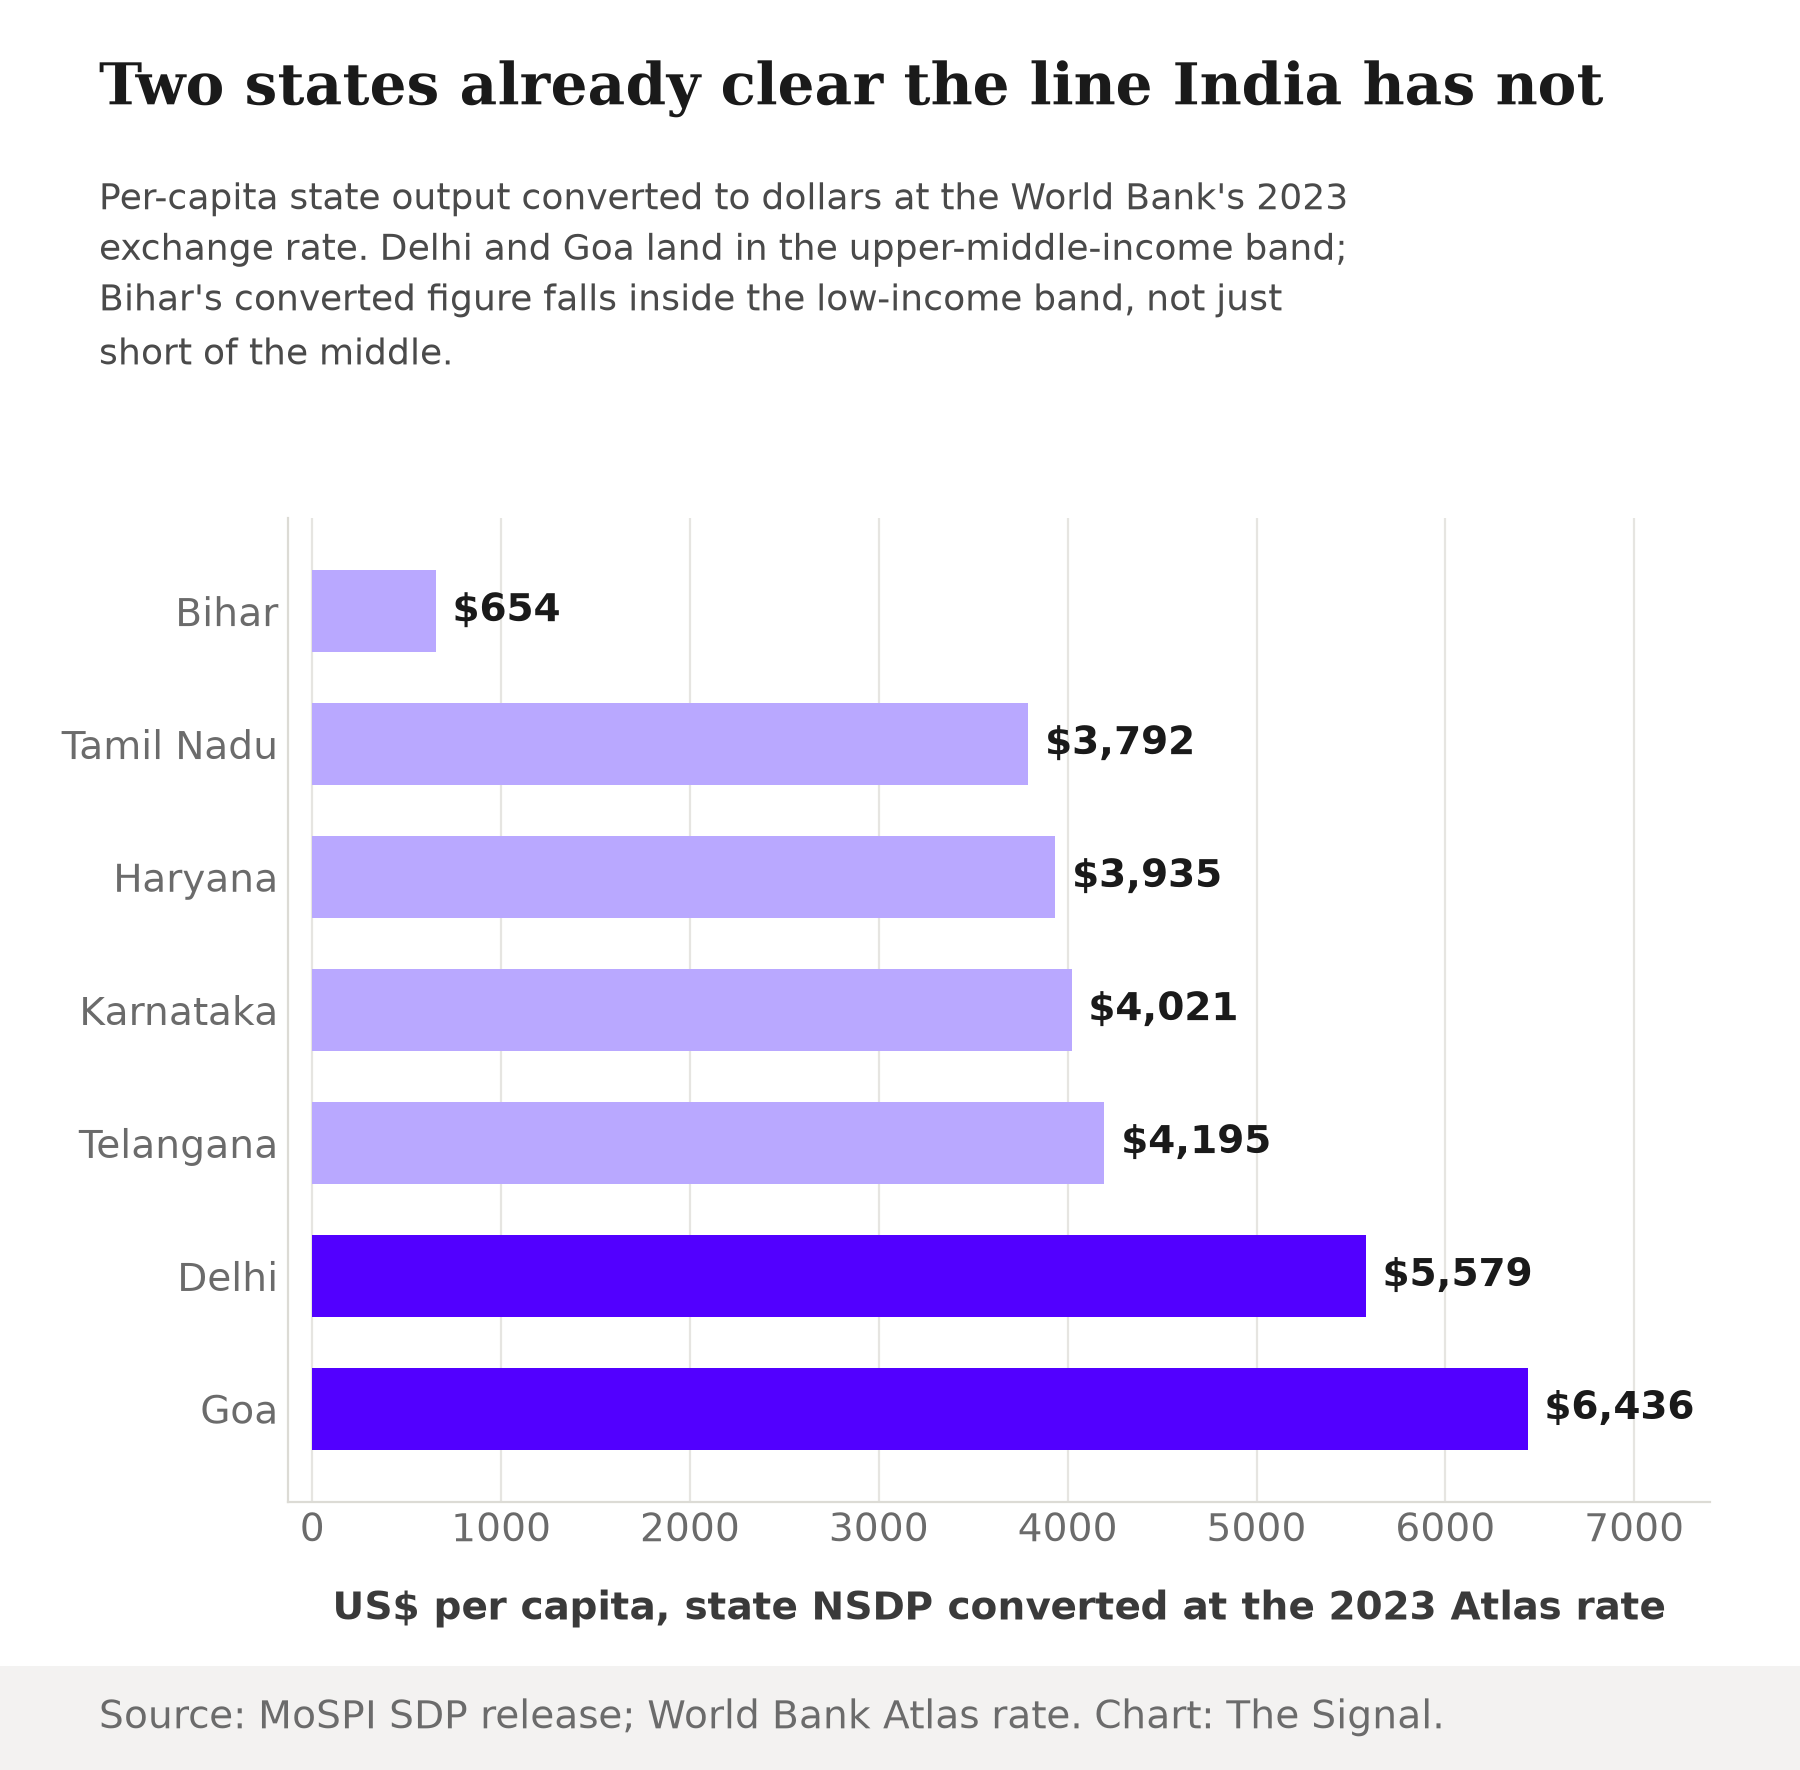
Telangana sits closest of the rest, about 10 percent under the $4,636 line. Tamil Nadu, a much larger and equally industrialised state, is further back, about 18 percent short. Bihar is not just behind the pack, it would fall into an entirely different World Bank category from the rest of the table.
Two states already out-earn a country that just crossed
A World Bank Data Blog analysis reports that five countries, Jordan, Micronesia, the Philippines, Sri Lanka and Vietnam, moved from lower-middle to upper-middle income in the FY2027 update, while Togo moved up from low income and no country moved down. World Bank data show the Philippines' own GNI per capita reached $4,850 in 2025, only narrowly above the $4,636 threshold. Delhi's converted $5,579 and Goa's converted $6,436 both already exceed that whole country's national figure.
A newly upper-middle-income country's GNI per capita is lower than two Indian states' converted output.
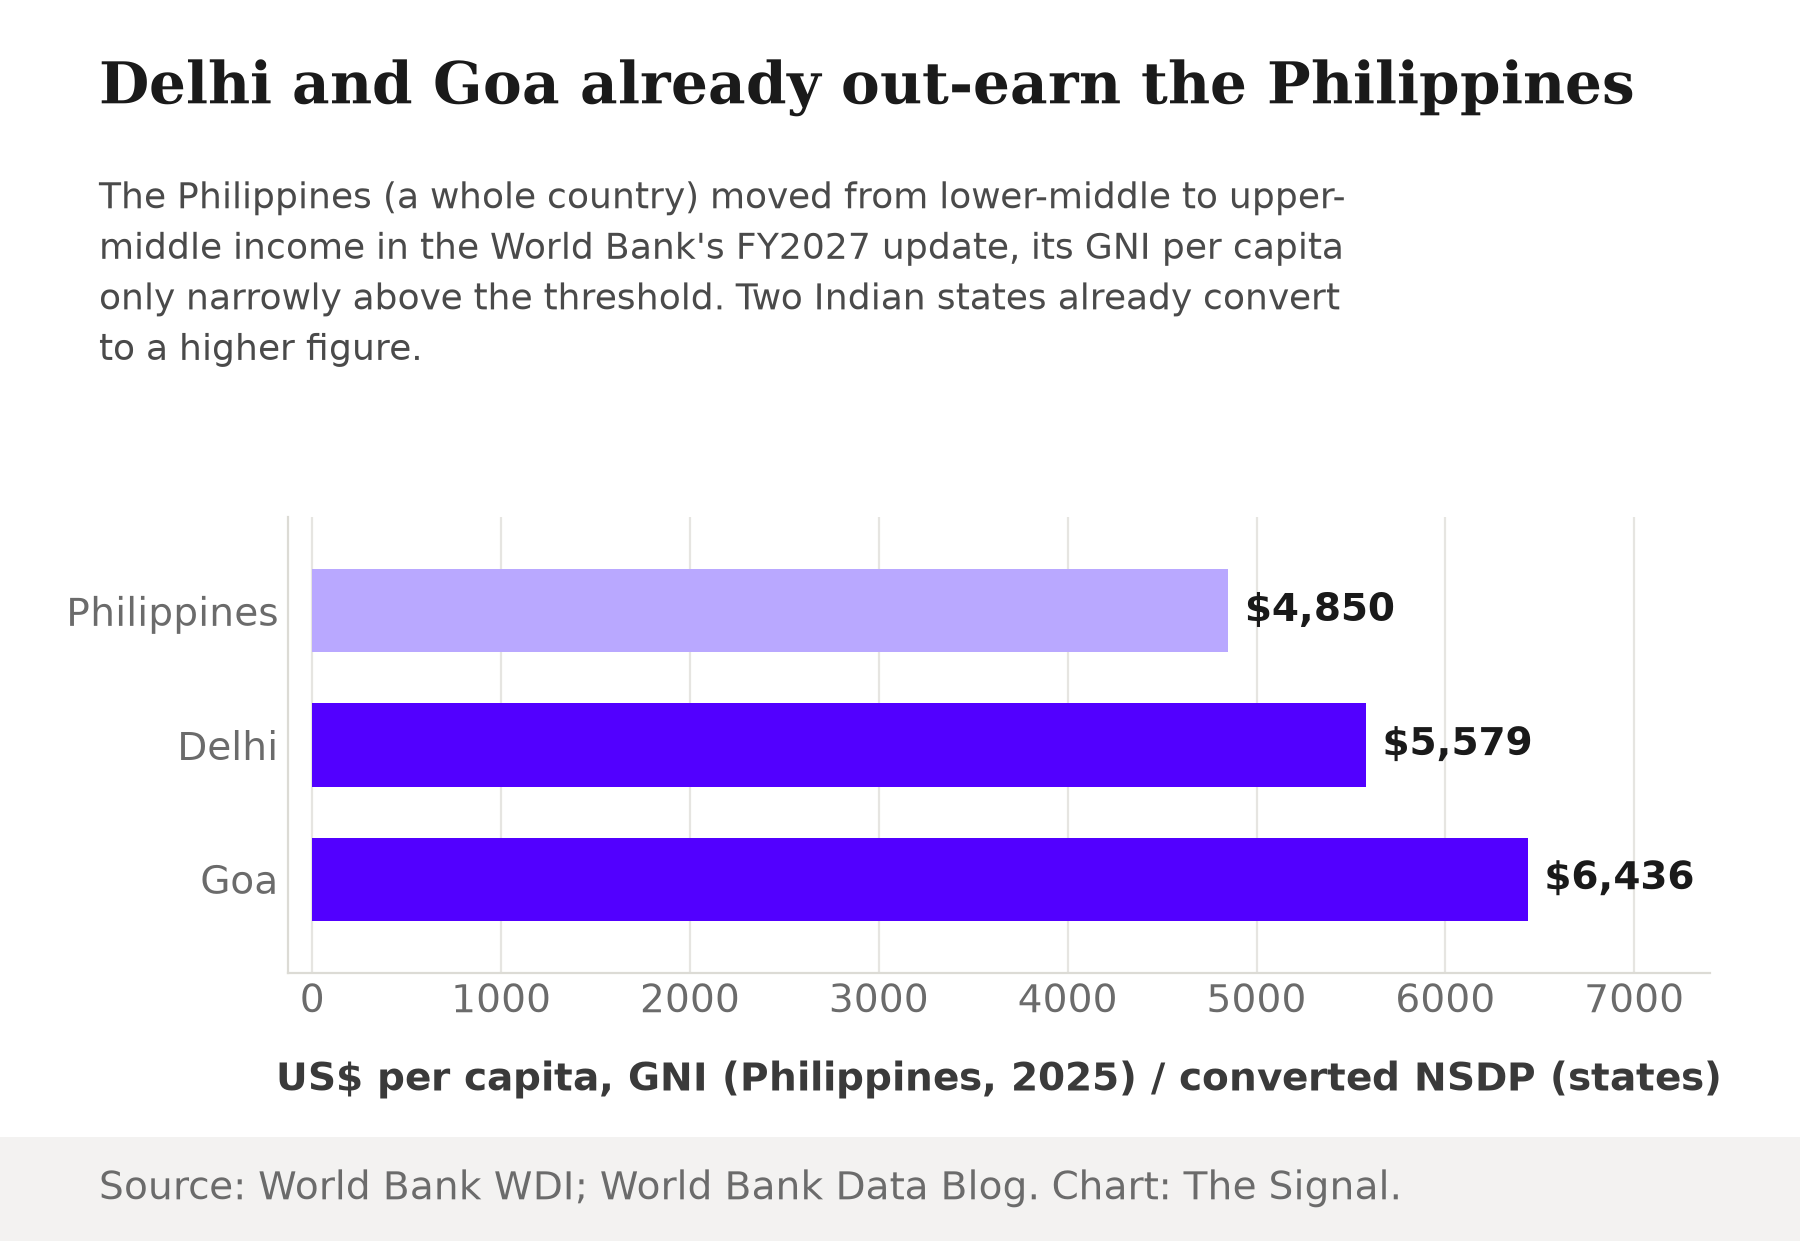
Source: World Bank, World Development Indicators; World Bank Data Blog, FY2027 update. State figures are The Signal's calculations.
The Philippines is not the narrowest crossing among the five. World Bank data show Sri Lanka's GNI per capita at $4,670, just $34 above the $4,636 floor, and Micronesia's at $4,760. Vietnam's GNI per capita reached $4,970 and Jordan's $5,260, the highest of the five, still short of Delhi's converted $5,579. None of the five countries that crossed into upper-middle income this year has a GNI per capita as high as Delhi's converted figure, let alone Goa's.
The national number is barely moving
World Bank data show India's own GNI per capita, calculated the same Atlas way, was $2,760 in 2025, up from $2,550 in 2024 and $2,490 in 2023, a rise of about 11 percent in two years, our calculation. At that pace the gap to the $4,636 threshold is not closing quickly. India's national figure sits at roughly 60 percent of the line some of its own states already clear.
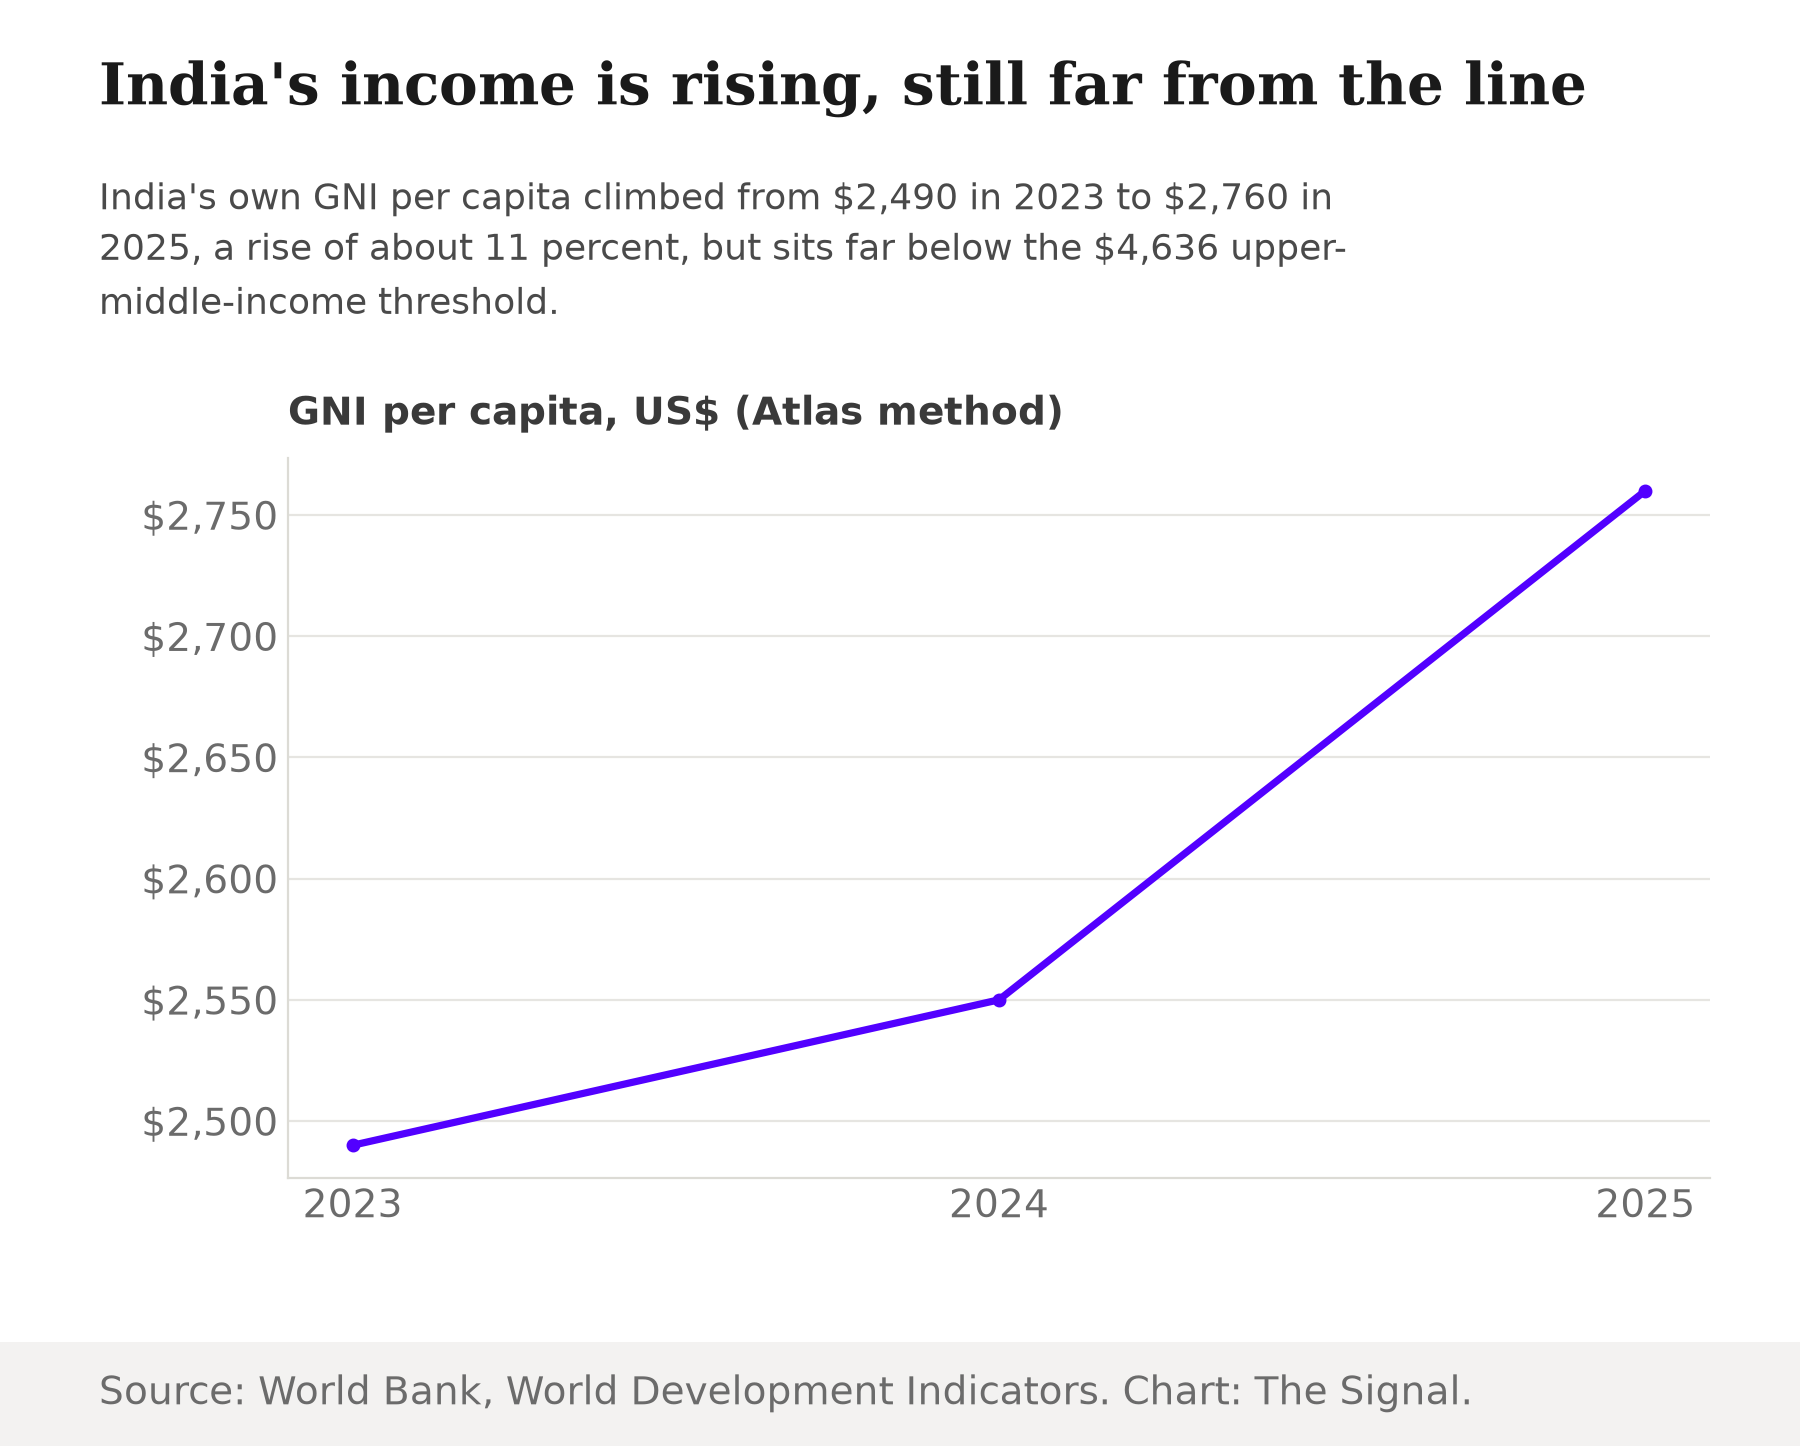
Source: World Bank, World Development Indicators. Growth rate is The Signal's calculation.
The honest objection
The strongest case against reading anything into this comparison is that it mixes two different measurements. Net state domestic product is a state's total production per head; the World Bank's own GNI per capita is a national income measure that also nets out income earned abroad, and it need not move in lockstep with a single year's conversion rate. States are not assessed for World Bank income classification at all, only countries are. On that view, Delhi and Goa's converted figures are an illustrative conversion, not a real reclassification, and nothing here should be read as the World Bank saying anything about any Indian state.
That case is real. But the gaps involved are wide enough that a different conversion year or a stricter income measure would need to close them entirely to reverse the conclusion. Goa's converted figure sits 39 percent above the upper-middle floor, and Bihar's sits at little more than half the low-income ceiling. A methodological quibble narrows margins that size. It does not erase them.
The Signal
The World Bank treats India as one number, and by that number the country has not moved in 19 years. But the economy underneath the number already spans both ends of the World Bank's own ladder: a capital and a coastal state whose converted output already clears the upper-middle line, and a large, populous state whose converted output falls short of even the low-income ceiling. The national classification that matters for headlines is unlikely to shift for years. The gap that actually describes Indian incomes today is not the one between India and the rest of the world. It is the one between Bihar and Delhi.
Reporting basis: India's FY2027 country classification is from the World Bank Group's own classification list and its 19-year run in the lower-middle-income group from the Bank's historical classification archive. The $4,636-to-$14,375 upper-middle-income band is from the World Bank's Data Help Desk. India's and the Philippines' GNI per capita are World Bank data, and the five countries that moved up in the FY2027 update are from the World Bank's Data Blog. State-level per-capita NSDP figures are from MoSPI's state-wise domestic product release. The dollar conversions of state NSDP, using the World Bank's 2023 Atlas conversion factor, the percentage gaps to the upper-middle-income threshold, and India's two-year growth rate are The Signal's calculations from those figures.