India is closing four trade negotiations inside a single half-year. The India-UK Comprehensive Economic and Trade Agreement (CETA), along with a companion social-security pact, enters into force on 15 July 2026, after both countries completed their ratification procedures (PIB). India and the European Union jointly announced the conclusion of the India-EU Free Trade Agreement on 27 January 2026, at the 16th India-EU Summit (PIB). New Zealand and India signed their own bilateral FTA on 27 April 2026 (New Zealand MFAT). And in February 2026, India and the United States reached an interim tariff framework, the most recent entry in a run of nine FTAs India has signed since 2021 (Ministry of Commerce & Industry). Four separate partners, one six-month window: the natural read is that India has become a genuinely fast, confident trade negotiator.
It is worth slowing down on that. Take the EU deal apart and the "sprint" story gets complicated fast: those negotiations were relaunched in 2022 (PIB) and did not conclude until January 2026. That is roughly four years for one agreement, by our calculation from the two dates in that same announcement. The four deals did not all move quickly. They just happen to be finishing at the same time.
The single figure worth holding onto: India has signed nine FTAs since February 2021, against five in the six years from 2005 to 2011 per the DGFT's list, and the nine-since-2021 figure comes from the Ministry of Commerce & Industry. The pace genuinely picked up. But the six-month cluster making headlines this year is a coincidence of scheduling, not proof of a newly discovered negotiating speed.
Two decades, counted in FTAs
India's comprehensive FTA program began with five agreements signed between 2005 and 2011: Singapore, South Korea, ASEAN, Japan, and Malaysia, per the DGFT's official list of India's FTAs. Then nothing. No new comprehensive FTA followed for a decade, until the India-Mauritius Comprehensive Economic Cooperation and Partnership Agreement was signed on 22 February 2021, the same DGFT list shows. Since that Mauritius deal, India has signed nine FTAs spanning 38 countries, most recently reaching the framework agreement with the United States in February 2026 (Ministry of Commerce & Industry).
India has roughly doubled its own historical pace of trade dealmaking since 2021 (Ministry of Commerce & Industry), and this year's four deals are the visible edge of that longer run, not a new phenomenon on their own. The nine-since-2021 figure spans about five years to the US framework; the five-in-the-2005s figure, per the DGFT's list, spans six years. Nine over five is a faster clip than five over six, on the numbers as stated above (our calculation, from those same two counts). What changed was not any single negotiation getting faster. What changed is that India stopped letting a decade pass between agreements.
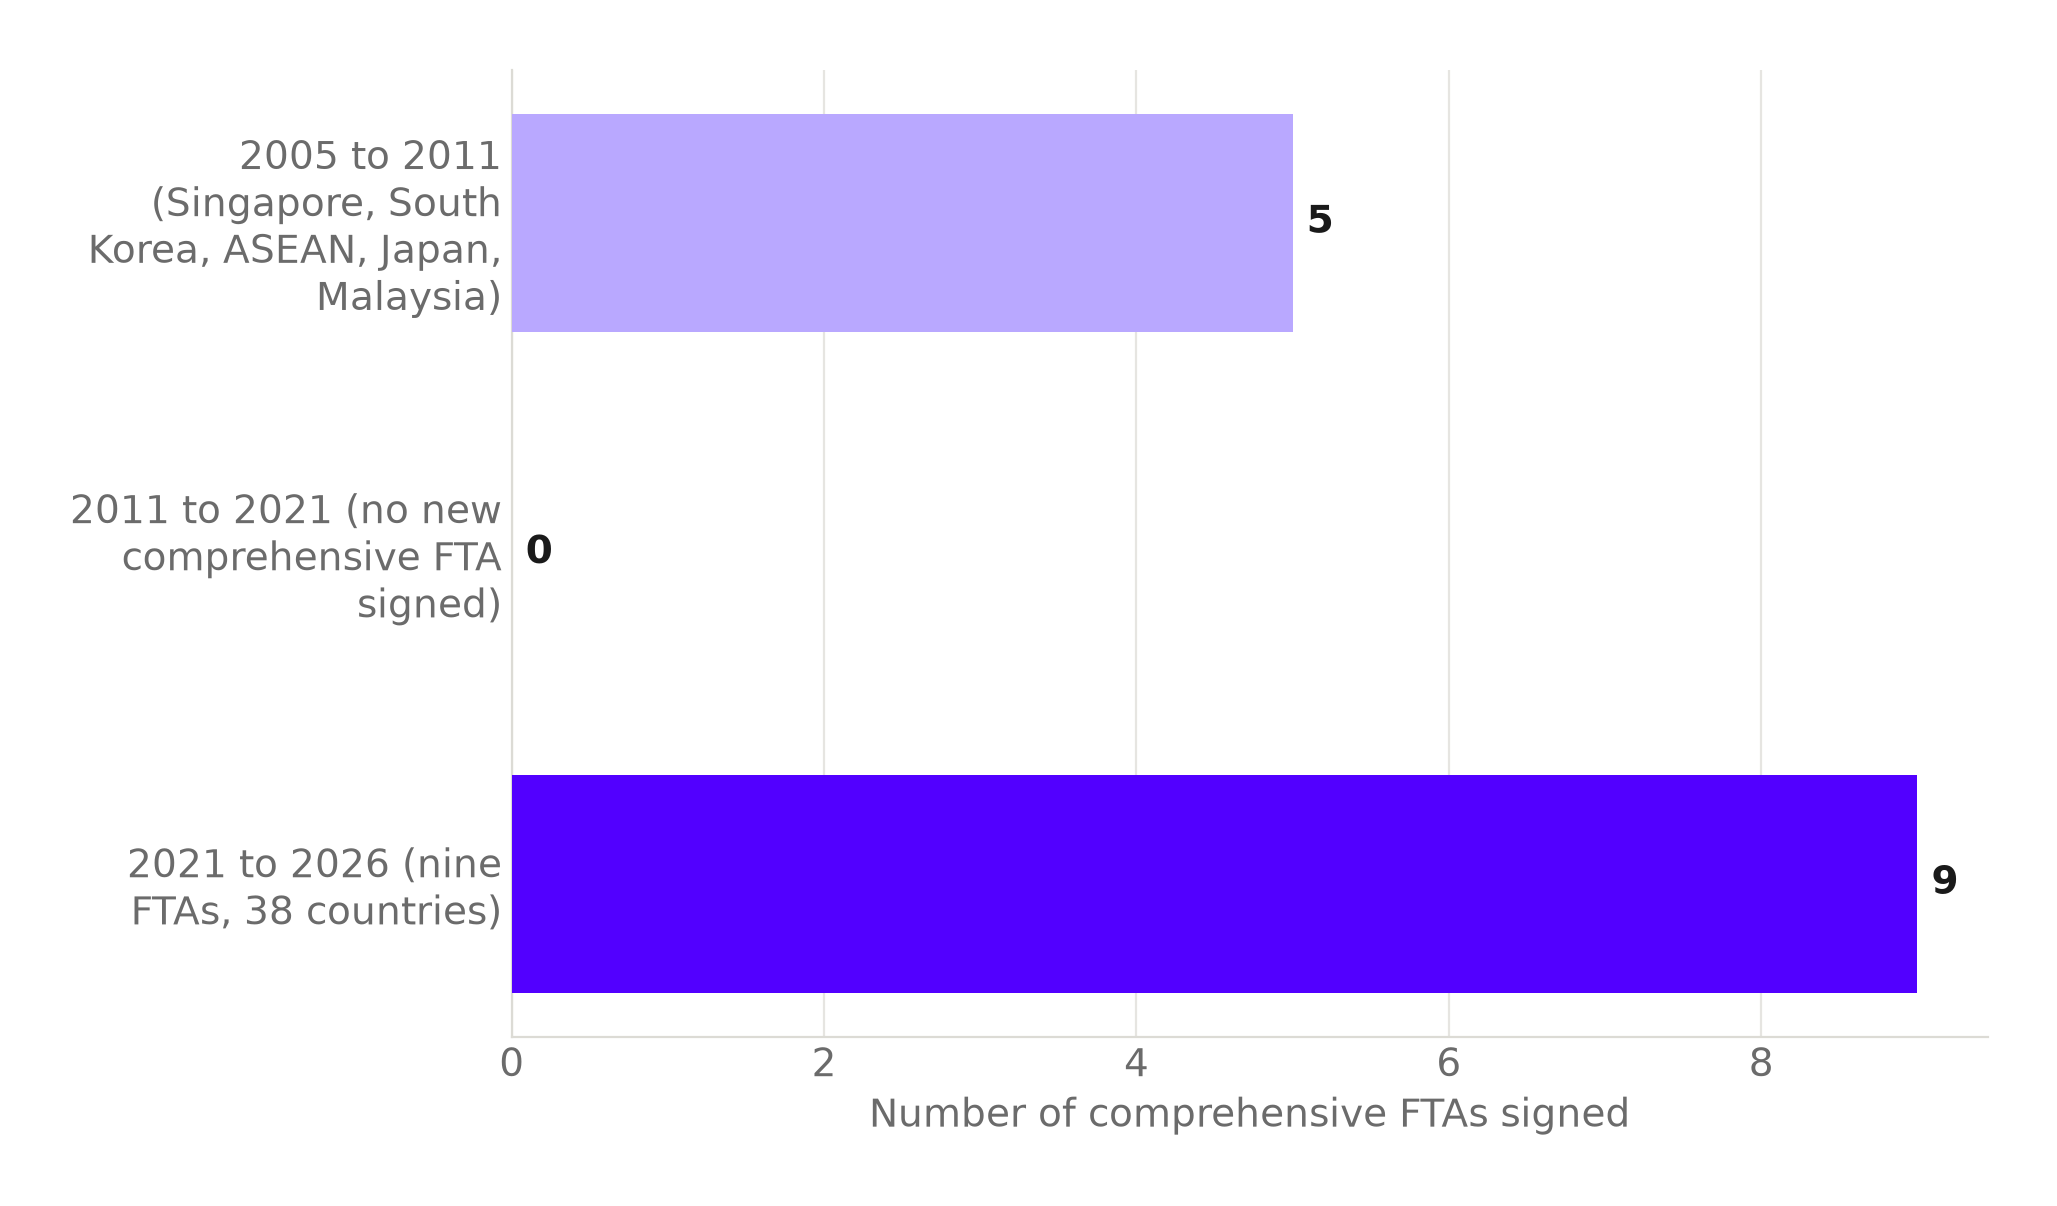
Source: DGFT's official list of India's FTAs, PIB. Chart: The Signal.
What each deal actually contains
The four 2026 milestones are not the same size. The EU relationship is the heaviest: bilateral trade in goods between the EU and India totalled €120 billion in 2024, the base the new FTA builds on (European Commission). New Zealand sits at the other end: total two-way trade between the two countries was NZ$3.68 billion in the year to June 2025 (New Zealand MFAT), a fraction of the EU relationship in scale even before accounting for the different currencies.
| Partner | 2026 milestone | Date |
|---|---|---|
| United Kingdom | CETA and Double Contribution Convention enter into force | 15 July 2026 |
| European Union | FTA concluded; entry into force still pending | 27 January 2026 |
| New Zealand | Bilateral FTA signed | 27 April 2026 |
| United States | Interim tariff framework reached | February 2026 |
Source: PIB (UK), PIB (EU), New Zealand MFAT, PIB (US framework).
The US framework is the narrowest of the four in form: it is not a signed FTA but an interim tariff arrangement. Even so, it carries real weight. Tariffs on USD 30.94 billion of India's US-bound exports were cut from 50% to 18%, and tariffs on a further USD 10.03 billion were cut from 50% to zero (PIB backgrounder). Add those two figures and roughly USD 41 billion of Indian exports to the US got some tariff relief in one framework, by our calculation from the same backgrounder.
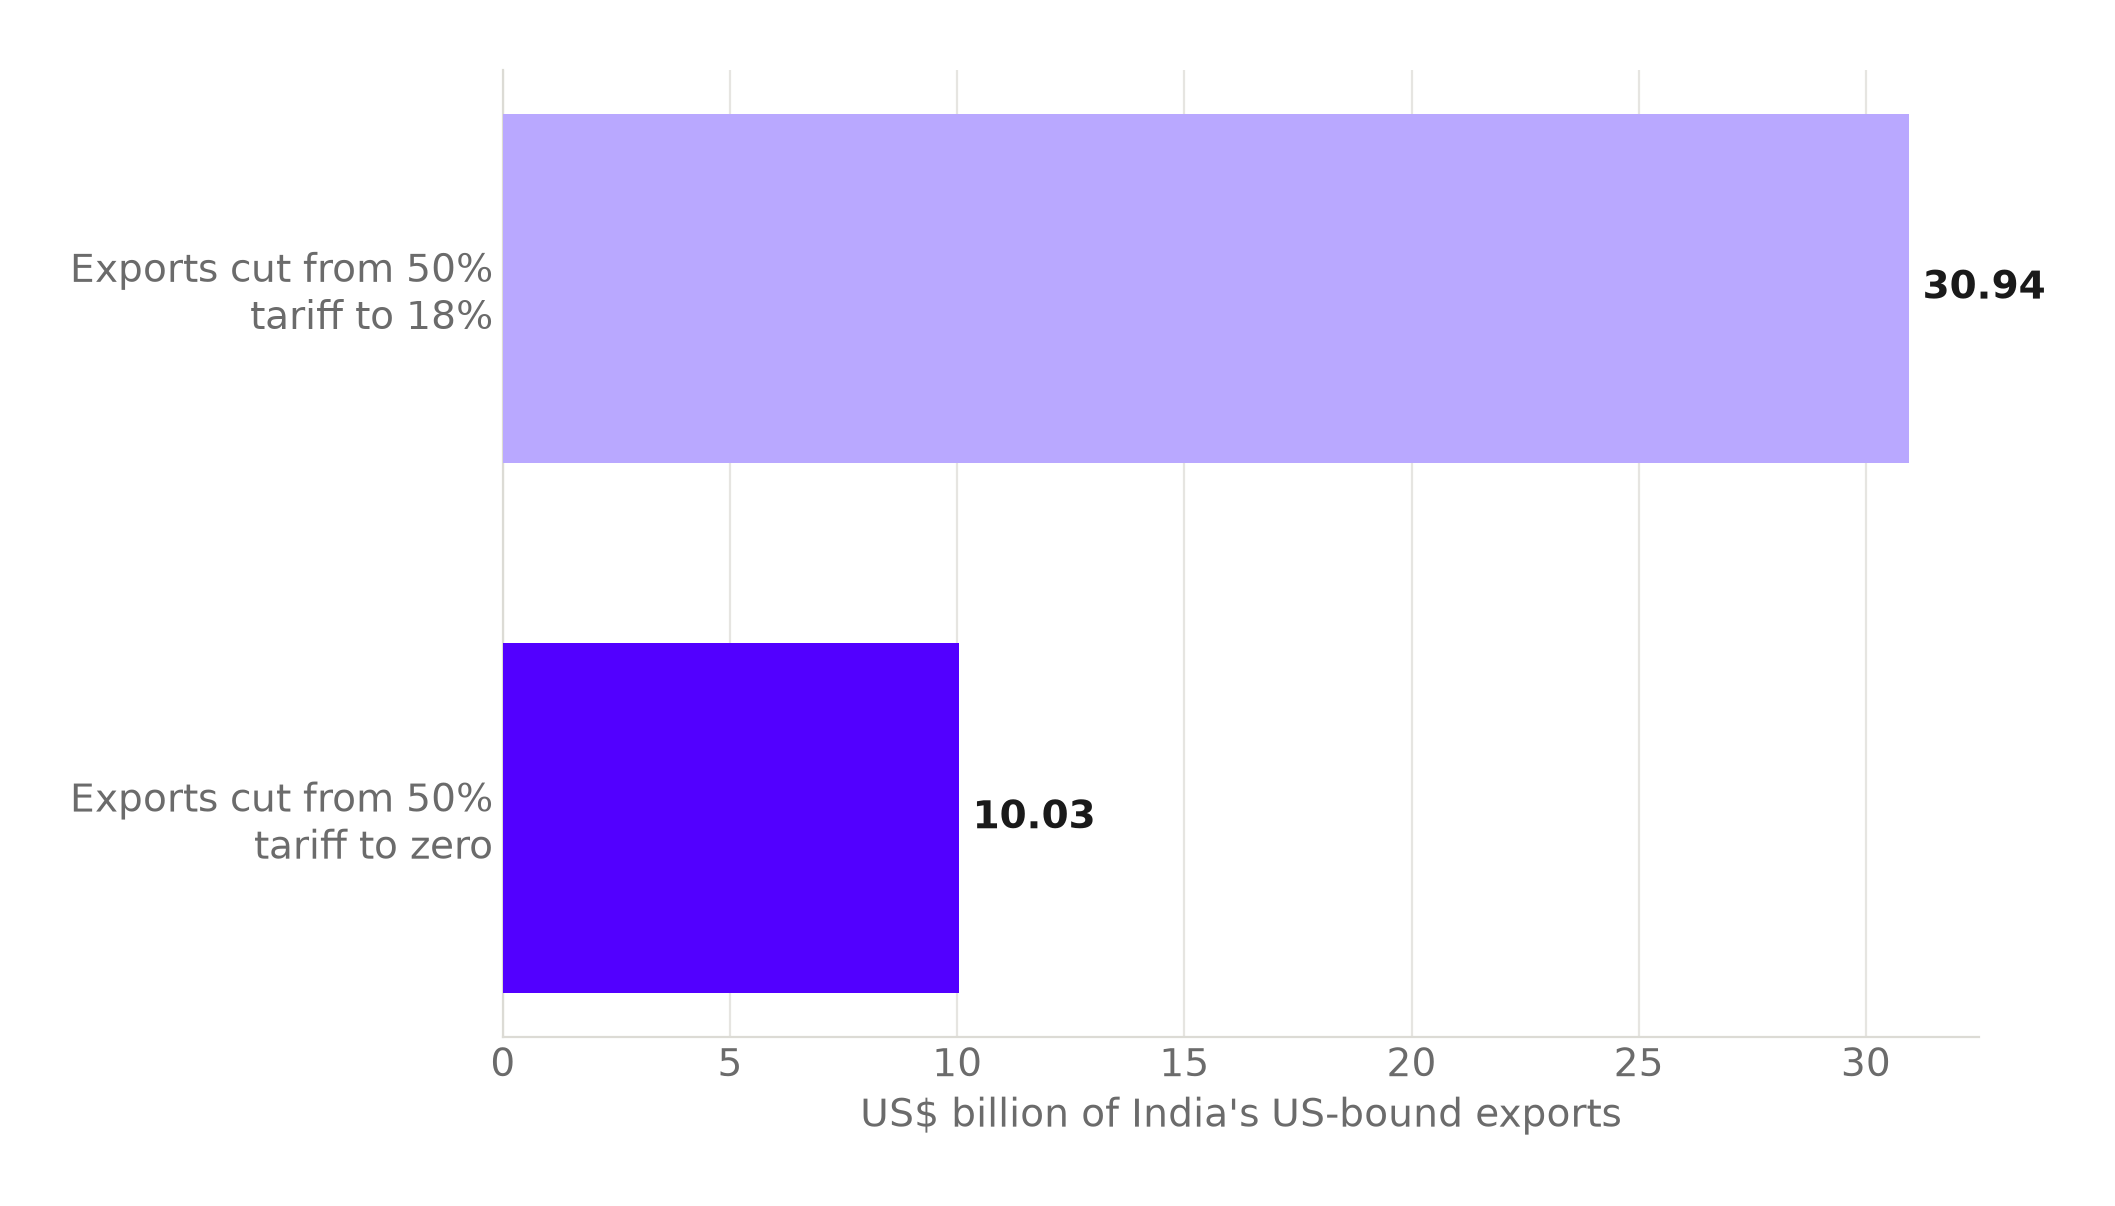
Source: PIB backgrounder, February 2026. Chart: The Signal.
CETA, by contrast, is a full-scope goods agreement, and it is not shallow. Under its terms, India will remove tariffs on 64% of its tariff lines immediately at entry into force, rising to 85% of tariff lines duty-free after a ten-year phase-in (UK government). That is real, structural liberalization, not a symbolic gesture timed for a press release. It is also not total: 15% of India's tariff lines stay protected even after a decade, a reminder that the "four deals" label covers agreements with very different depth.
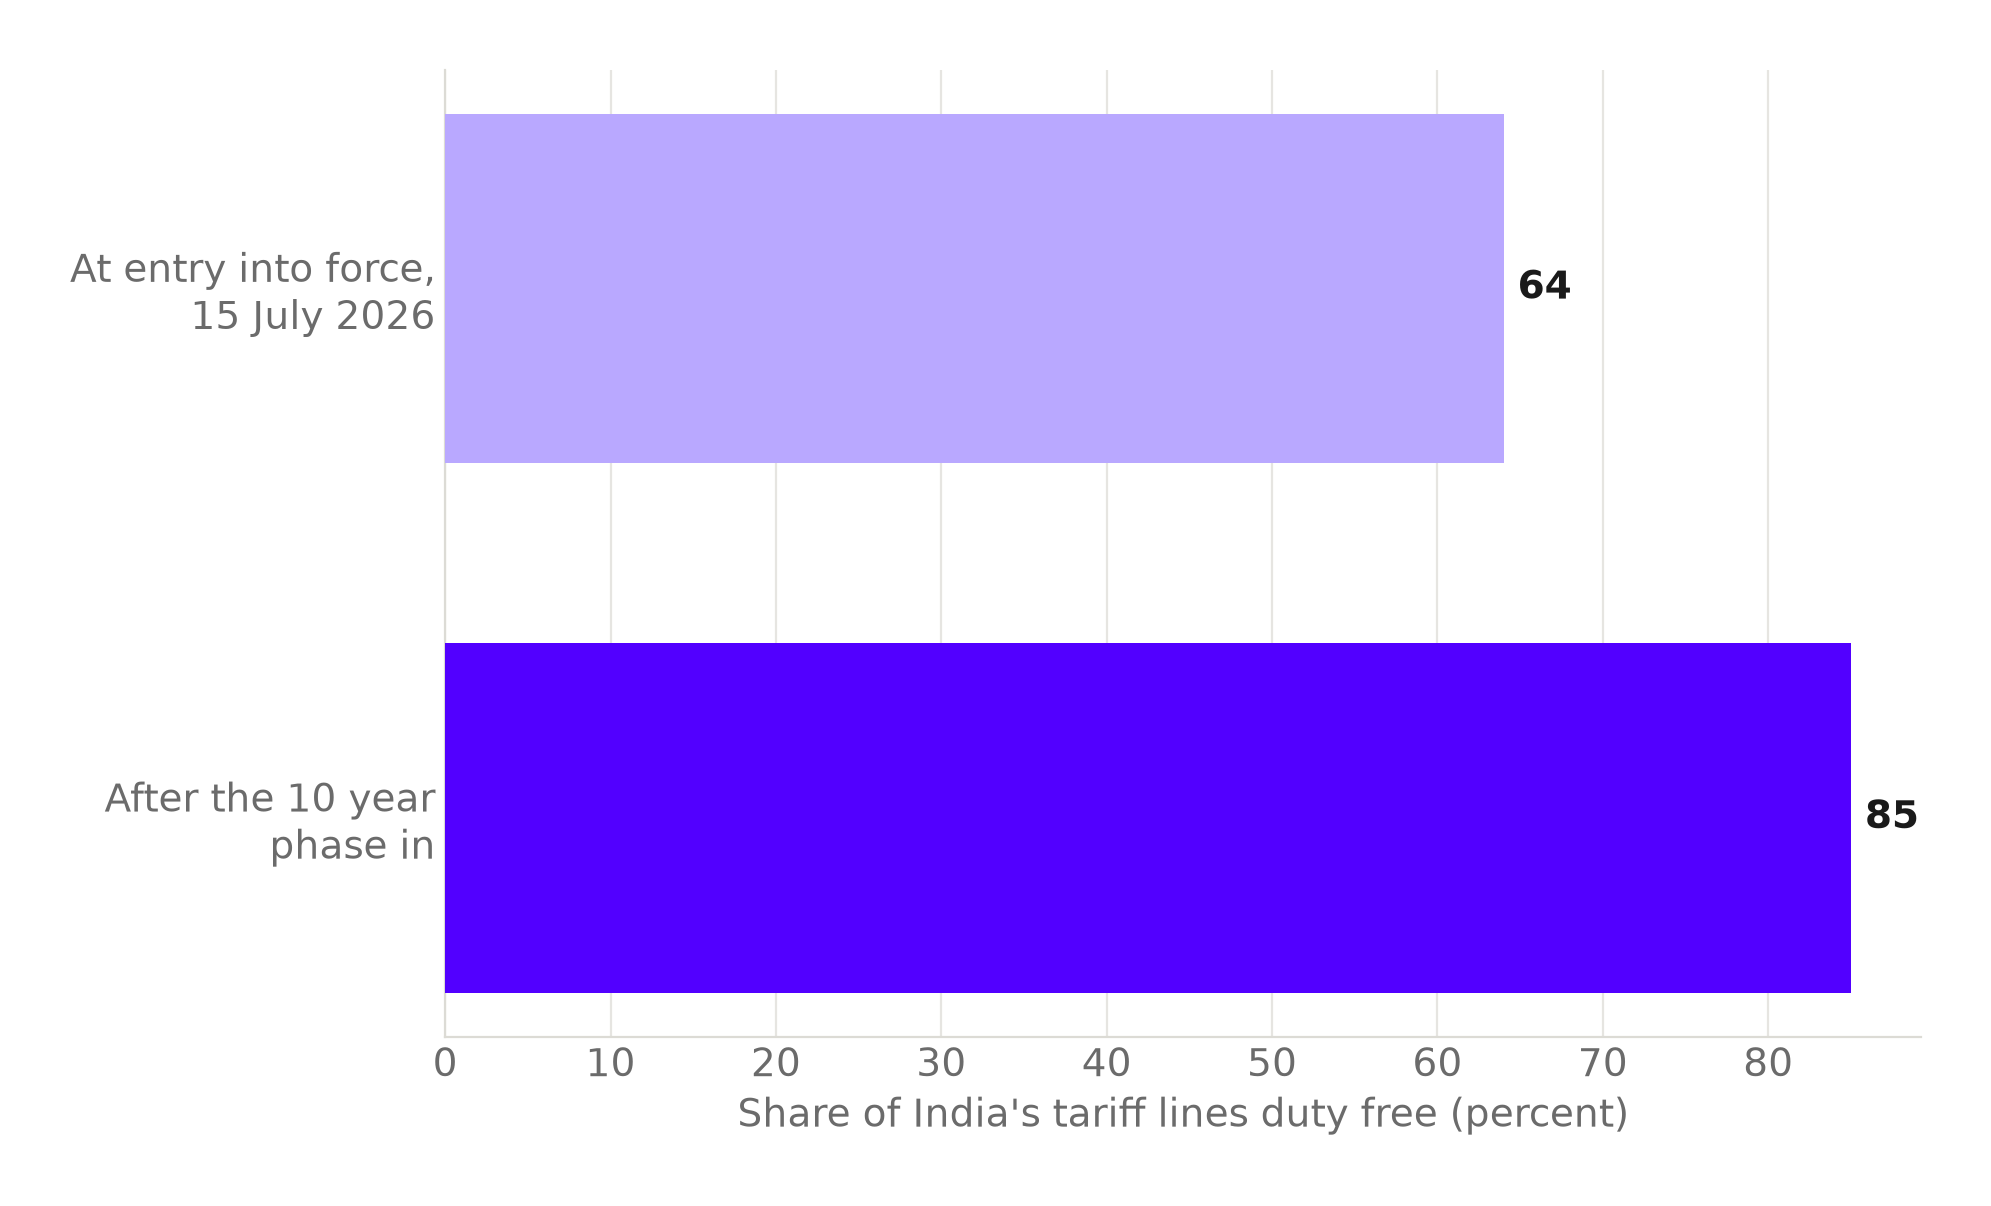
Source: UK government, CETA Chapter 2. Chart: The Signal.
The honest objection
The strongest case against this piece's framing is that simultaneity is itself a form of capacity. Running the UK ratification, the EU legal process, the New Zealand signature, and the US tariff framework in the same half-year requires enough negotiators, legal reviewers, and political bandwidth to keep four tracks moving at once. That is not nothing. A government that could only manage one live negotiation at a time could not have produced this year's calendar, whatever the individual timelines behind each deal.
That objection is fair, and it matches how the Ministry of Commerce & Industry itself frames the run: India has steadily expanded its network of free trade agreements over the past few years, reaching nine FTAs spanning 38 countries (Ministry of Commerce & Industry). "Steadily" is the operative word. The capacity to run several negotiations in parallel was built up over the five years since the Mauritius deal, not switched on this year. And even with that capacity in place, the EU track alone still took about four years from relaunch to conclusion. Parallel capacity explains why four deals can land in the same half-year. It does not mean any single negotiation got faster.
The other two tracks split the difference, and not evenly. The UK and India formally launched CETA negotiations on 13 January 2022 (UK Government); against the 15 July 2026 entry into force, that is roughly four and a half years, in the same range as the EU's timeline, by our calculation from those two dates. New Zealand breaks the pattern entirely: negotiations launched on 17 March 2025 (New Zealand MFAT) and the FTA was signed on 27 April 2026, about 13 months later, by our calculation from those two dates. One of the four deals genuinely was fast. The other three make the "years, not months" case; New Zealand is the exception that shows India can move quickly when a deal is narrower and lower-stakes, not proof that the slower tracks have gotten any faster.
There is a wider backdrop worth naming too. As of 10 June 2026, 383 regional trade agreements were in force worldwide (World Trade Organization). India's cluster of four is a visible run for India specifically, set against a global system where hundreds of overlapping trade agreements are already the norm, not the exception.
What to watch
The next test is not another signing ceremony. It is whether the EU deal, concluded in January but not yet in force, clears its own ratification process as cleanly as the UK agreement just did, and whether India uses this five-year run of nine deals to open a tenth negotiation rather than treating 2026 as a finish line. The commerce ministry's own language points to a network still being built, not a lap being taken. The number to watch next is not how many deals get announced in a year. It is how many years pass before the next one after this cluster clears.
Reporting basis: this analysis draws on official government releases and trade-ministry documents from India (PIB, DGFT), the United Kingdom, the European Union, New Zealand, and the World Trade Organization, as listed in the sources above. The rate comparisons (FTAs per year across eras, the combined US tariff-relief figure, and the negotiation lengths for the EU, UK, and New Zealand tracks) are derived by The Signal from the dated figures each cited source states, not figures those sources compute themselves.